Modeling Climate Impacts and Adaptation: An analytical framework and application in U.S. agriculture sector
←
→
Page content transcription
If your browser does not render page correctly, please read the page content below
Modeling Climate Impacts and Adaptation:
An analytical framework and application in
          U.S. agriculture sector
                                Allen Fawcett*
     Stephanie Waldhoff, Xuesong Zhang, Jia Li, Jeff Cole, Richard Moss
                    U.S. Environmental Protection Agency
         12th Integrated Assessment Modeling Consortium meeting
                              December 3, 2019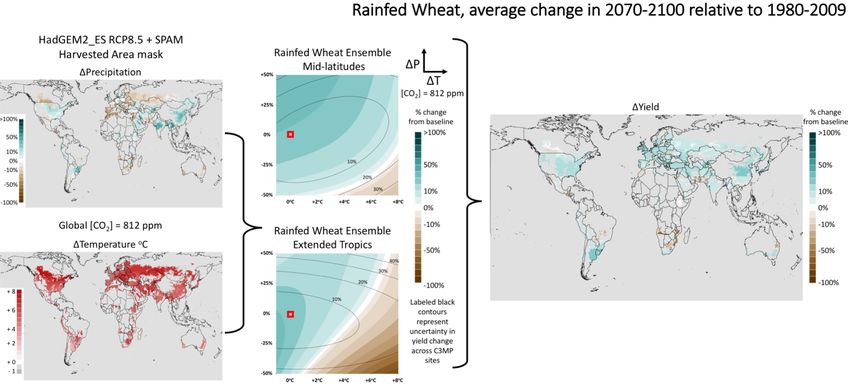
Motivation
• The integrated assessment models (IAMs) have made significant advancements in representing
  socioeconomic-energy-land-climate systems and evaluating climate mitigation strategies

• Increasingly, IAMs are expanded to incorporate impacts of climate change on energy, land and ecosystems,
  and evaluate the costs and benefits of response options

• Representation and analysis of adaptation responses using IAMs is still limited, giving the challenges with
  representing complex human-natural systems and processes and diverse adaptation response options,
  especially at finer scales

• Improving the modeling and analytical foundation of climate adaptation is important to:
     • estimate the costs, benefits and welfare impacts of adaptation responses
     • evaluate interactions and tradeoffs of mitigation and adaptation responses
     • understand the feedback of adaptation responses to socioeconomic, energy, land, and climate systems

• These require modeling approaches that both enhance IAMs and expand IAMs by coupling models, data…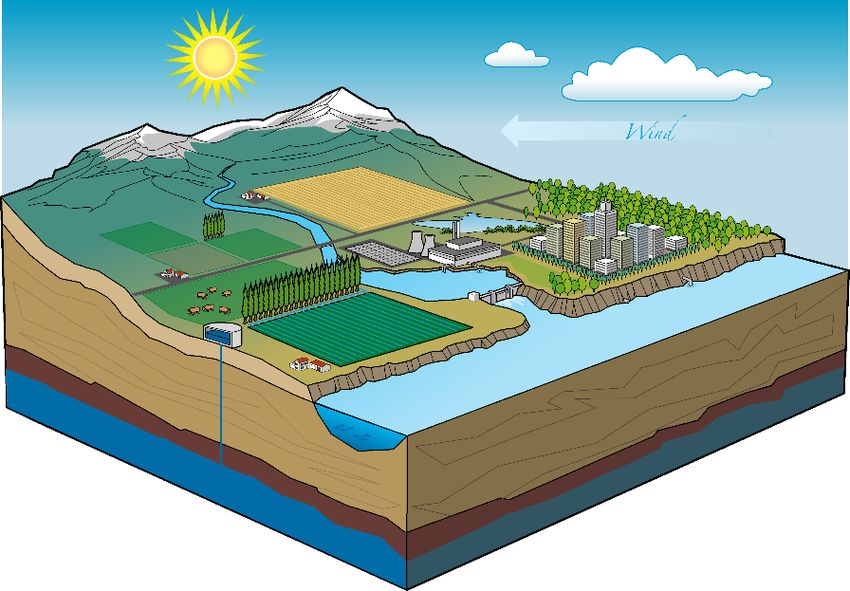
Analytical Framework
• Integrated, multi-scale modeling framework to evaluate climate impacts and
  adaptation responses
   • Connect broad socioeconomic drivers (e.g., population growth, technological changes, trade)
     with impacts and responses at regional and local levels
   • Use interdisciplinary approach that couples different models, data and methods

• Welfare analysis framework that centers around evaluating multiple
  dimensions of human welfare, including economic, social, and
  environmental outcomes
   • Understand interactions and tradeoffs

• Analysis design guided by decision-relevant questions
   • Selection of study region, impacts and adaptation responses, welfare metrics

                                                                                                   3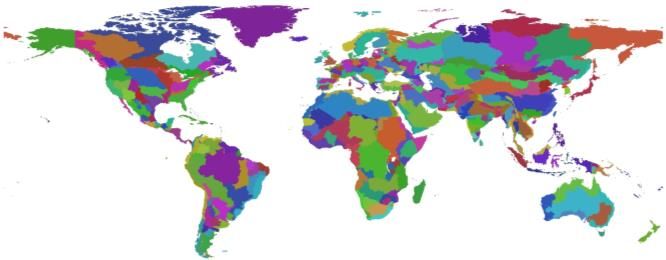
Study Design
• Model climate change impacts on U.S. agriculture, focusing on economic
  and regional environmental outcomes in the Upper Mississippi River Basin

• Multi-model, multi-scale modeling that couples an IAM (GCAM) with global
  crop yield emulator (Persephone) and biophysical watershed model (SWAT)
  to evaluate climate impacts and adaptation responses

                                                                             4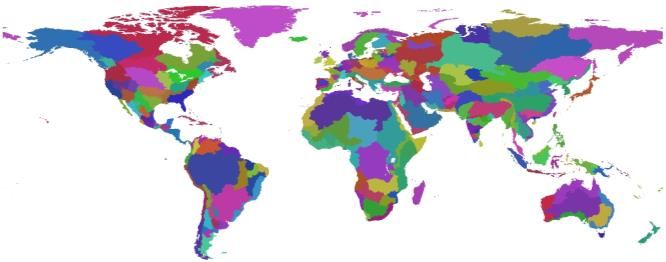
GCAM Overview                                                  GCAM: 32 geopolitical regions

                                                                    Flexible Scale
                    Global Coverage

    32 Energy &
    Economy
    Regions                                                GCAM-USA: 50 states + D.C. in the U.S.

             384 Land
             Regions

                    235
                    Water
                    Basins

                             Reduced-                    Market Equilibrium
                             Form ESM
                             (Hector)
                                                         Solution

Community Model                            Flexible Time Scale
http://jgcri.github.io/gcam-doc/toc.html   GCAM Core runs at 5 years; capability to run at one year;
                                           ancillary models run at finer scale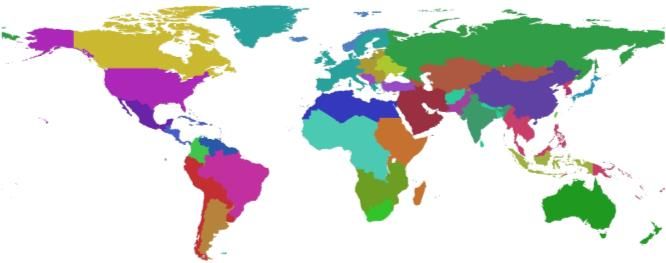
Persephone
• AgMIP Coordinated Climate Crop Modelling Project (C3MP) emulator (site-specific crop models)
• Rainfed and irrigated yield impacts
    • C3MP models show more negative response for irrigated corn in UMRB than for rainfed in HadGEM_ES RCP 8.5 (2050)

• Four crops
    •   Corn
    •   Rice
    •   Soybean
    •   Wheat

• Long-term trends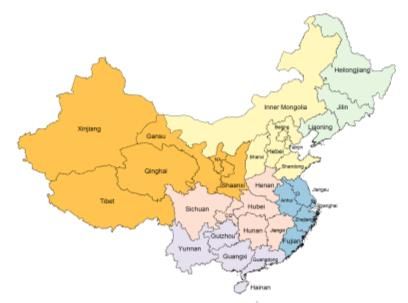
SWAT: coupled terrestrial-aquatic watershed model
•   A river basin-scale model
     • Cropland
     • Urban
     • Forest
     • River network
•   Processes
     • Hydrology
          • green water and blue water
     • Biophysical and biogeochemical
          • Crop growth, N, P, C cycling
          • Pathogen, pesticide, heavy metal
     • Human activities
          • Industry discharge, septic
          • Crop rotation, fertilizer, conservation       •   Application areas
             practices                                         • Climate Change
          • Deforestation, forestation                         • Best Management Practices
          • Rainfall harvest                                      (agriculture and urban)
•   Output                                                     • Biofuel
     • Quality and quantity of surface and ground water        • TMDL (Total Maximum Daily
     • Predict the environmental impact of land                   Load)
         management practices and land use patterns.           • Freshwater availability     7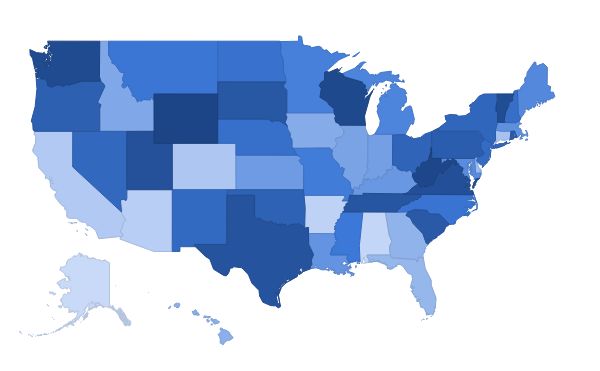
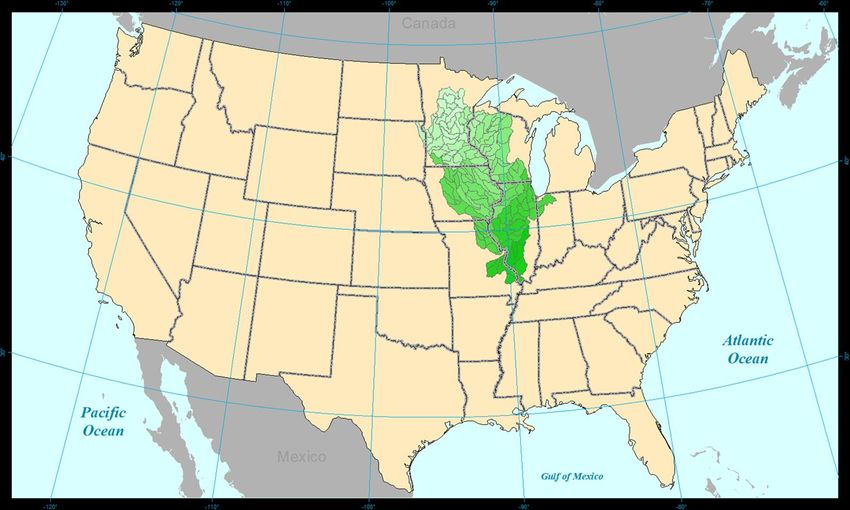
Upper Mississippi River Basin (UMRB)
• UMRB is critical to regional economy
  and ecosystems
    •   5 states, 60 counties
    •   Commercial navigation
    •   92% of all US agricultural exports
• Agriculture: a major economic sector
    •   60% of land use
    •   2.1 million farms, over 6 million
        people in farm households
• Agriculture also a major contributor
  to water pollution
    •   Runoffs and sedimentation
    •   Nitrogen discharge links to dead
        zone in Golf of Mexico

                                             8
Modeling Approach:
Climate Only (GCM to SWAT)
GCM
HadGEM2_ES
RCP 8.5 Results
SWAT
- Regional water
quality and quantity
Direct climate change impacts effects in UMRB
∆ temp (soil organic matter decomp)
∆ precip (heavy precip events → runoff)
9Modeling Approach:
Land Use Only (GCAM to SWAT)
GCAM
- Economic effects
of cc impacts
- U.S. adaptation
(e.g., irrig. tech)
SWAT
- Regional water
quality and quantity
effects in UMRB Demand-driven changes
∆ cropland use (area)
10Modeling Approach:
Climate + Land Use (GCM to GCAM to SWAT)
∆ temp Persephone GCAM
GCM ∆ crop yield
∆ precip - Emulator of C3MP - Economic effects
HadGEM2_ES - Global impacts on crop
yields (irrig. & rainfed)
of cc impacts
RCP 8.5 Results - corn, rice, soybean, - U.S. adaptation
wheat (e.g., irrig. tech)
SWAT
- Regional water
quality and quantity
effects in UMRB Demand-driven changes
∆ cropland use (area)
11Modeling Approach: Everything (Future)
∆ temp Persephone GCAM
GCM ∆ crop yield
∆ precip - Emulator of C3MP - Economic effects
HadGEM2_ES - Global impacts on crop
yields (irrig. & rainfed)
of cc impacts
RCP 8.5 Results - corn, rice, soybean, - U.S. adaptation
wheat (e.g., irrig. tech)
SWAT
- Regional water
quality and quantity
Direct climate change impacts effects in UMRB Demand-driven changes
∆ temp (soil organic matter decomp) ∆ cropland use (area)
∆ precip (heavy precip events → runoff)
12Climate Change Inputs in UMRB
Change in
temperature and
precipitation from
RCP8.5 GCM
projections.
Results from
HadGEM2 are
shown in orange.
13GCAM Results for the UMRB
• Cropland change in 2050 compared to
2010 driven primarily by increased
demand
• ↑5.0% for Reference, due to increase
population and income
• Little area for cropland extensification
• No “other arable” land in this basin
• Conversion primarily from forest and
pasture lands, both Reference and RCP
8.5
• Climate change has small effects on land
use change in UMRB
• Water stress in this region is low, even under
RCP 8.5
• Positive climate impacts on wheat yields
(strong CO2 fertilization effect)
• Negative climate impacts on corn yields result
in production losses, rather than
extensification
• ↑5.3% HadGEM 8.5, demand + climate
effects
• Forest and pasture losses ~4%-10% greater Climate + Land Use Land Use Only
under RCP 8.5 than Reference 14
(GCM to GCAM to SWAT) (GCAM to SWAT)SWAT Results: Water Quality under Climate
Change in UMRB
Climate Only
(GCM to SWAT)
Land Use Only
(GCAM to SWAT)
Climate + Land Use
(GCM to GCAM to SWAT)
15SWAT Results: Climate change
exacerbates Dead Zone in the Gulf of Mexico
Climate Only
(GCM to SWAT)
• Strong correlation between hypoxic zone area
and May Nitrate+Nitrite load (Turner and
Rabalais 2016).
• An empirical relationship derived by
Whittaker et al. (2014) is used to project
future trend of dead zone of gulf of Mexico.
16Key Insights
• GCAM shows small effects of climate change and adaptation response in
the U.S. agriculture sector, partially driven by the crop yields model
• SWAT analysis shows climate change has significant impacts on water
quality; land use change from future agricultural demand drives further
changes in water quality outcomes
• The analysis demonstrates the merits of a multi-scale, multi-model
framework that evaluates multi-dimensional welfare impacts of climate
change and adaptation responses beyond what an IAM-only approach can
accomplish
17Lessons learned and modeling challenges
• Coupling GCAM with SWAT expands the capability of an IAM to evaluate
ecosystem and environmental impacts of climate change at finer scale
• GCAM provides socioeconomic drivers (e.g., land use change) in SWAT to
evaluate environmental effects
• Coupling GCAM with SWAT poses challenges:
• these two types of models represent earth system with different scales (e.g. input
data resolution, operating at global vs regional scale)
• SWAT and GCAM represent land management with different details
• dynamic coupling of GCAM and SWAT would require substantial revision of codes of
both models
• Implementing adaptation measures in GCAM also requires substantial
model development
18Future Work
• Investigate crop yields effects
• Expand scenarios analysis:
• Combined effects of climate change and land use change on water quality
• Mitigation scenario (e.g., RCP 4.5)
• Additional adaptation responses
• GCAM-SWAT coupling:
• explore how environmental costs estimated by SWAT can be incorporated in
crop production function in GCAM
• reconcile GCAM and SWAT with respect to land management
• identify socio-economic-environmental interactions across different regions
• Carbon balance of different land uses from SWAT to GCAM
19Thank You
For any questions or follow up, please contact Jia Li (li.jia@epa.gov)
The views and opinions expressed in this presentation are those of the
authors alone and do not necessarily state or reflect those of the U.S.
Government or the Environmental Protection Agency, and no official
endorsement should be inferred.
20You can also read