Modelling the Environmental Effects of Corrosion in a Tungsten Inert Gas Weld Joints Using Response Surface Methodology
←
→
Page content transcription
If your browser does not render page correctly, please read the page content below
International Journal of Innovation Engineering and Science Research
 (ISSN: 2581-4591) www.ijiesr.com

Modelling the Environmental Effects of Corrosion
 in a Tungsten Inert Gas Weld Joints Using
 Response Surface Methodology

 Osarobo Osamede Ogbeide1 and Nosa Oriakhi2
 1,2
 Department of Production Engineering, University of Benin, Benin City, Nigeria

 ABSTRACT
Corrosion of metal is an ubiquitous phenomenon that occurs in various forms. Atmospheric or
uniform, galvanic, crevice, pitting, and microbial corrosion are most familiar forms of corrosion. The
service life of engineering structures is affected by the quality and strength of the welded joints. The
effects of corrosion affect the quality of the welded joints and the general structure. The offshore
structures are exposed to the various environments, and it is well known that the corrosion rate and
the corrosion mechanism under each environment affect the general structure. The aim of this study
is to model the environmental effects of corrosion on tungsten inert gas weld joints of a mild steel pipe
using response surface methodology.Mild steel pipe was cut into dimension 40mm in length, 12mm
diameter and 3mm thick with a power hacksaw, grinded and cleaned before the welding process. The
experimental matrix was made of twenty (20) runs, generated by the design expert 11.1.0.1 software
adopting the central composite design. The response was measured, which is the rate of corrosion
and then modelled using the response surface methodology.The result obtained in this study shows
that the current has a very strong influence on the rate of corrosion. The minimum value of the rate of
corrosion was observed to be 2.922mpy with a maximum value of 4.802mpy and standard deviation
of 0.141.Based on the findings, it is summarized that the corrosion rate is minimum when a welding
voltage of V = 18V, current = 120A and gas flow rate = 13lit/min.

Keywords: Mild steel pipe; Response Surface Methodology; Rate of corrosion; Contour plot; Surface
plot.

 I. INTRODUCTION
Carbon steel is the most widely used engineering material despite its relatively limited corrosion
resistance. It is used in large tonnages in marine applications, nuclear power and fossil fuel power
plants, transportation, chemical processing, petroleum production and refining, pipelines, mining,
construction and metal-processing equipment. Carbon steel has been the popular choice of structural
material as it is abundantly available, inexpensive and has adequate mechanical properties, but it has
a high general corrosion rate.
Several studies have been done to investigate the effect of welding parameters on the corrosion
behaviour of various metals. Rajakumaret al.[1] reported that all welding parameters have a
significant effect on the corrosion rate of AA6061-T6 aluminum alloy. He mentioned that the corrosion
rate was at its maximum when the tool rotational speed was at lower and higher levels, whereas the
corrosion rate was found to be the minimum when the welding speed was at 80 mm/min. Prachya and
Anucha[2] studied the effect of shielding gas parameter on mechanical properties and microstructures
of heat-affected zone and fusion zone on gas tungsten arc welding (GTAW) in aluminium alloy AA

 Volume 5 Issue 4 September-October 2021 1|P a g e
OsaroboOsamedeOgbeide. “International Journal of Innovation Engineering and Science Research”

5083. Factorial experiment was designed for this research. The result showed that types of shielding
gas and gas flow rate interaction hardness at heat affected zone and fusion zone with a P – value <
.05. The factor which was the most effective to the hardness at heat affected zone and fusion zone
was argon with a flow rate of 14 liters per minute at heat-affected zone with 74.27HV and fusion zone
with 68.97HV. Experimental results showed that the argon condition provided smaller grain size,
suitable size resulting in higher hardness both in weld metal and HAZ. They also indicated that the
grain size and precipitation Mg affect the hardness of sample.Ramchandran[3] studied the various
effect of the TIG welding on the Austenitic stainless steel 316L on micro structural changes through
destructive and nondestructive method and various parameters such as tensile strength, hardness on
varying the current, voltage and gas flow ratio respectively.Prawoto[4] evaluated the corrosion rates
and pitting morphology of the selected duplex stainless steel and found that decreasing pH increases
the corrosion rate. Similarly, increasing temperature increases corrosion rates this can be achieved
well using different solutions with different temperature and periods of immersion. Oliver [5]
investigated the relative exterior corrosion resistance of three alloys- two ferritic stainless steel (AISI
Types 409 and 441) and an aluminized mild steel; concluded that the De-icingsalts have a clearly
detrimental effect on corrosion resistance and stated that primary external corrosion mechanism
causing failure at the cold end of the exhaust system in the presence of de-icing salts is pitting. The
higher chromium type 441 alloy was far more resistant than type 409.
Corrosion is the deterioration of materials by chemical interaction with their environment. The term
corrosion is sometimes also applied to the degradation of plastics, concrete and wood, but generally
refers to metals. The most widely used metal is iron (usually as steel) and the following discussion is
mainly related to its corrosion. Corrosion is the destructive result of electrochemical reaction between
a metal or alloy and its surrounding environment. The metals are generally in high energy state
because some energy is added during their manufacturing process from the ores. Low energy-state
ores are more stable than the high energy-state metals. For this reason, the metals tend to release
the energy and go back to their original form. Hence, the metals revert to their parent state or ore
under a suitable corrosive environment. This conversion phenomenon is nothing but the corrosion.
The electrochemical process involved in corrosion is by nature opposite to the extractive metallurgy
involved in manufacturing of the metals. Therefore, corrosion is sometimes considered as the reverse
process of extractive metallurgy.Rajakumaret al. [1] reported that all welding parameters have a
significant effect on the corrosion rate of AA6061-T6 aluminium alloy. He mentioned that the corrosion
rate was at its maximum when the tool rotational speed was at lower and higher levels, whereas the
corrosion rate was found to be the minimum when the welding speed was at 80 mm/min.Sanga et al.
[6] investigated the effects of welding energy on the mechanical, thermal and microstructural
characteristics of the weld joint. The ultrasonic welding was performed on 0.36 mm thick phosphor
bronze (UNS C51100) sheets. It was observed that the values of peak interface temperature and
tensile-shear strength increase with the welding energy. The microstructural analysis carried out using
scanning electron microscope (SEM) revealed that the joining line appears almost straight at low
energy level but fades away at higher energy level. Other similar works includes that of [7-10].This
study is therefore aimed at modeling the environmental effects of corrosion in a tungsten inert gas
weld joints using Response Surface Methodology.
.
 II. MATERIALS AND METHOD
A. Materials
The material used in this study is mild steel pipe. Mild steel pipe was cut into dimension 40mm in
length, 12mm diameter and 3mm thick with a power hacksaw, grinded and cleaned before the
welding process. Two pieces of the mild steel pipes were welded together using the input process
parameters contained in Tungsten Inert Gas welding machine. The input process parameters are
current, voltage and gas flow rate.

B. Methods

 Volume 5 Issue 4 September-October 2021 2|P a g e
OsaroboOsamedeOgbeide. “International Journal of Innovation Engineering and Science Research” Twenty (20) experimental runs comprises of eight (8) factorial points, six (6) center points and six (6) axial (star) points were carried out to dig out minimum rate of corrosion on tungsten inert gas weld joints of a mild steel pipe . Each experimental run comprises of the welding input parameters which are the welding current, voltage and gas flow rate.The rate of corrosion is the speed at which any given metal deteriorates in a specific environment. The rate or speed is dependent upon environmental conditions as well as the type and condition of the metal.In order to calculate the rate of corrosion, the following information were collected: Weight loss (the decrease of metal weight during the reference time period). Density (the density of the metal). Area (total initial surface area of the metal piece). Time (the length of the reference time period). Converting corrosion rate 1mpy = 0.0254 mm/y = 25.4 microm/y o 1mpy – 1 mils per year Calculate the corrosion rate from metal loss: = 87.6 ( ) W = weight loss in milligrams D = metal density in g/cm3 A = area of sample in cm 2 T = time of exposure of the metal sample in hours. m/y = 0.0254mm/y 1) Experimental Design and Data Analysis A Three-factor layout of Central Composite Design (CCD) in surface response methodology (RSM) was employed with replicates at the Centre point and star points. Input parameters such as welding current, voltage and gas flow rate are the variables used in this study with each at low (-1) and high (+1) coded levels.Table 1 show the CCD experimental conditions for the process parameters. Table 1: The CCD Experimental Conditions for process parameters and their range Factor Units Low Level (-1) High Level (+1) A – Current Ampere 120 170 B – Voltage Voltage 18 24 Gas Flow Rate Lit/min 13 16 The above experimental analysis was carried out based on the response surface regression system to accommodate the second-order polynomial equation. The level of significance of the coefficients was less than 0.05. Statistical software package design-expert® (version 8.0.6; stat-ease, Inc., Minneapolis, USA) was used to determine the regression coefficient which help to predict the process response (rate of corrosion) as a function of the independent variables as well as their interaction that help the understanding of the system behavior. III.RESULTS AND DISCUSSION The rate of corrosion was determined and the results are presented in Table 2. The in-depth analysis involving the interaction of the process parameters (welding current, voltage and gas flow rate) was carried out. The Design-Expert (Stat-Ease, Inc., Minneapolis USA) software was employed for regression analysis and graphical analysis of the data obtained. The optimum values of the process parameters were gotten by solving the regression equation. This was also reached by analyzing the response surface and the contour plots. Table 2 show the design matrix for the real and the experimented values. Volume 5 Issue 4 September-October 2021 3|P a g e
OsaroboOsamedeOgbeide. “International Journal of Innovation Engineering and Science Research”

 Table 2:Design matrix for Actual values and Experimental responses for CCD experimental
 combination of welding current, voltage and gas flow rate

The model summary which shows the factors and their lowest and highest values including the
standard deviation is presented in Table 3:

Table 3: Model summary showing highest and lowest values of factors

Result of Table 3 revealed that the model is of the quadratic type which requires the polynomial
analysis order as depicted by a typical response surface design. The minimum value of the rate of
corrosion was observed to be 2.92224mpy with a maximum value of 4.80218mpy and standard
deviation of 0.141258. Table 4 depict the analysis of variance result table for the process parameters.

 Volume 5 Issue 4 September-October 2021 4|P a g e
OsaroboOsamedeOgbeide. “International Journal of Innovation Engineering and Science Research”

 Table 4: Analysis of Variance Result for the process parameters

The F-value of 37.29 obtained in Table 4 implies the model is significant which indicate that there is
only a 0.01% chance that an F-value this large could occur due to noise. The P-values that is less
than 0.0500 indicate model terms are significant. In this case A, B, AB, AC, BC, B², C² are significant
model terms. Values greater than 0.1000 indicate the model terms are not significant. If there are
many insignificant model terms (not counting those required to support hierarchy), model reduction
may improve the model. The Lack of Fit F-value of 79733.41 suggests the Lack of Fit is significant.
There is only a 0.01% chance that a Lack of Fit F-value this large could occur due to noise. Table 5
depict Fit statistics for the process
 Table 5: Fit statistics

The Predicted R² of 0.7686 is in reasonable agreement with the Adjusted R² of 0.9450; i.e. the
difference is less than 0.2. Adeq Precision measures the signal to noise ratio. A ratio greater than 4 is
desirable. The ratio of 19.083 indicates an adequate signal. This model can be used to navigate the
design space.The coefficient of determination R2 for the tungsten inert gas weld joints was obtained to
be 0.9711. The result point to the model been effective in describing 97. 11% of variation in the
original data. The value of 0.9450 was obtained for the respective adjusted R2. The R2pre value gotten
through cross-validation advocated that the model is capable of explaining about 77% variation in
predicting novel observations. Fig. 1 (a-c) shows residuals based on the empirical model developed
for the input variables (current, voltage and gas flow rate). To fully understand the relationship
between the variables studied, the response surface curves was plotted as it also helped us to
evaluate the optimum level of the input variables for maximum response.

 Volume 5 Issue 4 September-October 2021 5|P a g e
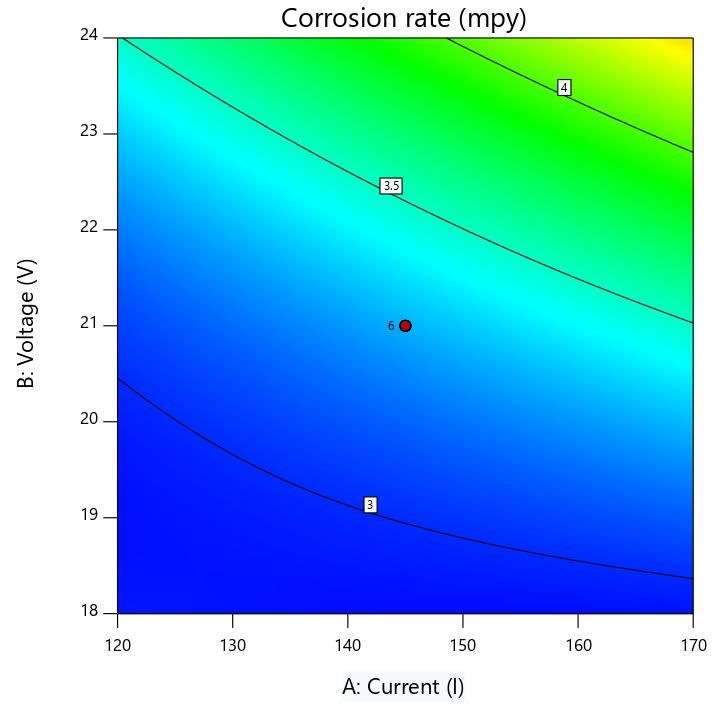
OsaroboOsamedeOgbeide. “International Journal of Innovation Engineering and Science Research”

 Fig. 1(a-c): ResidualPlots

Fig. 2 is a two-dimensional (2D) representation of the response plotted against combinations of
numeric factors and/or mixture components. It shows the relationship between the responses, mixture
components and/or numeric factors. In this case you see a plot of corrosion rate as a function of
current and voltage at a mid-level slice of gas flow rate. This slice includes six center points as
indicated by the dot at the middle of the contour plot. By replicating center points, you get a very good
power of prediction at the middle of your experimental region.

 Volume 5 Issue 4 September-October 2021 6|P a g e
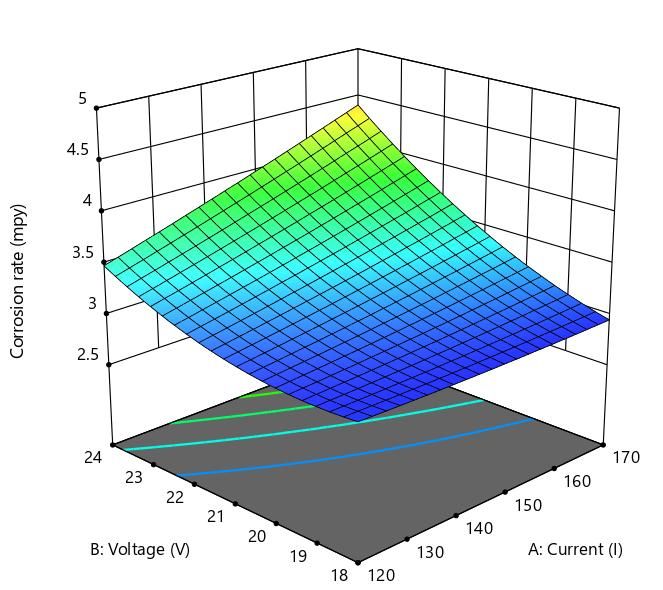
OsaroboOsamedeOgbeide. “International Journal of Innovation Engineering and Science Research”

 Fig. 2: Contour Plot

 Fig. 3: Response Surface Plot

The response surface plot shown in Fig.3 is a 3D surface plot. It shows the relationship between the
input variables (current, voltage and gas flow rate) and the response variables (rate of corrosion). It is
a 3-dimensional surface plot which was employed to give a clearer concept of the response surface.
Although not as useful as the contour plot for establishing responses values and coordinates, this
view may provide a clearer view of the surface. The presence of a coloured hole at the middle of the
upper surface gave a clue that more points lightly shaded for easier identification fell below the
surface.

 Volume 5 Issue 4 September-October 2021 7|P a g e
OsaroboOsamedeOgbeide. “International Journal of Innovation Engineering and Science Research” Fig. 4: Overlay Plot Fig.4 shows an overlay plot generated from the model. The coloured area represents the region of rate of corrosion above 3.5mpy. Hence, the optimal rate of corrosion falls within the unshaded region. IV. CONCLUSION This study has been able to determine the effects of combined welding input parameters such as gas flow rate, voltage and current using response surface methodology. In this study, the application of response surface methodology to optimize and predict the rate of corrosion of a mild steel pipe welded joint has been successfully established. The reliability of central composite design in response surface methodology was also established in determining the process parameters such as gas flow rate, voltage and current leading to optimum rate of corrosion mild steel pipe welded joint. The butt joint specimens were performed varying the welding input parameters. The result obtained shows that current has a very strong influence on the rate of corrosion. Based on the findings, it is summarized that the corrosion rate is minimum when a welding voltage V 18V , Current = 120A and gas flow rate =13lit/m. REFERENCES [1] Rajakumar, S., Muralidhara, C., Balasubramanian, V.Predicting tensile strenght, hardness and corrosion rate friction stir welded AA6061-T6 aluminium alloy Joints. Materials and Design.2011,No.32, Vol.28, pp78-90. [2] Prachya, P., Anucha, W., Influence of Shielding Gas on Aluminium Alloy 5083 in Gas Tungsten Arc Welding”, 2012 International Workshop on Information and Electronics Engineering (IWIEE), Procedia Engineering, 2012, Vol. 29, PP.2465-2469. [3] Ramachandran, R. Analysis And Experimental Investigations of Weld Characteristics For A TIG Welding With SS316L. International Journal of Advances in Engineering Research (IJAER),2015, VOL.NO.10,Issue no.II,e-ISSN: 2231-5152/PP.2454-1796. [4] Prawoto, Y., Ibrahim, K. Effect of ph and chloride concentration on the corrosion of duplex stainless steel, The Arabian Journal for Science and Engineering, 2009, Volume 34. pp.115-127. Volume 5 Issue 4 September-October 2021 8|P a g e
OsaroboOsamedeOgbeide. “International Journal of Innovation Engineering and Science Research”

 [5] Oliver, D.C., Stephan, M. External corrosion resistance of steel and FSS exhausts systems.The
 Journal of South African Institute of Mining and Metallurgy,2003, pp.93-100

 [6] Sanga, B. Wattal, R and Nagesh, D.S. Weld joint characterization in ultrasonic welding of phosphor
 bronze sheets, Engineering Science and Technology, an International Journal,
 https://doi.org/10.1016/j.jestch.2021.07.003. In press

 [7] Shin, H.S.,De Leon,M. Parametric study in similar ultrasonic spot welding of A5052–H32 alloy sheets,
 J. Mater. Process. Technol. 224 (2015) 222–232, https://doi.org/10.1016/j.jmatprotec.2015.05.013.

 [8] Shakil, M., Tariq,N.H., Ahmad, M., Choudhary, M.A.,Akhter, J.I.,Babu, S.S. Effect ofultrasonic welding
 parameters on microstructure and mechanical properties of dissimilar joints, Mater. Des. 55 (2014)
 263–273, https://doi.org/10.1016/j.matdes.2013.09.074.

 [9] Annoni, M.,Carboni,M. Ultrasonic metal welding of AA 6022–T4 lap joints: Part I - Technological
 characterisation and static mechanical behaviour, Sci.Technol. Weld. Join. 16 (2) (2011) 107–115,
 https://doi.org/10.1179/1362171810Y.0000000014.

 [10] Bakavos, D., Prangnell,P.B. Mechanisms of joint and microstructure formation in high power ultrasonic
 spot welding 6111 aluminium automotive sheet, Mater. Sci. Eng., A 527 (23) (2010) 6320–6334,
 https://doi.org/10.1016/j.msea.2010.06.038.

 Volume 5 Issue 4 September-October 2021 9|P a g e
You can also read