Monro, Inc. Investor Presentation - EARNINGS CALL MAY 20, 2021
←
→
Page content transcription
If your browser does not render page correctly, please read the page content below
Monro, Inc.
FOURTH  QUARTER
            InvestorFISCAL
                      Presentation
                           2021
EARNINGS
June 2021 CALL MAY 20, 2021
Safe Harbor Statement and Non-GAAP Measures

  Certain statements in this presentation, other than statements of historical fact, including estimates, projections, statements
  related to our business plans and operating results are forward-looking statements within the meaning of the Private
  Securities Litigation Reform Act of 1995. Monro has identified some of these forward-looking statements with words such
  as “anticipates,” “believes,” “expects,” “estimates,” “is likely,” “predicts,” “projects,” “forecasts,” “may,” “will,” “should,” and
  “intends” and the negative of these words or other comparable terminology. These forward-looking statements are based
  on Monro’s current expectations, estimates, projections and assumptions as of the date such statements are made, and are
  subject to risks and uncertainties that may cause results to differ materially from those expressed or implied in the forward-
  looking statements, to include the significant uncertainty relating to the duration and scope of the COVID-19 pandemic and
  its impact on our customers, executive officers and employees. Additional information regarding these risks and
  uncertainties are described in the Company’s filings with the Securities and Exchange Commission, including in the “Risk
  Factors” and “Management’s Discussion and Analysis of Financial Condition and Results of Operations” sections of our
  most recently filed periodic reports on Forms 10-K and Form 10-Q, which are available on Monro’s website at
  https://corporate.monro.com/investors/financial-information/. Monro assumes no obligation to update or revise these
  forward-looking statements for any reason, even if new information becomes available in the future.

  In addition to including references to diluted earnings per share (“EPS”), which is a generally accepted accounting
  principles (“GAAP”) measure, this presentation includes references to adjusted diluted earnings per share, which is a non-
  GAAP financial measure. Monro has included a reconciliation from adjusted diluted EPS to its most directly comparable
  GAAP measure, diluted EPS in Slide 9. Management views this non-GAAP financial measure as a way to better assess
  comparability between periods because management believes the non-GAAP financial measure shows the Company’s
  core business operations while excluding certain non-recurring items and items related to our Monro.Forward or acquisition
  initiatives.

  This non-GAAP financial measure is not intended to represent, and should not be considered more meaningful than, or as
  an alternative to, its most directly comparable GAAP measure. This non-GAAP financial measure may be different from
  similarly titled non-GAAP financial measures used by other companies.

                                                                                                                                         2
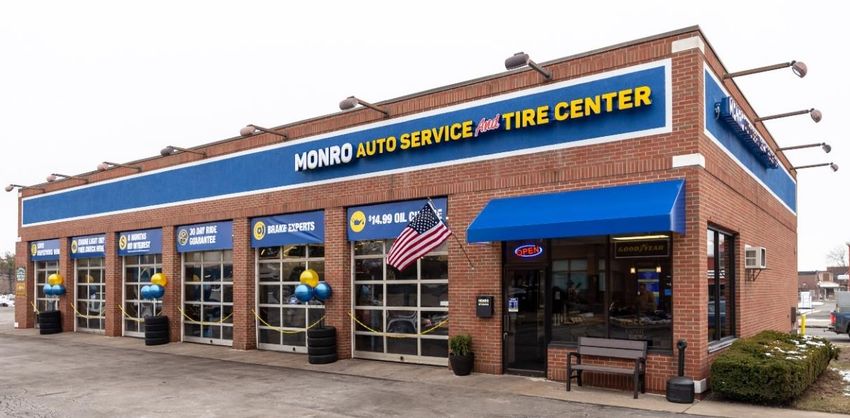
Company Overview
                      A Leading Chain of Independently Owned and Operated Tire and Auto Service Locations

▪   Dominant in the Northeastern U.S. and expanding in Southern and
    Western markets

▪   Fiscal 2021 sales of $1,125.7 million

▪   1,292 company operated stores in 32 states and 91 franchised
    locations as of June 4, 2021

▪   40 acquisitions in the past 9 fiscal years, adding 535 locations,
    $730 million in revenue and entry into 13 new states

▪   Operating two store formats in key markets
       −Service brand stores – 431 stores
                                                                                                            Store locations as of 5/11/21

         •   75% maintenance service, 25% tires
         •   $675,000 a year in sales per store
       −Tire brand stores – 861 stores (excluding wholesale)
         •   55% tires, 45% maintenance service
         •   $1.0 million a year in sales per store

▪   7 wholesale locations and 3 retread facilities
                                                                                                                                        3
A Unique Operating Model
  Monro Has a Diversified Supply Chain, Sourcing High Quality, Low-Cost Parts Direct and a Strong Portfolio of Tire Brands

                                                            PARTS
                                                            Monro sources these parts from leading   Secondary parts distribution:
                                                            aftermarket parts suppliers:
                                                            ▪   Brake Rotors and Pads
                                                            ▪   Filters
                                                            ▪   Steering and Suspension
                                                            ▪   Wipers
                                                            ▪   Belts

                                                            TIRES

Store locations as of 5/11/21                                                                                                        4
A Favorable Industry Backdrop
                                             Favorable Industry Backdrop for Automotive Services
                              Despite a Decrease in Miles Traveled in 2020 Resulting from the COVID-19 Pandemic
                      U.S. Annual Light Vehicle Sales                                                                               U.S. Light Vehicles in Operation (VIO)
   20                                                                                                               290,000
   18
                                                                                                                    280,000
   16
   14                                                                                                               270,000
   12                                                                                                               260,000
   10
    8                                                                                                               250,000

    6                                                                                                               240,000
    4
                                                                                                                    230,000
    2
    0                                                                                                               220,000
          05     06     07    08    09     10    11     12    13     14     15        16    17    18   19      20             2011     2012      2013     2014    2015   2016   2017   2018   2019   2020   2021
        Source: FRED Economic Data, Light weight Vehicle Sales: Autos and Light Trucks (annual average data)             Source: Auto Care Association Factbook

                             Total Miles Traveled in U.S.                                                                                               Key Highlights
   3,300,000

   3,225,000
                                                                                                                    ▪   Although a slight decrease in 2021, an overall growing
                                                                                                                        trend in total vehicle population related to consumers
   3,150,000
                                                                                                                        owning vehicles longer
   3,075,000
                                                                                                                    ▪   270+ million vehicles on the road
   3,000,000
                                                                                                                    ▪   Increasing age of vehicles (average of ~12 years)
   2,925,000
                                                                                                                    ▪   Increasing complexity of vehicles
   2,850,000
                                                                                                                    ▪   Since March 2020, vehicle miles traveled has been
   2,775,000                                                                                                            negatively impacted due to the COVID-19 pandemic
                   05    06    07    08    09    10    11    12    13     14     15    16    17   18   19      20
        Source: FRED Economic Data, Moving 12-Month Total Vehicle Miles Traveled (annual average data)                                                                                                             5
A Favorable Industry Backdrop
                                                           Monro is Well-Positioned to Capitalize on Positive Industry Trends,
                                                     with Our Sweet Spot Experiencing the Fastest Growth in Vehicles in Operation
                                Vehicles in Operation – 0 to 5 Years                                                      Vehicles in Operation – 6 to 12 Years
               120                                                                                           120

               110                     +6.56% CAGR                               -.03% CAGR                  110            -3.97% CAGR                               +3.90% CAGR
               100                                                                                           100

                 90                                                                                           90

                 80                                                                                           80

                 70                                                                                           70

                 60                                                                                           60

                 50                                                                                           50
                         2012      2013       2014   2015   2016   2017   2018   2019   2020   2021   2022         2012    2013   2014   2015   2016   2017   2018   2019   2020   2021   2022

                                   Vehicles in Operation – 13+ Years                                                                        Key Highlights
               120                   +4.27% CAGR                                  +1.47% CAGR                  ▪   Strong growth in new vehicles (0-5 years) between 2012
               110                                                                                                 and 2017 is creating a significant tailwind for the 6-12
               100                                                                                                 year old vehicle cohort for the next couple of years
                 90                                                                                            ▪   6-12 year cohort expected to grow the fastest at +3.9%
                 80                                                                                                CAGR for the period 2017-2022
                 70                                                                                            ▪   Monro’s targeted market segment is the 6-12 year
                 60                                                                                                cohort
                 50
                         2012      2013       2014   2015   2016   2017   2018   2019   2020   2021   2022
Source for all data: Lang, IHS Markit, 2018                                                                                                                                                      6
A Favorable Industry Backdrop
               Monro Operates in the $252 Billion Do-It-For-Me* Segment of $325 Billion U.S. Automotive Aftermarket Industry

                           Automotive Aftermarket DIFM vs. DIY Sales                                                                                                                  %                     %
                                                                                                                                                                         2010                   2020                 CAGR
                                                                                                                                                                                   (outlets)             (outlets)
             350,000
                                                                                                                                       Dealers                         18,460       14.3%      16,623     12.5%      (1.0%)
             300,000
                                                                                                                                       General Repair
             250,000                                                                                                                                                   76,108       58.8%      82,454     62.1%      0.8%
                                                                                                                                       Garages
             200,000                                                                                                                   Tire Dealers                    18,675       14.4%      20,327     15.3%      0.9%
             150,000
                                                                                                                                       Specialty Repair                 8,663       6.7%        6,137     4.6%       (3.4%)
             100,000
               50,000
                                                                                                                                       Oil Change/Lube                  7,518       5.8%        7,305     5.5%       (0.3%)
                      0
                             2012      2013       2014      2015    2016     2017       2018       2019      2020       2021           Total                           129,424     100.0%      132,846   100.0%
                                                                   DIFM    DIY
                          Source: Auto Care Association Factbook      Census data for 2012; estimates for 2013-2020; 2021 forecast   Source: Auto Care Association Factbook

                                                DIFM vs. DIY Trends                                                                                                              Key Highlights
               ▪      DIFM continues to account for a significant percentage                                                               ▪      Industry still highly fragmented, with significant
                      of the automotive aftermarket                                                                                               opportunities for further consolidation
               ▪      Vehicle complexity continues to drive shift to DIFM from
                      DIY
               ▪      Future technology advances expected to accelerate
                      shift to DIFM

* Includes Replacement Tire Segment                                                                                                                                                                                           7
Fourth Quarter Fiscal 2021 Sales Highlights
                                                               Well Positioned to Drive Higher Sales and Generate Strong Cash Flow

                                            Quarterly Comps Trends                                                   Monthly Comparable Store Sales
                    10%
                                                                                                       100%
                     5%                                                                                    80%
                     0%                                                                                    60%
                                Q4FY20             Q1FY21         Q2FY21   Q3FY21   Q4FY21
                    -5%                                                                                    40%
                   -10%                                                                                    20%
                   -15%                                                                                    0%

                   -20%                                                                                -20%
                                                                                                       -40%
                   -25%
                                                                                                       -60%          January   February   March          April   May MTD1
                   -30%
                                                                                                                                          CY20    CY21

                                                        Q4FY21                                                                        Q4FY21
                                                     Key Highlights                                                                Key Highlights
               ▪     Comparable store sales of 9.4% driven by strong                                   ▪     Sequential comp improvement in all product and service
                     demand recovery                                                                         categories, with tires outperforming all other categories
               ▪     Sales from new stores added $5.1M, including sales                                          ▪    Tires: 17%
                     from recent acquisitions of $4.6M
                                                                                                                 ▪    Alignments: 15%
               ▪     Generated record operating cash flow of ~$185M in
                     fiscal 2021 driven by profitability and strong working                                      ▪    Front End/Shocks: 1%
                     capital management                                                                          ▪    Maintenance: 0%
                                                                                                                 ▪    Brakes: -1%
1Preliminary   results through May 15, 2021 and May 16, 2020                                                                                                                8
Fourth Quarter Fiscal 2021 Results
Solid Results Reflect Strong Momentum Exiting Fiscal 2021
Q4FY21 Q4FY20 Δ FY21 FY20 Δ
Sales (millions) $305.5 $286.1 6.8% $1,125.7 $1,256.5 (10.4%)
Same Store Sales 9.4% -9.5% 1,890 bps -11.1% -2.3% (880 bps)
Gross Margin 35.1% 35.7% (60 bps) 35.1% 37.9% (280 bps)
Operating Margin 6.8% 0.1% 670 bps 6.4% 8.1% (170 bps)
Diluted EPS $.35 ($.12) NM $1.01 $1.71 (40.9%)
Excluded Costs1 $.03 $.20 $.12 $.29
Adjusted Diluted EPS2 $.38 $.08 375.0% $1.14 $2.00 (43.0%)
1Excluded costs in Q4FY21 include $.02 per share in Monro.Forward initiatives and $.01 per share related to management transition costs and a distribution center closure. Excluded costs in Q4FY20 include $.15 per share of store impairment costs, $.03 per share in Monro.Forward initiatives, $.01
per share of one-time costs related to the Company’s headquarters expansion and $.01 per share of costs related to litigation reserve. Excluded costs in FY21 include $.06 per share related to store closing costs, $.05 per share in Monro.Forward initiatives, $.01 per share of costs related to
acquisition due diligence, $.01 per share of costs related to management transition and a distribution center closure, and $.01 per share of benefit related to a reserve for litigation that was no longer necessary. Excluded costs in FY20 include $.15 per share of store impairment costs, $.09 per share
in Monro.Forward initiatives, $.03 per share of costs related to acquisition due diligence and integration, and $.02 per share of costs related to headquarters expansion costs and litigation reserve.
2Adjusted EPS is a non-GAAP measure that excludes certain non-recurring items and items related to our Monro.Forward or acquisition initiatives. A reconciliation of net income to adjusted net income and diluted EPS to adjusted diluted EPS is included in our earnings release dated May 20, 2021.
Note: The table may not add down +/- due to rounding 9Solid Financial Position
Ample Financial Flexibility to Support Growth Strategy and Business Operations
Disciplined Capital Allocation Strong Balance Sheet and Liquidity
Fiscal 2021
▪ Reduced bank debt, net of cash by ~$61M ▪ Generated record ~$185M of operating cash flow
during FY21
▪ Capex of ~$52M
▪ Net bank debt of $160M as of March 2021
▪ Spent ~$17M on acquisitions
▪ Net bank debt-to-EBITDA ratio as of March 2021 of
▪ Paid ~$30M in dividends 1.1x
▪ Strategically reduced cost structure ▪ Liquidity position of ~$380M as of May 15, 2021
10Go-Forward Priorities
A Renewed Focus on Operational Execution To Realize the Full Potential of Our Business
Enhance the customer experience and improve in-store execution to drive long-term organic growth
Capitalize on strategic acquisition opportunities in our highly fragmented industry
Generate strong cash flow through operational improvements and working capital optimization
11Driving Long-Term Sustainable Growth
Improve Customer Experience Optimize Product &
• Online reputation management Service Offering
• Consistent in-store experience • Redefined selling approach
• Consistent store appearance • Optimized tire assortment
Scalable Platform to
Enhance Customer-Centric Drive Sustainable Accelerate Productivity
Growth & Team Engagement
Engagement
• Customer retention • Optimized store staffing model
• Customer acquisition • Clearly defined career path and
• Omnichannel enhanced training program
• Aligned compensation
Investments in Technology and Data-Driven Analytics to Support Strategic Initiatives
12Monro.Forward Progress Update
Focused on Aspects of Business Within Our Control to Drive Profitable Growth and Operational Excellence
▪ Substantially completed the rebrand and reimage of ~360 stores in key markets
Improve Customer
Experience ▪ Migrated ~115 stores from service branded stores to a tire-oriented brand
▪ Outperformance of rebranded and reimaged stores reinforces strength of strategy
▪ Optimized marketing spend towards higher ROI channels to drive improved SEO
Enhance Customer- performance in tires and key service categories
Centric Engagement ▪ Leveraging modernized store infrastructure and phone system to improve customer
execution
▪ Completed rollout of tire category management and pricing tool
Optimize Product &
Service Offering ▪ Dynamically tracking demand trends to drive tire volume and margin expansion
▪ Focused on category management to capitalize on service attachment opportunities
▪ Completed rollout of cloud-based store staffing and scheduling software
Accelerate Productivity ▪ Well-positioned to drive labor efficiency
& Team Engagement ▪ Focused on leveraging Monro University and in-store training to drive operational excellence
and improved in-store execution
13Omnichannel: Amazon.com Collaboration
Collaboration With Amazon.com Supports Monro’s Online Tire Retailers Installation Strategy
Amazon.com Collaboration
▪ Monro’s tire installation services available to customers who purchase
tires online from Amazon.com and select the Ship-to-Store option
▪ Amazon tire installation services are now offered at all of Monro’s more
than 1,200 locations in 32 states
▪ Enhances customer-centric engagement efforts and omni-channel
service offerings, delivering a best-in-class customer experience and
building a scalable platform for sustainable growth
14A Proven Acquisition Strategy
Monro’s Acquisition Strategy Has Delivered Significant Growth Over the Years
A Proven Track Record
▪ 40 acquisitions in the past 9 fiscal years, adding 535 locations and $730M in revenue
▪ Entered 13 new states, expanding our presence in the Southern and Western markets
▪ Average acquisition size:
▪ 13 stores
▪ ~$20M in annualized sales growth
Recently Completed Acquisitions
▪ Completed acquisition of 30 Mountain View Tire & Service stores in the Los Angeles area
▪ Further expands the Company’s geographic footprint in the Western United States
▪ Represents $45M in annualized sales
▪ Sales mix of 70% service and 30% tires
Fiscal 2022 Acquisition Outlook
▪ Strategically located acquisitions with attractive valuations remain a pillar of our growth and we are committed
to executing on attractive opportunities in our highly fragmented industry
▪ Actively evaluating acquisition targets and capitalizing on robust pipeline
15Investment Highlights
▪ Leading chain of Company-operated undercar care facilities in the U.S. with a wide breadth of
product and service offerings
▪ Strong position in Northeast, Great Lakes and Mid-Atlantic and expanding into Southern and Western
markets with a presence in 32 states
▪ Low-cost operator with solid operating margins
▪ Well-positioned to capitalize on a favorable industry backdrop
▪ Monro.Forward strategy creating a scalable platform to drive sustainable growth, with a focus on
operational excellence to increase overall customer lifetime value
▪ Significant growth opportunity to execute disciplined acquisition strategy in a highly fragmented
industry
▪ Strong balance sheet and cash flow
▪ Delivering consistent shareholder returns through dividend program
16Appendix
17Fiscal 2022 Outlook – Financial Assumptions
Financial Assumptions as of May 20, 2021 Q1 Outlook Considerations as of May 20, 2021
Tire and Oil Costs Increase y/y
▪ Expect double digit comparable store sales
growth
Interest Expense ~$25M to ~$28M
– Fiscal first quarter-to-date comps of
Depreciation and Amortization ~$82M to ~$88M ~53% as of May 15, 2021
Tax Rate ~25% – Comps expected to moderate in June
due to less favorable y/y comparison
Capital Expenditures ~$40M to ~$55M
▪ Expect gross margin to reflect the negative
Weighted Average Number of Diluted impact of a higher sales mix of tires
~34M compared to Q1 Fiscal 2020
Shares Outstanding
Store Closure Operating Income Benefit ~$5M vs. Fiscal 2020
~$15M to $20M vs. Fiscal
Structural Cost savings
2020
18You can also read