National Policy Statement on Urban Development Capacity: Assessment for Tasman - November 2018
←
→
Page content transcription
If your browser does not render page correctly, please read the page content below
National Policy Statement on
Urban Development Capacity:
       Assessment for Tasman
                November 2018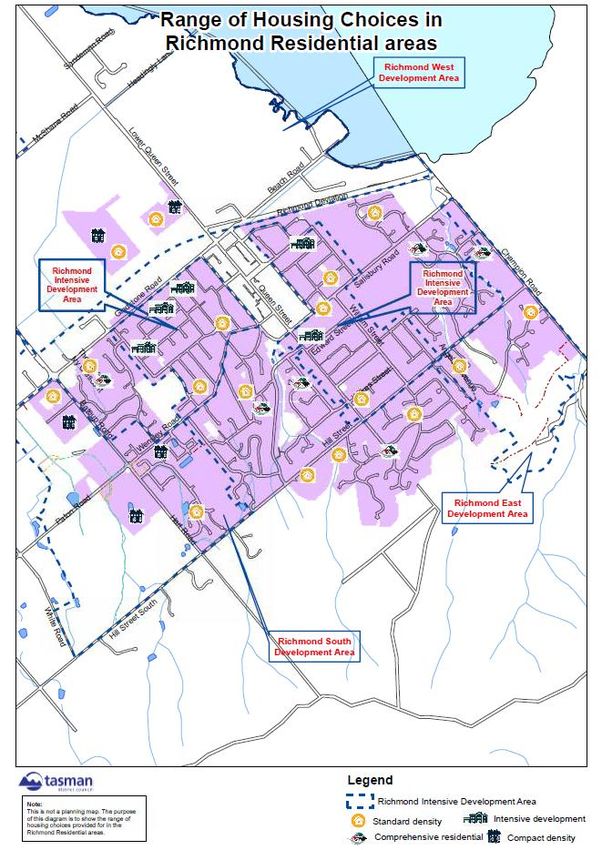
Contents
1      Executive Summary............................................................................................................. 1
       1.1      Key Trends and Issues in the Housing and Business Capacity Assessment ................................................... 1
       1.2      Summary of Rollout for Housing and Business ........................................................................................... 3
       1.3      The Future.................................................................................................................................................. 4

2      Introduction ....................................................................................................................... 5
       2.1      Purpose ...................................................................................................................................................... 5

3      Tasman’s Capacity Planning Process – the Growth Demand and Supply Model ..................... 7
       3.1      Process....................................................................................................................................................... 7

4      Assessment of Demand for Housing .................................................................................. 10
       4.1      Current Consumption Patterns of Population ........................................................................................... 10
       4.2      Future Broad Demand Patterns ................................................................................................................ 10
       4.3      Unmet Demand ........................................................................................................................................ 13

5      Housing Capacity and Feasibility................................................ Error! Bookmark not defined.
       5.1      Cumulative Effect of all Zoning, Objectives, Policies, Rules Overlays and Designations in Tasman Resource
                Management Plan .................................................................................................................................... 15
       5.2      Customer Satisfaction .............................................................................................................................. 15
       5.2      Capacity Supported by Development Infrastructure ................................................................................. 20
       5.3      Commercial Feasibility of Development Capacity ..................................................................................... 22

6      Business Demand.............................................................................................................. 26
       6.1      The Local Economy ................................................................................................................................... 26
       6.2      Assessing Demand ................................................................................................................................... 27
       6.3      Existing Zoned Supply .............................................................................................................................. 28

7      Business Capacity, Feasibility and Sufficiency..................................................................... 31
       7.1      Capacity, Feasibility and Sufficiency ......................................................................................................... 31
       7.2      Capacity supported by infrastructure ....................................................................................................... 31

8      Housing and Business Interactions .................................................................................... 32

9      Overall Conclusions........................................................................................................... 33
       9.1      General Conclusions on the Capacity Assessment..................................................................................... 33

10     Future .............................................................................................................................. 35

National Policy Statement on Urban Development Capacity: Assessment for Tasman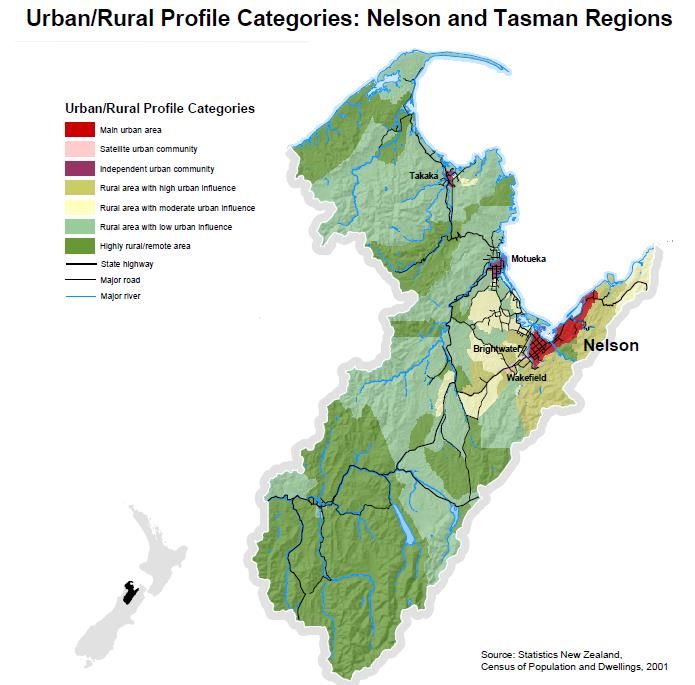
1        Executive Summary
This report is one of three that together comprise the Nelson Main Urban Area Housing and Business Capacity
Assessments. This report covers Richmond, within Tasman District Council. Nelson City Council (NCC) has
produced its own capacity assessment for the remainder of the Nelson Main Urban Area and there is a third
bridging report prepared by both Councils, called “National Policy Statement on Urban Development Capacity
Assessment – Nelson-Tasman Overview”. The overview report summarises the capacity assessment for the
whole Nelson Main Urban Area within both Councils.

1.1      Key Trends and Issues in the Housing and Business Capacity Assessment
1.1.1 Population Growth
Richmond’s population is growing and household size is decreasing
Over the next 10 years, we expect an increase of 1,050 residents in Richmond. In order to accommodate this
population growth and trend of smaller households, we anticipate a further 1,100 new dwellings will be
needed and 150 new business lots created by 2028. It is not just the new residents who will need new
dwellings, but also the existing population’s smaller households adding to demand. This capacity assessment
incorporates the extra margin of development capacity required by the National Policy Statement on Urban
Development Capacity (NPS-UDC). Additional capacity for residential lots is also being provided because of the
Special Housing Areas that were gazetted in Richmond in 2017. Business land is also being provided and a
decision was made to provide for the extra margin of business land capacity, required under the NPS-UDC for
the next 30 years, to all be provided in years 1-10.

Between 2028 and 2048, we predict a further 950 dwellings and 125 new business lots will be needed. There
will be ongoing population growth over the next 20 years with the rate of growth slowing over time until it
plateaus in years 2038-48 according to latest projections. In Richmond, a high population growth scenario is
used to forecast residential demand for the next 10 years (2018-2028), and a medium population growth
scenario is used to estimate demand beyond 2028. For business land demand, medium growth population
projections were assumed for the entire period.

1.1.2 Where to Grow?
In Richmond, there is a plentiful supply of land for housing and business development in the short term and
potential supply in the longer term
Supply of land in Richmond is not the problem. It is the provision of serviced land with infrastructure that is the
financial challenge for a district with relatively small population and medium growth rates. Choices will need to
be made in the longer term about whether continued development of high quality productive land for housing
and business is appropriate or whether growth should be directed to other areas. The forthcoming Nelson
Tasman Future Development Strategy will help guide such decisions.

1.1.3 Demographic Changes
Demographic Changes
Population increases for residents aged 65 years and over are forecast. The proportion of residents aged 65
years and over is projected to increase from 22% in 2018, to 37% by 2043, with a corresponding decrease in
average household size. This is expected to increase demand for small dwellings. When the results of our 2018
Communitrak survey of residents were combined with household growth projections, it revealed that 30% of
the future demand for housing in Richmond will be for units, townhouses, or units in retirement villages, and
40% will be for small houses1. With an ageing population and affordability issues, there is a risk of older people
living in housing-related poverty.

1 Tasman District Council Communitrak Survey May 2018 http://old.tasman.govt.nz/policy/reports/resident-survey/

National Policy Statement on Urban Development Capacity: Assessment for Tasman                                    Page 1
For Tasman District, NZ internal migration was the main source of population growth between 2013-2016
(2.4% of the total population growth of 4.4%). 2 Overseas migration contributed 1.5% for the same period and
this excludes New Zealanders returning (0.2%). For the year ended June 2018, 0.7% of house buyers in Tasman
were not NZ citizens/not NZ residents, similar to the proportion for Nelson and Marlborough. This is a relatively
low proportion compared with most other local authorities, and lower than the national rate of 2.8%. 3

1.1.4 Affordability and Tenure
Home ownership affordability – Tasman remains the third least affordable region nationally, behind only
Auckland and Central Otago Lakes, creating more demand for private rented housing and social housing.
However, social housing need is worsening in Tasman and the region has reportedly one of the lowest yields on
residential rental property investment in 2017 at 3.5%, discouraging the private rented sector. While Tasman
has traditionally been one of the highest home ownership Territorial Authorities in the country, with ownership
at 75%, we are anticipating declining rates of ownership in the 2018 census as affordability worsens.

1.1.5 Commercial Feasibility of Residential Development
Commercial feasibility of some residential land for brownfield infill sites in Richmond is uncertain. Feasibility
analysis of representative sites showed no or little profit margin and yet some have been successfully
developed and sold. Minimal rollout of brownfield infill sites for housing in Richmond is assumed, at about
eight lots per year over the next 30 years. This forecast is considered realistic, particularly given the number of
recently consented infil developments and the number of proposals seeking resource consent. Commercial
feasibility of representative greenfield residential sites in Richmond proved positive with profit margins of over
20%, at densities appropriate for the zoning. The proposed density however is not always profit maximizing
according to the feasibility studies.

1.1.6 Business Land Availability
Tasman-Nelson economy’s core productive base comprises primary and secondary sectors such as agriculture,
forestry, fishing and manufacturing. There is also a growing service sector. However, over the last 15 years,
the Tasman Nelson economy has become comparatively less productive in a New Zealand context. The
regional economy has experienced significantly less net growth (on a per capita GDP basis) than all other
regions in the South Island by a margin greater than 10%. 4

Business land needs will be met despite losing 50 ha of deferred zoned business land in Richmond West to
residential use under gazetted Special Housing Areas (SHAs). These decisions necessitated other areas of
Richmond West being brought forward earlier for business land rollout. These same areas are dependent in
the short term on a decision on an augmented water supply for Richmond, which will be made by the end of
2018. The Waimea community dam is the preferred solution to a looming shortage of water for urban supply
and for the purposes of this capacity assessment it is assumed that it will proceed.

Ground-truthing of business land demand and supply– ground truthing of business requirements and capacity
of existing business land in Richmond (including vacancies) is needed. Planned surveys and inspections in the
near future will address these knowledge gaps and will inform future growth model reviews in terms of quality
of supply. We will seek to achieve greater efficiencies by re-using vacant business land.

Feasibility of business land – Tasman’s Growth Demand Supply Model assesses the cumulative effect of the
Resource Management Plan’s zoning, objectives and policies (where they exist) for each development area in
Richmond. Where not yet zoned for development, the planning and infrastructure opportunities and
constraints are considered and how they may affect the feasibility for future development. This analysis will be

2 https://insights.apps.treasury.govt.nz/ The New Zealand Treasury's Analytics and Insights team have recently developed
the ‘Insights’ web app
3 https://www.stats.govt.nz/information-releases/property-transfer-statistics-june-2018-quarter
4 “Economic Demand Business Forecasting” Property Economics (2016) page 11

National Policy Statement on Urban Development Capacity: Assessment for Tasman                                    Page 2
built upon with a visual inspection of all business sites in late 2018.

1.1.7 Infrastructure Constraints
Infrastructure to support growth is the challenge facing Tasman District Council
The required infrastructure investment, rather than availability of land, remains the major challenge to enabling
development capacity. Two thirds of the population live in 17 settlements and the other third live in the rural
areas. Together with the financial constraint of servicing such a large area with a relatively low population, a
financial risk also exists for us of over investing in infrastructure and over supplying capacity. For residential
growth, there are two clear fronts of growth in Richmond, one in Richmond West and one in Richmond South.
Both of these growth areas are dependent on new water infrastructure in particular and improved stormwater
network capacity.

Transport infrastructure
The existing transportation network in Richmond is coming under more pressure as the number of people living
and working in Richmond grows. We have planned in our Long Term Plan (LTP) 2018-2028 a series of
improvements to create road environments that are safer and better accommodate all road users. We are also
currently preparing a Network Operating Framework (NOF) for Richmond with the NZTA and NCC. The NOF
considers all forms of transport as well as how each mode interacts with the other.

1.2      Summary of Rollout for Housing and Business
Table 1 below shows the proposed rollout of housing land compared with the demand for housing in
Richmond:

Table 1: Rollout of Residential Land Compared With Demand, Richmond
                                                                          Demand
    Richmond Settlement
           Area                          Years 1-3                    Years 4-10                   Years 11-30
                                   (2018/19 — 2020/21)           (2021/22 — 2027/28)           (2028/29 — 2047/48)
   Dwellings required to                    390                            701                          950
   meet demand (includes
   NPS margin)5

   Totals planned in rollout                642                            880                          941

   Under/over supply?                      +252                            +179                          -9

The oversupply of housing land for Richmond is being driven by developers (through the SHAs) not Council.
The risk of Council overinvestment in infrastructure is mitigated through a joint funding model between Council
and developers for some key infrastructure.

Table 2 below shows the proposed rollout of business land compared with the expected demand for business
lots in Richmond. The extra capacity required by the NPS-UDC for years 11-30 (16 lots), is all provided for in
years 1-10:

5 Includes the additional margin of feasible development capacity over and above projected demand, of 20% for years 1-10
and 15% for years 11-30 (policy PC1 NPS-UDC).

National Policy Statement on Urban Development Capacity: Assessment for Tasman                                   Page 3
Table 2: Rollout of Business Land Compared With Demand, Richmond
Demand
Richmond Settlement Area
Years 1-3 Years 4-10 Years 11-30
(2018/19 — 2020/21) (2021/22 — 2027/28) (2028/29 — 2047/48)
Business lots required to 44 106 125
meet demand (includes
NPS margin)
Totals planned in rollout 56 120 109
Under/over supply? +12 +14 -16
The above summary assumes that the proposed Waimea Community dam will proceed. In the event that it
does not, Appendix 5 of this report provides some further analysis.
1.3 The Future
The next review of the Growth Demand Supply Model (GDSM) is scheduled to commence in August 2019 in
order to inform the LTP 2021-2031. Before that review takes place, it is proposed that a Future Development
Strategy (FDS) for Nelson and Tasman will be completed, so it can inform at a strategic level, the next LTP and
GDSM review.
In continuing to plan jointly with NCC, efforts will be made in future capacity reviews to align our growth
models more closely. Our GDSM will continue to be improved, including incorporating some detailed
requirements of the NPS-UDC. Quarterly monitoring reports required under the NPS-UDC are prepared
regularly with NCC and these will continue to inform growth planning. They can be found on our website at
https://www.tasman.govt.nz/my-council/key-documents/more/growth/housing/urban-development-
capacity-reports/.
It is acknowledged that some ground truthing of business requirements and capacity of existing business land
in Richmond is needed. Planned surveys and inspections in the near future will address these knowledge gaps,
inform future growth reviews in terms of demand and achieve greater efficiencies in terms of supply.
By the end of 2018 a final decision on the proposed Waimea community dam will be made. This capacity
assessment has been prepared on the basis that the dam will proceed. If it does not, appendix 5 of this report
provides some analysis on how business growth may still be provided for, while an alternative augmentation
solution is determined.
National Policy Statement on Urban Development Capacity: Assessment for Tasman Page 42 Introduction The Nelson Main Urban Area is defined as a medium growth area according to the National Policy Statement on Urban Development Capacity. Its projected growth rate falls just below the 10% threshold for high growth at 9.95%. The next Territorial Authority population projections are due September 2019 based on the 2018 census. The medium and high growth areas are unlikely to be reassessed nationally before 2021. Richmond and nearby area units form part of the Nelson ‘Main Urban Area’ defined by Stats NZ, together with most of Nelson City’s District. 2.1 Purpose The purpose of this report is to demonstrate that we are enabling an adequate supply of housing and business land to meet demand. Its findings are based on the 2016 Growth Demand Supply Model (GDSM) review that informed the Long Term Plan (LTP) 2018-2028. Reporting is a requirement of the National Policy Statement on Urban Development Capacity (NPS-UDC) to carry out a housing and business development capacity assessment at least three yearly and to publish the assessment (policy PB1). The NPS-UDC requires Local Authorities to adapt and respond to evidence about urban development and the market activity in a timely way (Objective OC2). All medium and high growth local authorities are also required by the NPS-UDC to monitor a range of indicators on a quarterly basis and these reports are provided on our website (policy PB6). (See http://old.tasman.govt.nz/policy/reports/urban-development-capacity-monitoring-reports/). This report is one of three that together comprise the Nelson Main Urban Area Housing and Business Capacity Assessments. This report covers Richmond, within Tasman District Council. Nelson City Council (NCC) has produced its own capacity assessment for the remainder of the Nelson Main Urban Area and there is a third bridging report prepared by both Councils, called “National Policy Statement on Urban Development Capacity Assessment – Nelson-Tasman Overview”. This overview summarises the capacity assessment for the whole Nelson Main Urban Area. Part of our District falls within the Nelson ‘Main Urban Area’ as defined in the NPS-UDC. The term ‘urban area’ originates from Stats NZ and they are statistically defined areas with no administrative or legal basis. Figure 1 below shows the Main Urban Area extent in Nelson and Tasman Districts. It includes most of Nelson City’s area and the following area units in Tasman - Richmond East and West, Aniseed Hill, Bell Island, Best Island, Hope and Ranzau. This housing and business assessment (HBA) therefore only covers Richmond and the above area units within Tasman District Council (TDC). Our growth planning undertaken since 2005 is however district wide. As the NPS-UDC states, the application of policies PB1-PB7 is not restricted to the boundaries of the Main Urban Area. We may therefore choose in the future, in responding to demand from Richmond, to make land available elsewhere. The Future Development Strategy to be prepared in 2018/19 will help guide such decisions in the future. National Policy Statement on Urban Development Capacity: Assessment for Tasman Page 5
Figure 1: Nelson Main Urban Area. Source Statistics New Zealand Census of Population and Dwellings
2001

Stats NZ completed its update of population projections for urban areas in September 2017. For the Nelson
Main Urban Area this concluded that population growth forecast between 2013 and 2023 has risen to 9.95%,
as compared with 8.5% in 20166. This means the Nelson Main Urban Area is still classified as ‘medium growth’,
according to the NPS, falling just below the 10% threshold defining ‘high growth’ urban areas. The next
Territorial Authority population projections are due September 2019 based on the 2018 census. We
understand the medium and high growth areas are unlikely to be reassessed nationally before 2021.

6 Source – Proposed National Policy Statement on Urban Development Capacity Consultation Document, MfE & MBIE
(2016)

National Policy Statement on Urban Development Capacity: Assessment for Tasman                              Page 6
3 Tasman’s Capacity Planning Process – the
Growth Demand and Supply Model
Our Growth Demand and Supply Model is reviewed every 2-3 years to inform the Long Term
Plan process. The last review was in 2016. Between 2013 and 2016, most new titles and
residential building consents were granted in Richmond South and Richmond East. Business
building consents were mainly granted in Richmond’s town centre and Richmond West.
District wide our annual building consents usually hover around the 300 mark, but have risen
to 400 in recent years. Residential building consents in Richmond alone exceeded 170 for
the last financial year. Since 2013, in Richmond, 79% of building consents for new dwellings
were for houses, 19% were for units in retirement villages, and 2% were for other units or
townhouses.
3.1 Process
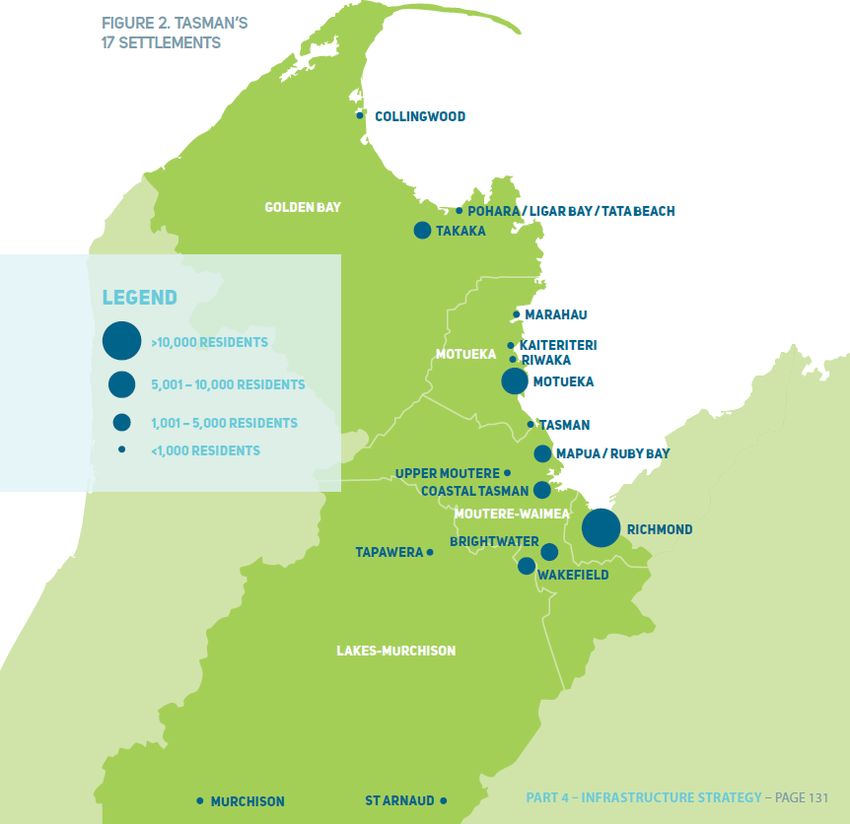
We have relied on our own GDSM for planning since 2005. It is a district-wide, long-term planning tool that
provides population and economic projections for the 17 settlements and expected demand and supply for
land and services for each settlement. Figure 2 shows the settlements.
Figure 2: The 17 settlement areas within growth model (source- Infrastructure Strategy)
National Policy Statement on Urban Development Capacity: Assessment for Tasman Page 7The GDSM itself has been well tried and tested over the years and is continually improved. The GDSM fulfils policies PB1-PB5 of the NPS-UDC in providing evidence and monitoring to support planning decisions. Details on how the model works are provided in Appendix 1. A 2017 update on the model’s assumptions can be found on our website at: http://old.tasman.govt.nz/policy/growth-model/ . Richmond is the largest urban settlement in the Tasman District by both population and land area. It is situated on the north-eastern edge of the Waimea plains close to the Waimea inlet, adjoining NCC’s boundary. In order to inform the LTP 2018-2028, the latest review of the GDSM commenced in August 2016 and was completed in January 2017. This was just after the final version of the NPS-UDC came into effect in December 2016. However, requirements such as the additional capacity margin required by the NPS-UDC featured in the draft, and they were incorporated into the 2016 GDSM review. The GDSM is reviewed every 2-3 years, in synch with the LTP. The next review will commence in August 2019. The model itself is continually improved every two years and in 2016, a completely new platform was built. In summary, a review of the GDSM involves the following steps as shown in Figure 3: Figure 3: The GDSM Process Building consents monitoring has shown Council (district wide) hovering around 300 residential Building consents per year since 2005, (except for 2009 and 2011 which could have been explained by the Global Financial Crisis), rising to nearer 400 in more recent years. Residential building consents in Richmond alone exceeded 170 for the last financial year. Since 2013, in Richmond, 79% of building consents for new dwellings were for houses, 19% were for units in retirement villages, and 2% were for other units or townhouses – see Figure 4 below. National Policy Statement on Urban Development Capacity: Assessment for Tasman Page 8
Nelson Main Urban Area (within TDC), building consents for
                                                     new dwellings, by type
                               200
   Number of consents issued

                               150

                               100

                                50

                                 0
                                       2011    2012      2013       2014      2015     2016      2017   2018
                                                                    Year ended June

                                          Houses      Retirement village units    Units or townhouses

Figure 4: Residential Building Consents by Dwelling Type, Nelson Main Urban Area within TDC

The settlement area (SA) boundary for Richmond used in the GDSM is similar to the boundary of the Main
Urban Area under the NPS-UDC. A map showing the difference between the two boundaries is provided in
Appendix 2. The SA is reviewed every 2-3 years with consideration given to whether the boundary needs to be
changed or the shape of DAs or new DAs created. The SA boundary is for planning purposes and does not
indicate the extent of future development.

National Policy Statement on Urban Development Capacity: Assessment for Tasman                                 Page 9
4 Assessment of Demand for Housing Richmond’s population has been growing by at least 1% annually since 2007. The only age bracket forecast to increase between 2018 and 2043 is 65 years plus. By 2043, the 65 year plus age bracket will form more than one third of the population. Household sizes are decreasing and most of the projected growth will be in smaller households, especially one or two people. Due to lack of housing affordability, it is anticipated that between the 2013 and 2018 censuses, ownership, traditionally very high in Tasman, will decline. However, Tasman has one of the lowest yields on residential rental property investment in 2017 at 3.5%, so this may constrain growth in the rental sector. Social housing need continues to increase, along with the number of ‘priority A’ applicants. The size of new dwellings in Richmond has declined over recent years, with sizes peaking at an average of 224 sq. m. in 2014 and declining to 180 sq. m. in 2018. There has also been growth in the number of units and townhouses. The growth model estimates that we need an additional 1,100 dwellings in Richmond between 2018 and 2028 to meet demand and a similar amount of dwellings between 2028 and 2048. In Richmond, it is forecast that 30% of the future demand for housing will be for units or townhouses, or units in retirement villages, and 40% will be for small houses. 4.1 Current Consumption Patterns of Population In 20137, 85% of Richmond’s housing stock was separate, stand-alone houses. Census data does not indicate the size of the house or whether it is on a lifestyle property. However, as an indication of size, 22% have one or two bedrooms, 44% have three bedrooms, and 34% have four or more bedrooms. 11% of Richmond’s occupied housing stock was units/townhouses. Census data does not indicate which units were in retirement villages however. In 2018, in Richmond the average size of a new house was 180 sq. m., compared with 116 sq. m. for retirement village units and 127sq.m. for other units or townhouses. The size of new dwellings in Richmond has declined over recent years, with sizes peaking at an average of 224 sq. m. in 2014. There has also been growth in the number of units and townhouses. 4.2 Future Broad Demand Patterns 4.2.1 Growth Model Outputs for Richmond Traditionally we have used medium series population projections district wide to reflect the most likely scenario of population growth for the GDSM. However, the 2016 review ran different growth scenarios for different settlements. This was largely due to growth in the District occurring at a faster rate in some settlements than predicted by the GDSM in the 2014 review. For the larger settlements, including Richmond, Council preferred high growth population projections for 2018-2028, followed by medium growth projections for 2028-2043. Further analysis of the Nelson Main Urban Area population growth projections was commissioned from Infometrics in July 2017. It concluded that based on recent historical population growth and the current macroeconomic and migration backdrop, the assumption that Nelson Main Urban Area will experience population growth exceeding 10% between 2013 and 2023 is entirely reasonable. Population growth in the Nelson Main Urban Area exceeded 10% over the period 2007-2016. For every year over the past decade annual 7 2013 Stats NZ Census data National Policy Statement on Urban Development Capacity: Assessment for Tasman Page 10
population growth was 1% or above. We have also seen record net migration inflows affecting Nelson and
Tasman in recent years.

On that basis, for Richmond (residential), Stats NZ’s high growth population projections were used for 2018-
2028 plus the NPS-UDC extra margin of capacity (+20% years 1-10, and +15% 11 – 30 years). Medium growth
projections were used for 2028-2048. For business, the medium growth population projections were modelled
throughout8.

Table 3: Population Projections for Richmond from GDSM
                               Years 1-3            Years 4-10               Years 11-20
                                                                                                         Years 21-30
                              (2018/19—         (2021/22—2027/28)        (2028/29—2037/38)
  Richmond                                                                                           (2038/39–2047/48)
                               2020/21)9

                                 15112                    16157                   16607                      16607

As table 3 shows, population growth is forecast until 2038 when it is expected to plateau.

Table 4: Household Size Projections for Richmond from GDSM
                                Years 1-3           Years 4-10               Years 11-20                Years 21-30
  Richmond                 (2018/19—2020/21)    (2021/22—2027/28)        (2028/29—2037/38)          (2038/39–2047/48)

                                  2.55                     2.5                     2.4                        2.3

As table 4 shows, the average household size is expected to decrease from 2.6 people per household in 2018 to
2.3 people per household by 2043.

                 25000

                 20000
    Population

                 15000

                 10000

                 5000

                    0
                             2008        2013    2018        2023      2028         2033        2038         2043
                         0-14 years         15-39 years           40-64 years             65 years and over

Figure 5: Tasman Population by Age Group

As Figure 5 shows, the proportion of the population aged 65 years and over is projected to increase between
2008 and 2043 and is the only age bracket to increase over this whole period. By 2043 the over 65s will form
37% of the population in our District.

8 All projections used are Statistics NZ Subnational Population Projections 2013(base)-2043 update (released 22 February
2017). The low projection uses low fertility, high mortality, and low net migration for each area. The high projection uses
high fertility, low mortality, and high net migration for each area.
9 Financial years

National Policy Statement on Urban Development Capacity: Assessment for Tasman                                       Page 11
The New Zealand Treasury's Analytics and Insights team have recently developed the ‘Insights’ web app 10. For
Tasman District, NZ internal migration was the main source of population growth between 2013-2016 (2.4% of
the total population growth of 4.4%). Overseas migration contributed 1.5% for the same period and this
excludes New Zealanders returning (0.2%). For the year ended June 2018, 0.7% of house buyers in Tasman
were not NZ citizens/not NZ residents, similar to the proportion for Nelson and Marlborough. This is a relatively
low proportion compared with most other local authorities, and lower than the national rate of 2.8%. 11
The number of dwellings required for Richmond forecast by the GDSM is set out below:
Table 5: Number of dwellings required to meet demand in Richmond 2018-2048
Demand
Richmond
Years 1-3 Years 4-10 Years 11-30
(2018/19 — 2020/21) (2021/22 — 2027/28) (2028/29 — 2037/38)
Dwellings required to meet
390 701 950
demand12
The 2017 Growth model summary at http://old.tasman.govt.nz/policy/growth-model/ provides details of the
methodology for the GDSM but the model does calculate demand for dwellings for non-residents, such as
holiday houses or temporary worker accommodation. Some of Council’s settlements such as St Arnaud,
Kaiteriteri, Marahau, Pohara/Ligar Bay/Tata Beach, and Collingwood have significant proportions of holiday
homes. This is not such an issue for Richmond however.
4.2.2 Demand for Different Household Groups
According to the latest household projections from Stats NZ, most of the projected growth for Tasman will be
in smaller households, particularly consisting of one or two people. It is assumed that this trend will be similar
for Richmond, as it has a similar age profile to the District as a whole.
In the 2018 Communitrak Survey of residents, we asked a question about people’s preferred housing type,
based on their current housing needs and budget. The survey revealed that the majority of Richmond’s 13 one-
person households prefer smaller dwellings, either a small house 14 (46%), a unit or townhouse (17%) or a unit
in a retirement village (17%); and while almost half of Richmond’s couple-without-children households also
prefer smaller dwellings, 37% prefer a larger house15. 15% would also prefer a lifestyle block.
By combining the housing type preferences from the Communitrak residents’ survey and projected growth of
each household type for Richmond, we can conclude that 30% of the future demand for housing will be for
units or townhouses, or units in retirement villages, and 40% will be for small houses.
10 https://insights.apps.treasury.govt.nz/
11 https://www.stats.govt.nz/information-releases/property-transfer-statistics-june-2018-quarter
12 Includes the additional margin of feasible development capacity over and above projected demand, of 20% for years 1-10
and 15% for years 11-30 (policy PC1 NPS-UDC).
13 Data is for the Richmond Ward
14 Smaller than 150m2
15 Bigger than 150m2
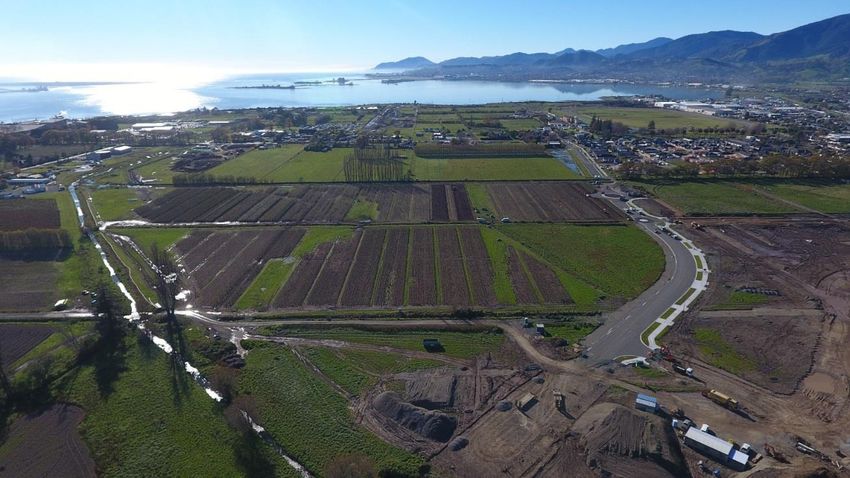
National Policy Statement on Urban Development Capacity: Assessment for Tasman Page 12Future Housing Demand, by Dwelling Type
Unit in Lifestyle
retirement property
village 5%
14%
Other House
6% bigger than
150m2
19%
Unit or
townhouse
16% House smaller
than 150m2
40%
Figure 6: Future housing demand by dwelling type, Nelson Main Urban Area falling within Tasman District
Council
With an ageing population and affordability issues, there is a risk of older people living in housing-related
poverty.
4.3 Unmet Demand
4.3.1 Private Rental Stock
Table 6 below is from the 2013 census and shows that in Tasman 75% of dwellings were owned or in a family
trust (where stated) in 2006. This is one of the highest proportions nationally. In 2013, this remained at 74.9%.
The 2018 census will reveal how this has changed but it is anticipated that with affordability significantly
worsening over the last five years, ownership will have declined.
Table 6: Dwelling Ownership in Tasman 2006-2013
Tasman District 2006 2013
Dwelling owned or partly owned 10,002 10,194
Dwelling not owned and not held in a family trust 3,864 4,353
Dwelling held in a family trust 2,085 2,850
Total households stated 15,951 17,400
Not elsewhere included 849 864
Total households, Tasman District 16,800 18,261
The report “A Stocktake of New Zealand’s Housing” prepared for the Government in February 2018 provides
some estimates of rental housing stock for Tasman between 2013-2017 as shown in Table 7:
National Policy Statement on Urban Development Capacity: Assessment for Tasman Page 13Table 7: Regional Tenure Patterns and Estimates of Rental Housing Stock 2013-201716
Estimate of
% of dwellings Stock not Estimate of % of dwellings
Total housing rental housing
Region not owned owned by stock June rented in June
stock 2013 stock June
2013 occupants 2017 2017
2017
Tasman 21,582 25% 5,400 22,700 6,100 26.9%
The report notes at page 8 that regions with the lowest proportions of rental housing nationally are Tasman
(27%) and Marlborough (31%). The same report notes in Table 7 (page 55) that Tasman has one of the lowest
yields on residential rental property investment in 2017 at 3.5%. Media reports and anecdotal evidence suggest
that with continuing rising house prices in Tasman the rental stock is insufficient, yet with such low yields the
private rental market is likely to be constrained.
4.3.2 Social Housing Need
As reported in the NPS-UDC Nelson-Tasman quarterly monitoring reports, (https://www.tasman.govt.nz/my-
council/key-documents/more/growth/housing/urban-development-capacity-reports/), social housing need is
increasing in Tasman. The Ministry for Social Development administers the Social Housing Register and as at
December 2017 this showed for Tasman there were 40 applicants. In Tasman 27 of the 40 applicants are
‘priority A’ applicants (severe and persistent housing need that must be addressed immediately). According to
the Social Housing Register, demand for housing in Nelson and Tasman is largely for 1 and 2 bedroom
dwellings. By March 2018 the number of applicants had risen to 58 for Tasman and 44 of these are ‘priority A’.
According to the Housing Register, demand for housing in Nelson and Tasman remains largely for 1- and 2-
bedroom dwellings.
The Housing Minister announced in March 2018 that 20 new state houses would be built in the
Nelson/Marlborough region. Seven of these dwellings will be constructed in Nelson and will consist of three 2-
bedroom homes and four 1-bedroom homes.
The Public Housing Plan 2018-2022 (released in August 2018) indicates that 30 public bed spaces will be
provided by 2022 in 15 additional houses, for Tasman. These will likely be provided by both Housing New
Zealand and Community Housing Providers.
In addition to social housing need, the need for affordable housing is pressing in the District, as shown by
MBIE’s housing affordability measures i.e. the number of those who earn sufficient not to qualify for social
housing but insufficient to be able to afford market housing. Affordability is reported on in the quarterly
monitoring reports produced by Tasman and Nelson and can be found at the link above.
16Table 7 “A Stocktake of New Zealand’s Housing” February 2018 by Alan Johnson, Philippa Howden-Chapman and
Shamubeel Eaqub
National Policy Statement on Urban Development Capacity: Assessment for Tasman Page 14The 2016 review of the GDSM oversupplies capacity to meet demand in years 1-10 for
housing in Richmond. 1,500 lots are to be provided by 2028, compared with estimated
demand for about 1,100 lots. An oversupply in the short term is considered appropriate due
to the increasing numbers of building consents being granted in Richmond and evident
strong demand. Much of the oversupply is developer driven through Special Housing Areas.
There are two clear fronts of growth in Richmond: Richmond West and Richmond South.
Both of these growth areas are dependent on new water infrastructure and improved
stormwater network capacity. 70% of future demand for housing in Richmond is projected
to be for small houses or units. The capacity identified for Richmond complies with the NPS-
UDC in that it is appropriately zoned and serviced, or in the longer term identified for
servicing in the LTP or Infrastructure Strategy. The representative greenfield residential sites
are all commercially feasible. The brownfield infill sites are not and yet some have since
been built and sold. There also continues to be a growing number of intensive infill proposals
in Richmond. Land ownership concentration is an issue with around 65% of the
undeveloped residentially zoned land in the Nelson Main Urban Area owned by just ten
people or companies. This is among the top three worst areas nationally for a large amount
of land being held by a small number of owners.
5.1 Cumulative Effect of all Zoning, Objectives, Policies, Rules Overlays and
Designations in Tasman Resource Management Plan
Round 1 of the GDSM undertakes a review of urban land supply potential (assessing opportunities and
constraints for every Development Area (DA) within each settlement). It looks at land use effects, network and
community services effects for each DA. This evaluation therefore assesses cumulative effect of the zoning and
objectives and policies in the Resource Management Plan where they exist. Where not yet zoned for
development, the planning and infrastructure opportunities and constraints are considered and how they may
affect feasibility for future development.
A DA is defined as one continuous polygon within a settlement that if assessed as developable (i.e. net positive
score from the criteria evaluation), is expected to contain a common end-use and density for built
development. Some DAs may be assessed as unsuitable for development due to e.g. the existence of hazards.
5.2 Assessing Development Capacity (Sufficiency)
Sufficiency of development capacity is defined in the NPS-UDC as the provision of enough development
capacity to meet housing and business demand and capacity that reflects the demands for different types and
location of development capacity. Rounds 2 and 3 of the GDSM assess development capacity.
Round 2 of the GDSM evaluates the potential yield of positively scoring DAs and the potential supply of lots.
More information is provided on this stage under “commercial feasibility of development capacity” below.
Round 3 - development rollout - is the final round of the GDSM, where development of the sites supplied is
forecast both in terms of location within the settlement and over a time horizon. The demand to be met is
assessed at the same time. The rollout for Richmond from the 2016 review of the GDSM is shown in Table 8
below.
National Policy Statement on Urban Development Capacity: Assessment for Tasman Page 15Table 8: Rollout for Richmond (supply of residential land) by Development Area17
Table 9 below shows the proposed rollout of land from above compared with the demand for housing in
Richmond:
Table 9: Rollout of Residential Land compared with Demand
Demand
Richmond Settlement Area
Years 1-3 Years 4-10 Years 11-30
(2018/19—2020/21) (2021/22—2027/28) (2028/29—2047/48)
Dwellings required to meet demand (includes 390 701 950
NPS margin)
Totals planned in rollout 642 880 941
Under/over supply? +252 +179 -9
5.1.2 Conclusions on Assessing Development Capacity
There are two clear fronts of growth in Richmond, one in Richmond West and one in Richmond South. Both of
these growth areas are dependent on new water infrastructure and improved stormwater network capacity
and this is discussed further below.
After completion of the 2016 GDSM review, a number of Special Housing Areas (SHAs) were gazette in
Richmond. The GDSM was subsequently rerun to take account of these and previous assumptions to expand
17Units on existing lots means existing consented vacant lots, obtained by a count of vacant lots with a minimum size
threshold of 300 sqm. Units on new lots means lots created by subdivision.
National Policy Statement on Urban Development Capacity: Assessment for Tasman Page 16Richmond southwards in the longer term, were reversed. This was largely due to the significant contribution large SHAs in Richmond West on deferred Mixed Business and Light Industrial zoned land would make to overall supply. An oversupply remained after taking the SHAs into account, but this was felt to be appropriate due to the increasing numbers of building consents being granted in Richmond and evident strong demand. The additional oversupply was also developer driven through the gazetted SHAs. 5.1.3 Zoning Status of DAs for Richmond Rollout (Residential) As policy PA1 in the NPS-UDC states, capacity within years 1-10 is required to be zoned; and within years 11-30 is to be identified in relevant plans and strategies. The table in appendix 3 shows that the DAs in the development rollout are either appropriately zoned for Residential or Rural Residential to enable the supply. Where zoned deferred, the deferral has either been uplifted to enable development or can shortly be uplifted due to the existence of a developer agreement. The TRMP explains the deferred zone in chapter 17. The removal of the deferred status and the commencement of the new effective zone as listed in Schedule 17.14A (deferred zone locations), is effected by a resolution of Council when the required services have been provided, or can be provided, to the satisfaction of the Council. The Plan is then amended without further formality from that date of resolution, to show the new effective zone. We advise landowners when we have made a resolution. (TRMP 17.14.2(d)). The deferred zone rules in the TRMP enable either the Council or any person to provide the required services and any person may propose to service any part or all of any deferred zone area. In either case, the Council has to approve the servicing proposal, before the deferred status over the relevant part of the future zone can be removed by a resolution of Council. Services may be provided either before or after removal of any deferral. (17.14.20 TRMP). Some of the larger SHAs were established on land zoned Rural 1 deferred Mixed Business and Light Industrial. These sites will be proposed for rezoning once resource consents are granted and there is certainty of the proposals being implemented. In all cases the SHAs are progressing towards this status. In the case of DA8 that is zoned Rural 1 deferred Residential, a developer agreement exists for services and it is able to be uplifted soon. Resource consent has already been granted for development of part of this site and an application is being put together for the remainder. In the case of DA42 that is required in the longer term (years 11-20), it is dependent on the low-level reservoir in Richmond and this project is in the LTP. 5.1.4 Range of Capacity Provided As evidenced by the explanation of zoning status for each DA in appendix 3, the TRMP enables a range of residential capacity in Richmond. Different types of dwellings can be built, including standard, compact, comprehensive, intensive (including minor units), all with different development standards (see Figure 7 below). Rural residential is also enabled in Richmond although rollout of further land for this density does not feature in this review. This was due to SHAs being gazetted on parts of the land zoned Rural Residential and ultimately proposing development at a density higher than that envisaged by the underlying zone. A recent Plan Change for Rural Area rules in the Resource Management Plan has also enabled workers’ accommodation, minor dwellings/attached housekeeping units and sleep outs on rural land. Outside of Richmond, Papakainga zones exist e.g. Motueka West within Te Awhina Marae that enable housing types such as community housing, short term accommodation and kaumatua units. National Policy Statement on Urban Development Capacity: Assessment for Tasman Page 17
Figure 7: Different types of Urban Residential development for Richmond in the TRMP

Section 4 of this report identified that in Richmond, 30% of the future demand for housing is projected to be
for units, townhouses, or units in retirement villages, and 40% is projected to be for small houses. Small houses
were defined as less than 150 sq. m. in the Communitrak survey, units or townhouses were not defined by size.
Round 2 of the growth model on yield assumed smaller typical lot sizes for the following DAs included in the
land rollout for Richmond:

National Policy Statement on Urban Development Capacity: Assessment for Tasman                            Page 18
Table 10: Typical Lot Sizes assumed for Certain DAs in Richmond Residential Land Rollout
Typical Lot Size (sq. m) assumed in GDSM
DA in Richmond Comment
(round 2)
2 300 Richmond Intensive Development Area
6 450 SHA Richmond West
8 450 SHA Richmond West
24 450 Richmond South
44 250 Richmond West
59 400 Richmond East
61 350 Richmond Intensive Development Area
62 400 Waimea village
70 425 SHAs Richmond West
Remaining DAs in the Richmond land rollout all assume larger typical lot sizes. In the DAs of Richmond that
feature in table 10, building coverage under the TRMP is generally 40%, rising to 50% in DAs 61 and 2
(Richmond Intensive Development Area). The average lot size in table 10 is 386 sq.m. Building coverage of 40%
on a site of this size would provide a house of 154 sq. m. (less if outbuildings/garage were separate from the
main house), equating to a “small” house as defined in the Communitrak survey. All the DAs in table 10
together provide just over 70% of the total rollout for Richmond. The Communitrak survey, when combined
with projected growth of each household type found that 70% of the future demand for housing is projected to
be for units, townhouses, or units in retirement villages, or small houses. The majority of DA70 comprises a
consented retirement village currently being built. 17% of one-person Richmond households in the
Communitrak survey preferred a unit in a retirement village as their housing type. This retirement village will
deliver 267 units.
It is not an exact science. The GDSM predicts typical lot size based on existing or proposed zoning patterns.
The subsequent resource consents may however propose a different density overall with variation within the
subdivision. In the case of SHAs the eventual lot sizes can vary significantly from the underlying zoning.
In the gazetted Richmond SHAs, densities are greater than envisaged by the GDSM. For example for The
Meadows SHA in DA6 the GDSM assumed 150 lots in years 1-10; the latest masterplan submitted for resource
consent shows 471 lots, so a gain of 321 lots from the original forecast. Typical lot sizes are around 500 sq.m
for standard residential, 300 sq.m for terraces and 350 sq.m for duplexes. DA70 comprises Arvida retirement
village and The Fields SHA and the GDSM assumed 200 lots in years 1-10. Consented masterplans show 338
lots/units, so a gain of 138 lots/units from the original forecast. Similarly Applebyfield SHA (DA8), although at
pre-application stage, proposes a greater number of lots than assumed in the GDSM.
5.1.5 Price efficiency indicator monitoring
In May 2018, following the release of price efficiency indicators for Nelson Main Urban Area, the data on the
MBIE website was analysed. This was after extensive discussions with MBIE over some of the source data. The
indicators comprise Price – Cost ratio (homes), Rural-urban land value differential and Industrial zone
differential. Land ownership concentration was not available for Nelson-Tasman at that time but has since
become available. The data has been monitored and the analysis is provided in Appendix 4. In summary, the
analysis revealed the following:
Price-cost ratio indicator: The price-cost ratio (gap between house prices and construction costs) peaked in
2004. It then declined steadily between 2004 and 2014. Since 2014, it has risen steadily with a marked
increase between 2016-17. The latest ratio puts Nelson Main Urban Area just above the ‘acceptable’
threshold for supply of land being responsive to demand i.e. supply of land is not responsive to demand and
insufficient development opportunities exist:
National Policy Statement on Urban Development Capacity: Assessment for Tasman Page 19Table 11: Price-Cost Ratio for Nelson Main Urban Area – source MBIE dashboard
Price Cost Ratio 2014 2015 2016 2017
Year 1.265 1.265 1.375 1.552
Rural-urban land value differential indicator: Nelson’s Main Urban Area ratio is currently 2.10 i.e. urban
land is valued at roughly twice the value of non-urban land or $153 per sq. m more. The cost per section of
the rural-urban differential is estimated at $91,671 for Nelson’s Main Urban Area by MBIE. Nelson Main
Urban Area land values do not rise as you get closer to the town centres of Nelson and Richmond, conversely
they increase steeply as you get closer to the rural-urban boundaries of both Districts. This is not the same
as for e.g. Auckland and Tauranga. However, as in other cities, there is a significant drop off in land values at
the rural-urban boundary itself. Since urban land in our area is worth twice the value of adjacent non-urban
land, this apparently raises questions over the Main Urban Area’s current plans and whether sufficient urban
development capacity is provided today
Industrial zone differential indicator: This indicator seems to reflect local nuances overall and may be of
limited value for the capacity assessments.
Land ownership concentration: Around 65% of the undeveloped residentially zoned land in the Nelson Main
Urban Area is owned by just ten people or companies, with the largest land holding being 20.3%. It is
difficult to determine the level of ownership concentration that will begin to have an effect on section prices
but for comparison, the Nelson Main Urban Area is in the top three worst areas for a large amount of land
being held by a small number of owners, along with Napier and Hamilton.
5.2 Capacity Supported by Development Infrastructure
The required infrastructure investment, rather than availability of land, remains our major challenge to
delivering development capacity. Recent growth was higher than anticipated in the LTP 2015-2025 and has
taken up considerable amounts of available infrastructure capacity. The combination of this and ongoing
projected population growth in Richmond creates further demand for additional capacity in our infrastructure.
This means bringing forward some infrastructure projects originally planned for later periods.
5.2.1 Water, Wastewater and Stormwater Infrastructure
The two main fronts of growth planned – Richmond South and Richmond West- will require completely new
infrastructure in order to deliver water to the area, which will be largely funded by Development Contributions.
The major infrastructure projects are:
Low level trunk main from Richmond water treatment plant to low level reservoir
Low level reservoir (Richmond South) tanks to provide storage for low level areas of Richmond West and
South (these projects feature early in the LTP)
Higher level reservoir in Richmond South and new trunk main proposed from Richmond water treatment
plant to Richmond South – this services Richmond South in the longer term
Borck Creek stormwater – ongoing upgrading of a new stormwater network
Richmond water treatment plant capacity increase
Headingly Lane pump station and rising main capacity upgrades – needed to assist with capacity arising from
growth
Lower Queen Street/Berryfield Drive intersection upgrade
Nelson Regional Sewerage Business Unit (NRSBU) upgrades – trunk main for Richmond discharges into the
Beach Road pump station that is owned and operated by NRSBU. From the pump station wastewater is
pumped to Bell Island Wastewater treatment plant. Budget allowances are made in the LTP for NRSBU
capital renewals
Proposed Waimea Community dam
National Policy Statement on Urban Development Capacity: Assessment for Tasman Page 20In Richmond West, approximately 800 new residential sections can be serviced using existing and improved services. Additional sections in Richmond West require the low-level trunk main and reservoir for water supply. This infrastructure will be provided by year 4 of the LTP. In Richmond South, 120 lots can develop without the proposed trunk main and low-level reservoir. Subsequent to this infrastructure being built, the remaining lots in Richmond South can be developed. Stormwater infrastructure is not as critical as water for new greenfield development, as developers can always be required to provide on-site detention. However, the ongoing upgrade and widening of Borck Creek in Richmond West is important stormwater infrastructure for Richmond South and West. The transportation project upgrading the intersection of Lower Queen St with Berryfield Drive in Richmond West in year 6 of the LTP will cater for residential and commercial growth in the area. In accordance with policy PA1 of the NPS-UDC, land required in years 1-3 is already serviced. Land required in years 4-10 is either serviced or the infrastructure project is in our LTP 2018-2028. Land required in years 11-30 depends on infrastructure either already in the LTP or Infrastructure Strategy. See LTP web links http://old.tasman.govt.nz/policy/plans/activity-management-plans/ and http://tdc.maps.arcgis.com/apps/MapSeries/index.html?appid=b784191f86a544bdbce1cf4a1d01463a for details of the projects. The Infrastructure Strategy can be found in volume 2 of LTP- http://old.tasman.govt.nz/policy/plans/long-term-plans/long-term-plan-2018-2028/. In addition to above analysis of the GDSM rollout and infrastructure required to service that planned development, analysis has also been undertaken of how much capacity the infrastructure projects will provide for in years 1-10. Figure 8 below illustrates this; the figures on the vertical axis are number of sections. Figure 8 Residential capacity provided by infrastructure projects compared with residential demand Analysis of the capacity provided by the infrastructure projects in the next 10 years shows that in years 1-3, 842 lots are provided for (compared with demand for 390 lots); in years 4-6 an additional 1,078 lots are provided for and in years 7-10 a further 543 lots are provided for (compared with demand in years 4-10 for 701 lots). The residential capacity provided by the infrastructure projects therefore exceeds demand in years 1-10 by 1,372 lots and this is discussed further in the joint “National Policy Statement on Urban Development Capacity Assessment – Nelson-Tasman Overview” report. 5.2.2 Proposed Waimea Community Dam For water supply to Richmond for residential development in the longer term, the 2016 GDSM review assumed National Policy Statement on Urban Development Capacity: Assessment for Tasman Page 21
You can also read