Employment opportunities from a coal-to-renewables transition in South Korea
←
→
Page content transcription
If your browser does not render page correctly, please read the page content below

TECHNICAL ANNEX

Employment opportunities from a coal-to-renewables transi-
tion in South Korea
National and provincial level employment impacts of replacing coal-fired
power generation with solar, wind and storage
July 2021

Find the underlying brief Climate Analytics, Solutions for Our Climate (2021). Employment opportuni-
ties from a coal-to-renewables transition in South Korea for download under:
https://climateanalytics.org/publications/2021/employment-opportunities-from-a-coal-to-renewa-
bles-transition-in-south-korea/

Technical Annex - Climate Analytics and Solutions for Our Climate (2021). Employment opportunities from a coal-to-
renewables transition in South Korea
 1
1. Overview on methodological approach and steps of the analysis
Previous studies showed that a transition towards renewable energy would entail multiple economic
benefits for South Korea, including employment creation potential. This study goes beyond the in-
sights from previous studies. First, to our knowledge it is the first study for South Korea to assess the
employment impacts of phasing out its coal power generation in line with the Paris Agreement and
directly replacing coal power generation with renewable energy. These insights are relevant in the
context of the need for increased ambition from countries in the lead up to COP26 later this year.
Second, it is the first study to provide not only national level estimates but also to look into province
level employment impacts. Our subnational level estimates provide a valuable starting point for a dis-
cussion on potential alternative local employment options that are newly created, initialising a Just
Transition process in South Korea.

 Focus of the analysis

 The analysis focuses on estimating the direct employment impacts of an accelerated South Ko-
 rean coal phase out in line with the Paris Agreement, replacing coal power with solar and wind
 power as well as storage, and comparing this with a Current Policy Scenario based on the coal
 pathway as laid out in the 9th Basic Plan.

 While other existing power generation technologies are considered in the underlying energy sys-
 tem modelling to capture the total energy mix and derive storage needs1, we limit our results to
 showing employment impacts only for those technologies directly related to the coal phase out
 and replacement with solar and wind as well as related storage capacity. Power generation ca-
 pacity and the related jobs that are the same in both scenarios, as they are not affected by the
 analysed shift replacing coal with solar and wind, are not shown in our results. This includes pre-
 existing jobs related to solar and wind which are not stemming from the analysed coal phase out.
 We do not conduct an assessment of the employment impacts for transitioning the whole South
 Korean energy system to 100% Renewable Energy, instead we focus on replacing coal only.

 We focus our results on the period until 2030 to show the relevant period for the suggested coal
 phase out before 2030.

For estimating the employment impacts on the national as well as provincial level that would result
from an accelerated phase out of South Korean coal power plants in line with the Paris Climate Agree-
ment, we conduct the following steps. All parts of the analysis as well as the underlying assumptions
are described in detail in section 3.

Technical Annex - Climate Analytics and Solutions for Our Climate (2021). Employment opportunities from a coal-to-
renewables transition in South Korea
 2

1. We build on previous work2 in which we have derived a Paris Agreement-compatible power-
 generation-related pathway for South Korea based on downscaling the B2DS pathway3 ac-
 counting for relevant policy constraints to obtain an emission pathway for South Korea using
 the model SIAMESE. For more information on the methodology see Sferra et al. (2019) [1].
 2. Also building on previous work [2], we model a unit-by-unit phase out schedules that define a
 ranking which coal power plant units in South Korea should be shut down in which order to
 fulfil the Paris Agreement compatible emission pathway derived in step 1. For the analysis at
 hand, we chose the ranking criteria that most carbon emission-intensive units are prioritised
 for decommissioning (called ‘regulator perspective’ in previous work). For more information
 on the methodology see Technical Annex of this brief that this work builds on Climate Analytics
 (2021) [2]. This accelerated coal-phase out schedule is contrasted with the current policy plans
 in South Korea as described by the 9th Basic Plan for Electricity Supply and Demand [3].
To compensate for the electricity supplied by the phased-out power plants, we model a replacement
of these coal power plants by renewable energy technologies and related storage. This part of the
analysis is conducted in two separate steps:

 3. We conduct an analysis of the South Korean subnational potentials for solar PV rooftop and
 PV open field (utility-scale) as well as for offshore wind and onshore wind based on modelling
 with high-resolution gridded data (see section 3.2 for more details). We exploit the obtained
 spatially explicit information on regional solar and wind potentials to identify in which prov-
 inces in South Korea solar and wind installations would be located for our scenarios.
 4. We created an electricity system model for South Korea based on the “Python for Power Sys-
 tem Analysis” (PyPSA) framework to assess the energy mix for the analysed respective scenar-
 ios. For this, we use the results from the modelling of solar and wind potential from step 3 as
 well as the unit-level coal-phase out schedule from step 2. The results of the PyPSA model
 provide us information on how much capacity of each technology (solar PV rooftop, PV open
 field, offshore wind and onshore wind as well as related storage needs) will need to be installed
 to replace phased out coal for the given developments for other power generation technolo-
 gies. Moreover, exploiting the spatially explicit information on the solar and wind potentials
 (from step 3) as well as the information on which coal power plants is shut down in which year
 (from step 2) combined with information on its geolocation (from the Global Coal Plant Tracker
 [4]), we obtain capacity estimates and their developments over time for each province in South
 Korea for the different technologies.
Building on these previous steps, we conduct an analysis of the direct employment impacts by province
associated with replacing coal power plants with solar and wind power as well as storage for an accel-
erated coal phase out in line with the Paris Agreement as compared to the current policy pathway. We
build on an employment factor approach for assessing impacts on direct jobs. The employment factor
approach is a very transparent and flexible methodology and has been commonly used in the literature
(see, e.g. Rutovitz et al. (2015) [5], Ram et al. (2020) [6]). The general methodology and underlying
assumptions are described in more detail in section 3.3. For our employment analysis, different steps
are needed:

2 In a Climate Analytics study from 2020 a coal phase out pathway for South Korea under the Paris Agreement was derived
 [43]. In another study earlier this year, unit-level-phase out schedules for coal have been analysed assessing the impacts
 on air pollution and health [2].
3 Climate Analytics modelled a Paris Agreement consistent emission reduction pathway for coal generation in South Korea

 based on a downscaling model applied to the IEA’s Energy Technology Perspectives “Beyond 2°C Scenario“, taking into
 account historical emissions until 2019. This pathway has been assessed by Climate Analytics to have characteristics that
 are consistent with the Long-Term Temperature Goal of the Paris Agreement. The Paris Agreement establishes a global
 commitment to limit warming “well below 2°C” and to pursue efforts to limit warming to 1.5°C.

Technical Annex - Climate Analytics and Solutions for Our Climate (2021). Employment opportunities from a coal-to-
renewables transition in South Korea
 3
5. Whenever data availability allows, we empirically derive own South-Korea specific employ-
 ment factors for our analysis. In case this is not possible, we apply employment factors from
 the literature.
 6. Using the results of the PyPSA model providing installed and added as well as retired capacity
 for each technology and province (step 4) and applying the employment factors from step 5,
 we estimate the resulting direct jobs differentiating between different job types (local manu-
 facturing, construction and installation, operation and maintenance) and the different power
 generation technologies that are relevant for our analysis.
 7. We assign the employment estimates to the province level exploiting information from the
 spatially explicit modelling of solar and wind potentials as well as the geolocation of coal power
 plants.

 2. Scenario Description
In December 2020, the Korean Ministry of Trade, Industry and Energy published the 9th Basic Plan for
Long-term Electricity Supply and Demand (short ‘9th Basic Plan’) [3]. It provides projections for energy
demand developments and defines policy plans for capacity developments for different electricity gen-
eration technology groups until the end of the planning period in 2034. While President Moon had
announced in a speech in October 2020 that South Korea aims to become carbon neutral by 2050 and
to replace coal power with renewable energy, the 9th Basic Plan still foresees that coal power genera-
tion capacity would amount to 29 GW at the end of the planning horizon in 2034.

To illustrate the job potential that could be created from an accelerated phase-out of coal-fired power
generation compatible with the Paris Agreement, we model two scenarios that represent different
trajectories with regard to the role and timing of phasing out coal-fired power generation in South
Korea. The current policy plans for coal are modelled in the Current Policy (CPol) scenario. This is con-
trasted with a Coal-to-Renewables (CtR) scenario in which an accelerated coal phase-out occurs by
2029. The underlying assumptions for both scenarios are outlined in more detail below.

Focusing on the role of coal, both scenarios share a range of common assumptions. Electricity demand
is identical in both scenarios and is assumed to follow the projections for demand4 from the 9th Basic
Plan. In both scenarios, it is assumed that electricity supply needs to cover demand plus a stability
reserve, which increases from 17% to 22%. Transmission and distribution are not explicitly modelled.
For the assumptions on renewable energy costs used as an input for the techno-economic optimisation
of the electricity system, we assume medium renewable energy cost projections provided by IRENA.
Moreover, the capacity development of power generation technologies not directly resulting from the
suggested accelerated shift from coal to renewable energy follow the developments outlined in the 9th
Basic Plan in both scenarios. While this other power generation capacity is taken into account in the
optimisation in PyPSA, we assume these to be given exogenously, and thus no employment impacts
are analysed with respect to this capacity. Since the respective capacity is exactly the same in both
scenarios, these employment effects are also identical between scenarios.

4 The electricity demand curve is rescaled to match the total electricity demand as well as peak demand forecast assumptions
 in demand scenario 1 of the 9th Basic Plan for Electricity Supply and Demand. We use the high demand scenario from
 the 9th Basic plan for our analysis to be conservative in the sense that the energy system would be able to cover higher
 demand projections.

Technical Annex - Climate Analytics and Solutions for Our Climate (2021). Employment opportunities from a coal-to-
renewables transition in South Korea
 4
Current Policy (CPol) Scenario

The Current Policy (CPol) scenario is based on assumptions largely derived based on the projections
for energy demand developments as well as planned developments for different electricity generation
technology aggregates from the 9th Basic Plan for Long-term Electricity Supply and Demand [3]. We
highlight the main characteristics of the CPol scenario below.

Development of power generation capacity in the CPol scenario:
• Coal power generation capacity is exogenously defined by the coal trajectory given in the 9th Basic
 Plan defining envisioned shut down (or conversion) dates for specific units. 24 units of coal-fired
 power plants are defined to be replaced by natural gas by 2034, following the dates which coal
 power units are planned to be converted by which year as defined in the 9th Basic Plan.
• Natural gas power generation capacity is also exogenously given following the planned capacity
 developments defined in the 9th Basic Plan. Total installed natural gas capacity increases to 59 GW
 in 2034, including the natural gas capacity stemming from the conversion of coal-power capacity
 into natural gas power plants.
• Power generation capacity for renewable energy and related storage needs are derived by opti-
 mising wind (onshore and offshore) and solar PV (utility-scale and rooftop) capacity, as well as
 electricity storage, with a PyPSA model, which i) covers the electricity demand projections from
 the 9th Basic plan plus an additional stability reserve and ii) follows the total installed renewable
 energy capacity pathway defined in the 9th Basic Plan, which increases to 78 GW in 2034.
• Power generation capacity for other technologies are also modelled as defined in the 9th Basic
 plan. This includes the categories nuclear, pumped hydro, as well as other less relevant technolo-
 gies.

Technical Annex - Climate Analytics and Solutions for Our Climate (2021). Employment opportunities from a coal-to-
renewables transition in South Korea
 5
Coal-to-Renewables (CtR) scenario of an accelerated coal phase-out in line with the Paris Agreement

The Coal-to-Renewables (CtR) scenario sees coal phased out from the power system by 2029 (in line
with benchmarks consistent with the Paris Agreement), and a direct replacement of phased-out coal
capacity by renewables coupled with storage. The scenario is based on previous work5 which derived
a coal phase out schedule for South Korea in line with the long-term temperature limit as defined in
the Paris Agreement. This is also in line with other work conducted by Climate Analytics and others
on Paris-Agreement compatible pathways, finding that coal will need to be phased out before 2030
[7]. We highlight the main scenario characteristics of the CtR scenario below.

Development of power generation capacity in the CtR scenario:
• Coal power generation capacity is defined by the coal capacity trajectory given by the unit-level
 phase out schedule in line with the Paris Agreement. Using the ‘regulator perspective, this unit-
 level phase out schedule defines which coal power plants need to be taken offline in which year
 in order to be Paris Agreement compatible prioritising the shutdown of more carbon emission-
 intensive units.
• Natural gas power generation capacity follows the trajectory of the CPol scenario for those nat-
 ural gas capacity additions that are not stemming from the conversion of coal power into natural
 gas power plants as defined in the 9th Basic Plan. In contrast to the CPol scenario, those power
 plant units that the 9th Basic Plan foresees to be converted into natural gas are shut down and are
 replaced with wind and solar capacity instead of being converted to natural gas. As a consequence,
 developments for natural gas capacity which is not related to the conversion of coal power plants
 into natural gas are assumed identical in the CPol scenario and in the accelerated coal phase out
 scenario, as this analysis focuses on the employment opportunities from phasing out coal-fired
 power generation.
• Power generation capacity for renewable energy and related storage needs are derived by opti-
 mising wind (onshore and offshore) and solar PV (open field and rooftop) capacity, as well as elec-
 tricity storage, with a PyPSA model, which i) covers the electricity demand projections from the
 9th Basic plan plus an additional stability reserve and ii) remains below a Paris Agreement compat-
 ible CO2 emissions pathway of the power sector.
• Power generation capacity for other technologies, including nuclear, biomass, and pumped hy-
 dro, are also modelled as defined in the 9th Basic plan and are thus following the same assumptions
 as in the CPol scenario. As a consequence, the employment impacts related to those technologies
 are neglected in this analysis as they are identical between both scenarios.

5 In a Climate Analytics study from 2020 a coal phase out pathway for South Korea under the Paris Agreement was derived
 [43]. Based on this, in another study in 2021, unit-level-phase out schedules for coal have been analysed assessing the
 impacts on air pollution and health [2].

Technical Annex - Climate Analytics and Solutions for Our Climate (2021). Employment opportunities from a coal-to-
renewables transition in South Korea
 6

Table 1 Electricity generation capacity developments under the CPol and the CtR scenarios: Full capacity as included in the
modelling (top) and capacity directly related to coal phaseout as considered in employment analysis (below)

 Current Policies (CPol) Coal-to-Renewable (CtR)
 scenario scenario
 Capacity as modelled (full power system)
 Capacity directly associated with coal phase
 out (as considered in employment analysis)

Note: PyPSA models the power generation system until 2034, covering the whole period of the 9th Basic Plan. For the em-
ployment analysis, we focus on the time horizon until 2030, while the information from PyPSA on post-2030 capacity addi-
tions is taken into account for upstream jobs such as manufacturing or construction and installation. Hydrogen storage ca-
pacity (in MWh) is not shown.

Technical Annex - Climate Analytics and Solutions for Our Climate (2021). Employment opportunities from a coal-to-
renewables transition in South Korea
 7
3. Methodological steps and underlying assumptions in detail

 Unit-level phase out schedules for South Korean coal power plants

A detailed description of the methodology of how the unit-level-phase out schedule has been derived
can be found in the Technical Annex of a previous brief [2]. For the employment analysis, we focus on
the ‘regulator perspective’ unit-level phase out schedule. Table 2 shows the ranking in which the coal
units are phase out in the Coal-to-Renewables (CtR) scenario as compared to the policy retirement
(Current Policy (CPol) scenario).

Table 2: Unit-level coal power plant phase out schedule

 Unit Name Policy Retirement CtR-Scenario Retirement Emission Intensity
 (g CO2 / kWh)
 Boryeong #1 2020 2020 1045.552
 Boryeong #2 2020 2020 1045.552
 Donghae #1 2028 2020 1256.639
 Donghae #2 2029 2021 1166.901
 Honam #1 2021 2021 1175.02
 Honam #2 2021 2021 1175.02
 Samchonpo #1 2021 2021 1012.987
 Samchonpo #2 2021 2021 1012.987
 Taean #2 2025 2022 939.6995
 Samchonpo #4 2024 2021 972.3855
 Samchonpo #3 2024 2021 972.3855
 Dangjin #3 2030 2023 861.3834
 Yeosu #1 2046 2022 881.4979
 Taean #4 2029 2022 939.6995
 Dangjin #4 2030 2023 861.3834
 Gangreung Anin #1 2052 2026 795.0736
 Gangreung Anin #2 2052 2026 795.0736
 Taean #3 2028 2022 939.6995
 Dangjin #1 2029 2024 861.3834
 Gosung Hai #1 2051 2026 795.0736
 Gosung Hai #2 2051 2026 795.0736
 Samcheok Greenpower #2 2047 2027 795.0736
 Yeosu #2 2041 2021 1094.004
 Taean #1 2025 2022 939.6995
 Boryeong #3 2043 2021 969.909
 Dangjin #9 2045 2028 770.3096
 Yeongheung #1 2034 2024 861.3834
 Dangjin #2 2029 2024 861.3834
 Dangjin #8 2037 2024 847.3219
 Dangjin #7 2037 2025 847.3219
 Yeongheung #2 2034 2024 861.3834
 Dangjin #10 2046 2029 770.3096

Technical Annex - Climate Analytics and Solutions for Our Climate (2021). Employment opportunities from a coal-to-
renewables transition in South Korea
 8

Taean #10 2047 2029 770.3096
 Bukpyeong #2 2047 2023 867.3625
 Bukpyeong #1 2047 2023 867.3625
 Boryeong #4 2043 2021 969.909
 Taean #7 2037 2025 847.3219
 Boryeong #5 2025 2021 969.909
 Boryeong #6 2025 2022 969.909
 Dangjin #6 2036 2023 874.5617
 Taean #5 2032 2024 861.3834
 Hadong #1 2026 2022 939.6995
 Hadong #2 2027 2022 939.6995
 Dangjin #5 2035 2023 874.5617
 Hadong #3 2028 2022 939.6995
 Yeongheung #5 2044 2028 783.0674
 Yeongheung #6 2044 2028 783.0674
 Hadong #4 2028 2024 861.3834
 Hadong #5 2031 2024 861.3834
 Hadong #6 2031 2024 861.3834
 Samchonpo #5 2027 2022 969.909
 Shin-Seocheon 2051 2027 795.0736
 Boryeong #8 2038 2023 874.5617
 Samcheok Greenpower #1 2046 2027 795.0736
 Sinboryeong #2 2047 2027 795.0736
 Samchonpo #6 2028 2022 969.909
 Samcheok PosPower #1 2054 2025 808.2415
 Samcheok PosPower #2 2054 2025 808.2415
 Yeongheung #4 2038 2029 770.3096
 Sinboryeong #1 2047 2028 795.0736
 Taean #8 2037 2025 847.3219
 Taean #9 2046 2029 770.3096
 Taean #6 2032 2024 861.3834
 Boryeong #7 2038 2023 874.5617
 Yeongheung #3 2038 2029 770.3096
 Hadong #7 2038 2025 847.3219
 Hadong #8 2039 2029 770.3096

Technical Annex - Climate Analytics and Solutions for Our Climate (2021). Employment opportunities from a coal-to-
renewables transition in South Korea
 9
Modelling the transition from coal to renewable energy

MODELLING AND ASSESSMENT OF TECHNICAL POTENTIAL OF ELECTRICITY PRO-
DUCTION FROM SOLAR AND WIND ENERGY

The technical potential has been assessed for different renewable energy sources including wind on-
shore, wind offshore, utility-scale and rooftop solar PV by applying the temporally and spatially re-
solved simulation models of the open-source python packages GLAES6 (Geospatial Land Eligibility for
Energy Systems) and RESKit7 (Renewable Energy Simulation Toolkit) [8]. These models have been used
and improved throughout recent studies to assess the future European wind onshore and offshore
potential [9]–[11] as well as a wind energy potential analysis of Argentina’s Patagonian area [12]. The
renewable modelling framework provides for a regional context based on global data sets for land
eligibility and weather data depending on a technology selection, maximum RES potentials (onshore/
offshore wind; rooftop/open-field PV), generation time series for each renewable group, and depend-
ing on cost projections a cost assessment (e.g. LCOE).
As the first step, the land eligibility analysis evaluates the amount and distribution of land which is
eligible for renewable energy sources based on a comprehensive set of exclusion factors and con-
straints informed from the land eligibility literature review. These reflect the most common (socio-
political, physical, conservation pseudo-economic) constraints for placement of wind turbines and PV
modules commonly considered in renewable potential studies. Once the distinction is made between
available and excluded areas, the placement algorithm identifies individual turbine/PV module loca-
tions within the eligible areas followed by hourly simulation of generation profiles. Table 3 provides an
overview of exclusion factors applied through this analysis for different renewable technologies.

Table 3: Underlying assumptions and parameter choices for modelling of wind and solar potential

 Technol- Aspect Description Assumption Source
 ogy and param-
 eter choice
 (exclusion
 limits)
 Wind on- Regional 500m buffer distance from regional £ 500 m Heuser et al. (2019)
 shore boundaries boundaries excluded [12]
 Primary roads 500m buffer distance from primary £ 500 m Heuser et al. (2019)
 roads excluded [12]
 Railways 500m buffer distance from railways ex- £ 500 m Heuser et al. (2019)
 cluded [12]
 Waterways 150m buffer distance from waterways £ 150 m Heuser et al. (2019)
 (Rivers) excluded [12]
 Airports 5000m buffer distance from airports £ 5000 m Ryberg (2019),
 excluded Ryberg et al. (2020),
 Ryberg et al. (2019),
 Heuser et al. (2019)
 [8]–[10], [12]
 Urban settle- 1000m buffer distance from urban £ 1000 m Heuser et al. (2019)
 ments settlements excluded [12]

6 Find more information on https://github.com/FZJ-IEK3-VSA/glaes
7 Find more information on https://github.com/FZJ-IEK3-VSA/RESKit

Technical Annex - Climate Analytics and Solutions for Our Climate (2021). Employment opportunities from a coal-to-
renewables transition in South Korea
 10
Woodlands 300m buffer distance from woodlands £ 300 m Heuser et al. (2019)
 (tree cover, broadleaved, needle [12]
 leaved, mixed leaf type) excluded
 Water bodies 1000m buffer distance from water £ 1000 m Heuser et al. (2019)
 bodies excluded [12]
 Protected ar- 1000m buffer distance from protected £ 1000 m Heuser et al. (2019)
 eas parks, monuments, reserves, and wil- [12]
 dernesses excluded
 Bird pro- 1500m buffer distance from protected £ 1500 m Heuser et al. (2019)
 tected areas habitats and bird areas excluded [12]
 Elevation Terrain elevation above 1500 m ex- ³ 1500 m Heuser et al. (2019)
 cluded. [12]
 Terrain Slope Areas with a terrain slope angle above ³ 17° Ryberg (2019),
 17° excluded. Ryberg et al. (2020),
 Ryberg et al. (2019)
 [8]–[10]
 Wind off- Water depth Water depths greater than the maxi- ³ 200 m RE White paper
 shore mum (200m) excluded translation
 Distance to 5000 m buffer distance from shore ex- £ 5000 m Own assumption
 shore cluded. based on regional
 aspects and ranges
 given in literature
 [11], [13]
 Protected ar- 3000 m buffer distance from protected £ 3000 m Caglayan et al.
 eas areas excluded (2019) [11]
 Bird pro- 5000 m buffer distance from bird pro- £ 5000 m Caglayan et al.
 tected areas tected areas excluded (2019) [11]
 Shipping No data available No exclusion
 routes applied
 Open-field Primary roads 50m buffer distance from primary £ 50 m own assumption
 PV roads included
 Railways 50m buffer distance from railways in- £ 50 m own assumption
 cluded
 Airports 0m buffer distance from airports ex- £0m own assumption
 cluded based on Ryberg
 (2019) [8]
 Urban settle- 500m buffer distance from urban area £ 500 m own assumption
 ments excluded
 Woodlands 0m buffer distance from woodlands £0m own assumption
 (tree cover, broadleaved, needle
 leaved, mixed leaf type) excluded
 Water bodies 0m buffer distance from water bodies £0m own assumption
 excluded
 Protected ar- 0m buffer distance from protected £0m Own assumption
 eas parks, monuments, reserves, and wil-
 dernesses excluded
 Agricultural 0m buffer distance from agriculture £0m own assumption
 areas lands (cropland_rainfed, based on Ryberg
 cropland_rain- (2019) [8]
 fed_tree_or_shrub_cover,cropland_ir-
 rigated, mosaic_cropland, mosaic_nat-
 ural_vegetation) excluded

 Elevation Terrain elevation higher than 1750m ³ 1750 m Ryberg (2019) [8]
 excluded

Technical Annex - Climate Analytics and Solutions for Our Climate (2021). Employment opportunities from a coal-to-
renewables transition in South Korea
 11
Slope: Total Areas with a terrain slope angle above ³ 10° Ryberg (2019) [8]
 10° excluded.
 Slope: North- Areas with a north-facing slope angle ³ 3° Ryberg (2019) [8]
 ward above 3° excluded.
 Rooftop PV Population Only areas with a non-zero population Ryberg (2019) [8]
 density density taken into account

Table 4 provides an overview of assumptions made in this work regarding the baseline turbine design,
which is meant to reflect the typical turbine configuration in 2020 based on the study conducted in
IRENA (2019) [14]. The current range of costs for wind turbines are based on the global average values
given in IRENA (2019, 2020) [14], [15]. Expected reduction in costs of wind turbines over 2030 time
horizon have been obtained from IRENA (2019) [14]. The functions implemented in RESKit then derive
corresponding scaling factors based on the given baseline turbine when different assumptions are
made with respect to the turbine configuration for the region of interest and considered time horizon.
In this study, turbine design parameters have been finally selected based on a sensitivity study, which
is described in the following section.

Table 4: Underlying assumptions and parameter choices: baseline turbine technical design and economic parameters

 Technol- Aspect Assumption and pa- Source
 ogy rameter choice
 Wind on- Hub height 101m BWE (2021) [16] and https://en.wind-tur-
 shore bine-models.com/turbines/1719-ge-gen-
 eral-electric-ge-4.8-158-cypress
 Rotor diameter 158m IRENA (2019) [14]
 Capacity 4.8MW IRENA (2019) [14]
 Specific power 245 W m-2 IRENA (2019) [14]
 Capital Cost (2020) 1108 (Low) – 1473 (me- IRENA (2019,2020) [14], [15]
 dium) 2019 USD/kW
 Capital Cost (2030) 800 (Low) – 1075 (me- IRENA (2019) [14]
 dium) 2019 USD/kW
 Annual operating cost 2% capex IRENA (2020) [15]
 Economic lifetime 20 years https://www.nrel.gov/analysis/tech-foot-
 print.html
 Wind off- Hub height 120m Wang et al. (2020), Onea & Rusu (2018)
 shore [17], [18]
 Rotor diameter 164m IRENA (2019) [14]
 Capacity 10MW IRENA (2019) [14]
 Specific power 473 W m-2 IRENA (2019) [14]
 Foundation type monopile
 Capital Cost (2020) 2890 (Low) – 3800 (me- IRENA (2019, 2020) [14], [15]
 dium) 2019 USD/kW
 Capital Cost (2030) 1700 (Low) – 3200 (me- IRENA (2019) [14]
 dium) 2019 USD/kW
 Annual operating cost 2% capex IRENA (2020) [15]
 Economic lifetime 20 years https://www.nrel.gov/analysis/tech-foot-
 print.html

Technical Annex - Climate Analytics and Solutions for Our Climate (2021). Employment opportunities from a coal-to-
renewables transition in South Korea
 12
Table 5 provides the characteristics of the PV module selected in this study for open-field and roof-top
applications as well as the economic assumptions. The current range of costs for photovoltaic technol-
ogy is based on the global average values given in IRENA (2019, 2020) [14], [15]. Expected reduction in
costs over 2030 time horizon have been derived from IRENA (2019, 2020) [14].
Table 5: Underlying assumptions and parameter choices: selected PV module characteristics for open-field and roof-top ap-
plications

 Technol- Aspect Assumption and parameter Source
 ogy choice
 PV open- Module name Winaico WSx-240P6 Ryberg (2019) [8]
 field
 Pmp 240.4 W Ryberg (2019) [8]
 Area 1.663 m2 Ryberg (2019) [8]
 Efficiency 24% Ryberg (2019) [8]
 Technology Polycrystalline Ryberg (2019) [8]
 Coverage 30 m2land kWp-1 Own assumption based on the
 insights from Ryberg (2019) [8]
 Type (fixed tilt/single Fixed-tilt
 axis tracking)
 Capital Cost (2020) 714 (Low) – 995 (medium) 2019 IRENA (2020) [15]
 USD/kWp
 Capital Cost (2030) 340 (Low) – 587 (medium) 2019 IRENA (2019) [19]
 USD/kWp
 Operating Cost 1.7% capex Ryberg (2019) [8]
 Economic lifetime 25 years https://www.nrel.gov/analy-
 sis/tech-footprint.html
 PV Rooftop Module name LG 360Q1C-A5 Ryberg (2019) [8]
 Pmp 379.4 W Ryberg (2019) [8]
 Area 1.673 m2 Ryberg (2019) [8]
 Efficiency 30% Ryberg (2019) [8]
 Technology Mono-crystalline Ryberg (2019) [8]
 Coverage 9.1 m2land kWp-1 Own assumption based on the
 insights from Ryberg (2019) [8]
 Type (fixed tilt/single Fixed-tilt
 axis tracking
 Capital Cost8 (2020) 821 (Low) – 1144 (medium) 2019 IRENA (2020) [15]
 USD/kWp
 Capital Cost (2030) 391 (Low) – 675 (medium) 2019 IRENA (2019) [19]
 USD/kWp
 Operating Cost 1.7% capex IRENA (2020) [15]
 Economic lifetime 25 years https://www.nrel.gov/analy-
 sis/tech-footprint.html

8 Costs for PV rooftop are calculated based on the ratio between PV utility and rooftop costs given both for South Korea in
 2019 according to [15]

Technical Annex - Climate Analytics and Solutions for Our Climate (2021). Employment opportunities from a coal-to-
renewables transition in South Korea
 13
SENSTIVITY ANALYSIS ON RENEWABLE ENERGY MODELLING - OPTIMAL TURBINE
DESIGN SELECTION

We perform a sensitivity analysis by varying the turbine technical design parameters over a given range
to derive the cost-optimal level for hub height and rotor diameter which lead to the minimum LCOE.
Table 6 provides the assumed range of turbine design parameters as well as the selected cost-optimal
level obtained from the sensitivity analysis.

Table 6: Underlying assumptions and parameter choices: range of assumptions and selected optimal level in bold

 Technology Aspect Assumption and parame- Source
 ter choice (optimal level)
 Wind on- Hub height 80m, 88m, 99m, 101m, Own assumptions based on the typical
 shore 121m, 149m ranges and the optimal value derived
 from sensitivity analysis
 Rotor diameters 117m, 125m, 136m, 141m, Same as above
 158m
 Capacity 1MW, 2MW, 2.4MW, 3MW, Same as above
 3.4MW, 4.2MW, 4.8MW
 Wind off- Hub height 105m, 110m, 120m, 130m, Same as above
 shore 140m, 150m
 Rotor diameter 180m, 200m Same as above
 Capacity 3MW, 5MW, 7MW, 9MW, Same a above
 11MW, 13MW
 Foundation type Fixed foundation (
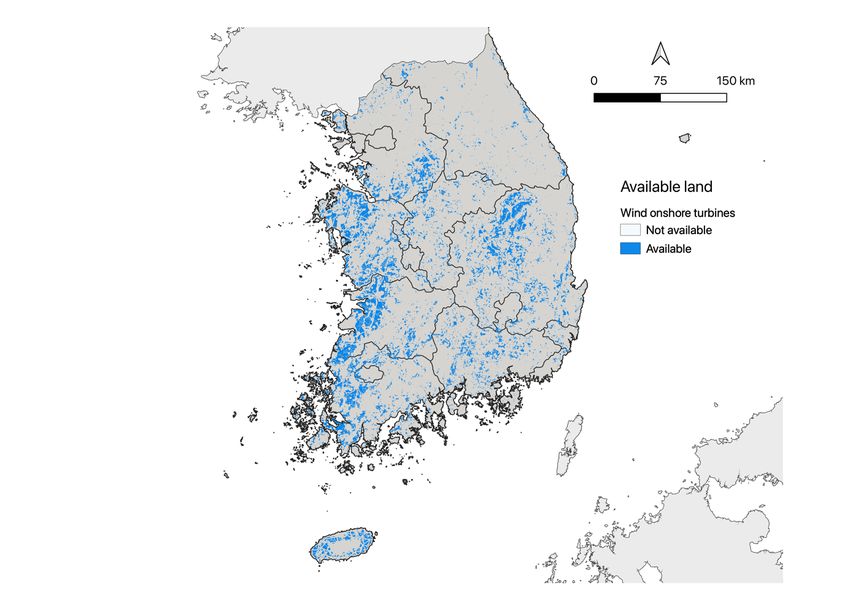
Wind onshore turbines

Figure 1 Available land and levelised cost of electricity (LCOE) for onshore wind turbines. The size of the individual turbine
locations is enlarged to increase visibility.

Technical Annex - Climate Analytics and Solutions for Our Climate (2021). Employment opportunities from a coal-to-
renewables transition in South Korea
 15
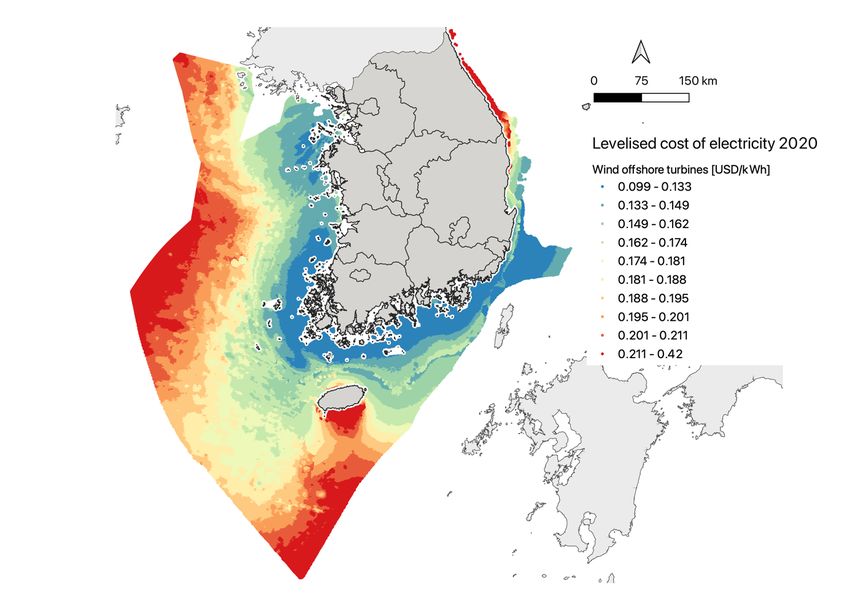
Wind offshore turbines

Figure 2 Available ocean area and levelised cost of electricity (LCOE) for offshore wind turbines. The size of the individual
turbine locations is enlarged to increase visibility.

Technical Annex - Climate Analytics and Solutions for Our Climate (2021). Employment opportunities from a coal-to-
renewables transition in South Korea
 16
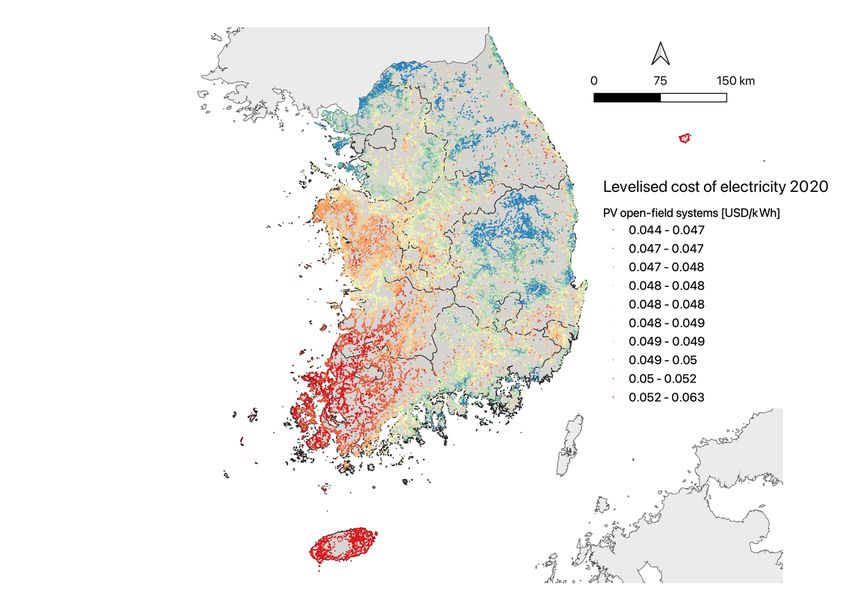
PV open-field systems

Figure 3 Available land and levelised cost of electricity (LCOE) for PV open-field systems. The size of the individual parks is
enlarged to increase visibility.

Technical Annex - Climate Analytics and Solutions for Our Climate (2021). Employment opportunities from a coal-to-
renewables transition in South Korea
 17
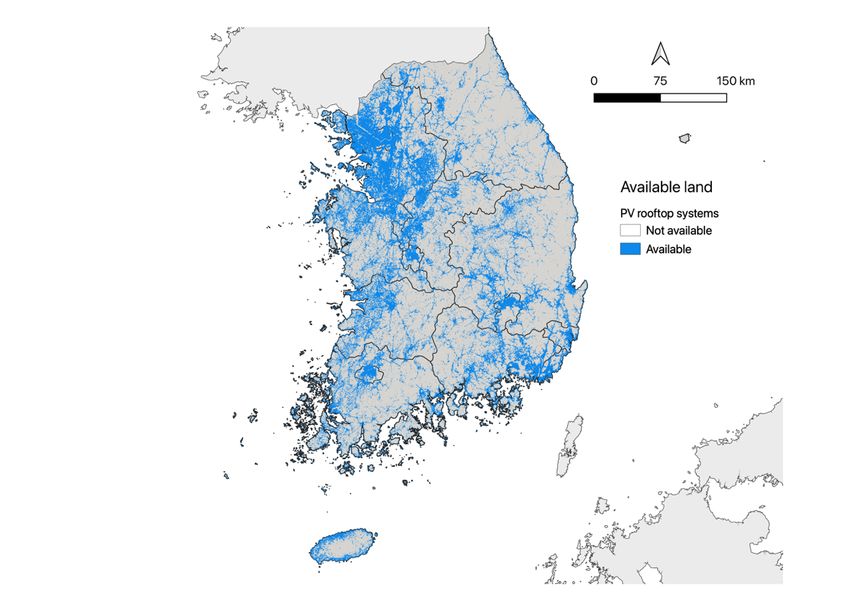
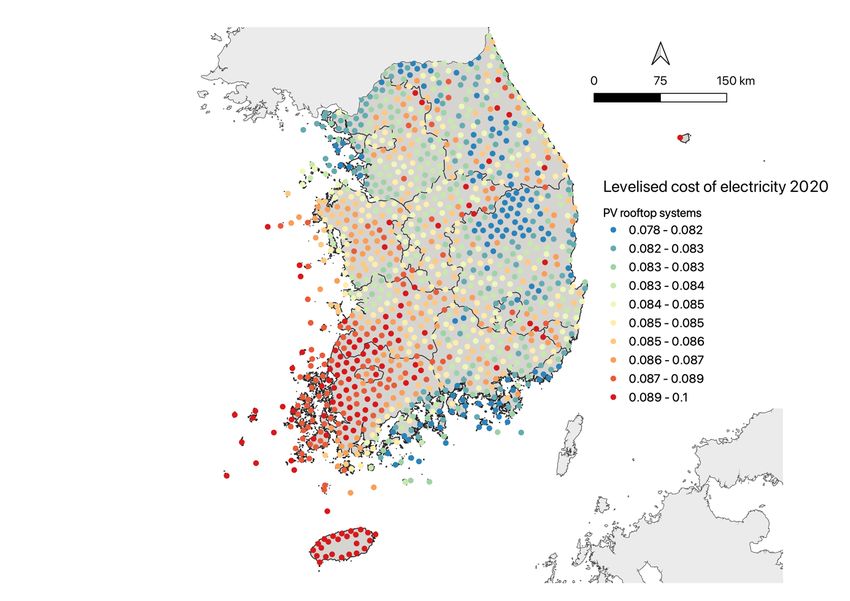
PV rooftop systems

Figure 4 Available land and levelised cost of electricity (LCOE) for PV rooftop systems. The indicated spots in the lower figure
only indicate the geographical distribution of the cost and do not represent individual panel distributions which are spread
across residential rooftops.

Technical Annex - Climate Analytics and Solutions for Our Climate (2021). Employment opportunities from a coal-to-
renewables transition in South Korea
 18
ENERGY SYSTEM MODELLING WITH PYPSA

Overview

In both scenarios (CPol and CtR) a techno-economic electricity system model based on the energy sys-
tem modelling framework PyPSA (Python for Power System Analysis) (see [20]) determines the cost-
optimal renewable capacity, as well as the storage infrastructure, for replacing the coal plant units
which are retired. PyPSA is run as a recursive-dynamic partial equilibrium model with a one-year hori-
zon and an hourly resolution. For each given year an optimisation problem chooses capacity additions
and a power generation schedule, which minimises the total system costs composed of capital, oper-
ational and fuel costs:
 1. Capacity additions of the wind and solar potentials, as well as new capacity of a short-term
 and a long-term storage technology are chosen.
 2. The renewable power generation is combined with a power generation schedule for the coal,
 nuclear, gas, pumped hydro storage and other technologies which settles electricity demand
 in each hour of the year including a reserve margin to cover stability concerns [21].
 3. In the CtR scenario, additionally, the CO2 emissions must be below the South Korean part of
 the electricity system emissions pathway of the IEA B2DS scenario.
 4. In the CPol scenario, the renewable capacity additions must add up to the capacity of the re-
 newable category.

The existing power generation capacity for technologies other than solar and wind are not available
for retirement or extension, instead they generally follow the development in the 9th Basic Plan (see
also the section “Scenario description”). For coal capacity, PyPSA defines the added and retired capac-
ity over time depending on the respective scenario based on i) the information given in the Paris agree-
ment compatible unit-level-phase out scenarios (CtR) ii) the phase out plan for coal is given by the coal
plans from the 9th Basic Plan which foresees a slower phase out of coal as well as a partial transfor-
mation of coal power plants to natural gas power plants (CPol). For combined-cycle gas turbine capac-
ity, the additions of the 9th Basic Plan are followed, except that in the CtR scenario, no retired coal
plants are converted to natural gas plants. For the other generation technologies, i.e. nuclear reactors,
pumped hydro storage, waste incineration and oil plants (grouped together as Other), the governmen-
tal capacity plan is adopted.

The integration of weather-dependent renewable energy generation depends on the availability of
flexibility from dispatchable thermal generation technologies (gas turbines) and more importantly
storage systems for smoothing short-term misbalances, like battery storage and pumped hydro stor-
age, with an energy-to-power ratio of a few hours (1-6 hours), as well as long-term storage to move
energy between weeks and seasons. The model can control the existing pumped hydro storage and
additionally install utility-scale lithium-ion based batteries and home-batteries, as well as a hydrogen
storage solution, consisting of an electrolyser, a pipe storage and a fuel cell.

The transmission and distribution system is not represented in the model due to limited data availa-
bility of the current capacity and topology, but also importantly, since the concrete investment needs
into the distribution system depend strongly on the electrification rate of mobility and heating, which
were outside of the scope of this work.

The individual components and their mathematical representation in the model are described in detail
in the following subsections.

Technical Annex - Climate Analytics and Solutions for Our Climate (2021). Employment opportunities from a coal-to-
renewables transition in South Korea
 19
Optimisation formulation in PyPSA

The optimisation model for determining the necessary renewable generation capacity and storage
configuration to replace coal is run separately for each year between 2020 and 2034, while the thermal
generation capacity, as well as demand time-series changes in each year.

Table 7: Nomenclature for PyPSA

 Variable Units Definition
 Region labels
 Thermal generator fuel labels (e.g. gas, coal, etc.)
 Storage energy technology labels (e.g. battery, hydrogen, etc.)
 Renewable generation label (open-field PV, rooftop PV, onshore
 wind, offshore wind)
 Snapshot / time point labels
 Year labels
 ! " / ℎ#$ " -equivalent emissions of fuel type
 !,#,& MW Dispatch of thermal generator type at time in year
 !,& MW Power capacity of generator in year
 ',(,#,& MW Dispatch of renewable generator in region of type at time in
 year
 ',(,& MW Installed capacity of renewable generator in region of type in
 year
 ‾',( MW Installable potential of renewable generation in region of type
 ‾',(,# MW/MW Power availability per unit of generator capacity
 ! )* / #$ Efficiency of fuel type
 +
 ',( €/MW Generator capital (fixed) cost
 +
 ',( €/MW Renewable generator operating (variable) cost
 ,
 ! €/MWh Thermal Generator operating (variable) cost
 ℎ-,#,& MW Dispatch of storage with carrier at time in year
 -,& MW Power capacity of storage in year
 -,#,& MWh Storage state of charge (energy level)
 -,& MWh Storage energy capacity
 -$ €/MW Storage power capacity cost
 ̂-$ €/MWh Storage energy capacity cost
 #,& MW Electrical load at time in year
 ν Reserve margin

Technical Annex - Climate Analytics and Solutions for Our Climate (2021). Employment opportunities from a coal-to-
renewables transition in South Korea
 20
Objective function of PyPSA

PyPSA minimises total electricity system costs, which include the variable and fixed costs of generation,
storage and transmission, given technical and physical constraints.

The objective function is given by;

 +
 [ @ ',( ⋅ ',(,& + @ -$ ⋅ -,& + ̂-$ ⋅ -,&
 .!,#,$ ,/%,$ ,0%,$ ,&,',$ ,+!,#,',$ ,$%,',$
 ',+ -

 + ,
 + @ ',( ⋅ ',(,#,& + @ ! ⋅ !,#,& ]
 ',(,# !,#

It consists of the renewable generator capacity ',(,& in each region for technology and their an-
 +
nuitised fixed costs per capacity ',( , the storage unit power capacity -,& and store energy capacity
 -,& for storage technology and their associated fixed costs -- and ̂'- ,- , the dispatch ',(,#,& of the
 +
renewable technology at time and the associated variable costs ',( , the dispatch !,#,& of the
 ,
thermal generation for fuel at time t and the associated variable costs ! . The optimisation is run
over multiple time periods representing different weather and demand conditions. The investment
costs are annuitised for the total period (8760 hours of a full year).
Table 8: Cost and technology assumptions for thermal generators

 Technology Variable O&M Fuel Efficiency CO2 intensity
 Euro / MWhel Euro / MWhth kg CO2 / MWhth
 Coal 3.5 a 8.15 b 0.33 a 0.34 c
 Nuclear 3.5 a 2.6 a 0.33 a
 CCGT 4.4 a 20.1 b 0.47 c 0.2 c
 Other (Oil/Waste) 2.1 (25.9) d,e 7 (-) d,e 0.3 (0.23) d,e 0.4 c
a.
 [22]. b.[23]. c. [24]. d.[25]. e. In our modelling Other was attributed to Biomass instead of Waste/Oil. As this is only a very
 minor share of the overall capacity, the influence on results is negligible. However, in parentheses we added a sug-
 gested alternative parameter choice.

Constraints implemented in PyPSA

Generation

The dispatch of thermal generators !,#,& is constrained by their capacity !,&

 0 ≤ !,#,& ≤ !,& ∀ , (1)

The capacity for all fuel types is fixed exogenously for the optimisation. They are based on the 9th Basic
Plan, except for coal and gas in the CtR scenario as described in the overview subsection and the Sce-
nario description.

The dispatch of renewable generation in each region n ',(,#,& is also constrained by their capacity
 ',(,& , but additionally by their time-dependent availabilities ‾',(,# , which are given per unit of the
capacity ',(,& :

 0 ≤ ',(,#,& ≤ ‾',(,# ⋅ ',(,& ∀ , , , (2)

Technical Annex - Climate Analytics and Solutions for Our Climate (2021). Employment opportunities from a coal-to-
renewables transition in South Korea
 21
For variable renewable generators such as wind and solar, ‾',+,# represents the weather-dependent
power availability.
The renewable power capacity ',(,& is optimised up to a maximum installable potential ‾',( and can
only be increased from year to year:

 ',(,&23 ≤ ',(,& ≤ ‾',( ∀ , , (3)

Renewable power availability and potential are inputs from the renewable potential and generation
assessment described in the previous section and are determined separately for each region n.

In the CPol scenario an additional constraint ensures that the total renewable generation capacity fol-
low the pathway of the 9th Basic Plan, &4#$ :

 ∑',( ',(,& = &4#$ ∀ (4)

Storage

The dispatch of storage units ℎ-,#,& , whose energy carriers are labelled by , is constrained by a similar
equation to that for generators:

 − -,& ≤ ℎ-,#,& ≤ -,& ∀ , (5)

except that dispatch ℎ-,#,& can be both positive when discharging into the grid and negative when ab-
sorbing power from the grid. The power capacity -,& can also be optimised within installable poten-
tials.

The energy levels -,#,& of all storage units have to be consistent between all hours and are limited by
the storage energy capacity -,&
 5 23 2
 -,#,& = -,#23,& + -,5 Mℎ-,#,& N − -,2 Mℎ-,#,& N

 0 ≤ -,#,& ≤ -,& ∀ , (6)

Positive and negative parts of a value are denoted as [⋅]5 = (⋅ ,0), [⋅]2 = − (⋅ ,0). The storage
units have a charging efficiency -,5 and a discharging efficiency -,2 . The energy level is assumed to
be cyclic, i.e. -,#67,& = -,#68,& .

The energy capacity -,& can also be optimised within installable potentials, which have not been con-
strained for this study.

There are two types of storage technology: Lithium-ion batteries provide high-efficiency flexibility on
daily time-scales while hydrogen conversion, hydrogen pipe storage and re-electrification in fuel cells
provides low-efficiency seasonal flexibility.

To assess regional storage capacity expansion without explicitly modelling the transmission and distri-
bution grids, the power flow topology for renewable generation is represented as in Figure 5. Battery
(small) represents consumer lithium-ion home batteries, which can only be charged from PV (rooftop)
generation. Battery (utility) is preferably charged with renewable generation from the same region,
while energy from remote renewable capacity incurs 2% transmission loss. Electricity used for elec-
trolysis in the hydrogen storage is exclusively generated by wind turbines or solar PV.

Technical Annex - Climate Analytics and Solutions for Our Climate (2021). Employment opportunities from a coal-to-
renewables transition in South Korea
 22
Figure 5: Power flow topology in the model. Boxes represent technologies generating, converting or consuming power and
arrows show the studied energy flows and their directions.

Table 9: Cost and technology assumptions for storage options

 Technology CAPEX a Fixed O&M Lifetime Efficiency
 2020 2025 2030 % of CAPEX / year year
 H2 electrolyser b 600 575 550 5 25 0.64 – 0.66 c
 H2 pipe storage d 7 7 7 1 30
 H2 fuel cell b 1300 1200 1100 5 10 0.5
 Battery storage b 232 187 142 - 20 – 25 c
 Battery inverter b 270 215 160 0.2 – 0.34 c 10 0.95 – 0.96 c
a.CAPEX in Euro/kWe for power capacity and in Euro/kWh for storage capacity. [25]. Lower value in 2020 and higher
 b. c.

value in 2030. d. Own considerations based on techno-economic data for natural gas pipelines, [26] and hydrogen compres-
sors [27], as well as on information of existing pipe storage systems, [28] and [29].

 " emissions

 " emissions are limited by those of a power sector emissions pathway & , implemented using the
specific emissions ! in " / ℎ#$ of the fuel and the efficiency ! of the generator:
 3
 ∑!,# !,#,& ⋅ ! ≤ & (7)
 9&

Technical Annex - Climate Analytics and Solutions for Our Climate (2021). Employment opportunities from a coal-to-
renewables transition in South Korea
 23
The reference emissions pathway & is derived by harmonising the emissions due to fuel combustion
for electricity generation from the downscaled B2DS pathway. A similar harmonisation method (har-
monising to latest historical (2019) CO2 emissions from fuel combustion (IEA), while conserving the
total allowed emissions) is applied to all fuels in addition to coal to ensure consistency with previous
work [30].

Electricity demand

The (inelastic) electricity demand #,& must be met at each time by either thermal generators, re-
newable generation or storage

 ∑',( ',(,#,& + ∑! !,#,& + ∑- ℎ-,#,& = #,& ∀ (8).

The hourly electricity demand curve is derived by concatenating hourly load profiles for a day in each
season scaled according to daily peak demand published at EPSIS. The hourly load profiles have been
modelled by Kim et al. 2020 [21].

The electricity demand curve is rescaled to match the total electricity demand as well as peak demand
forecast assumptions in demand scenario 1 of the 9th Basic Plan for Electricity Supply and Demand.

Reserve margin

A reserve margin of an additional increasing ratio 9 of the electricity demand #,& must be potentially
met as a safety precaution at each time by either thermal generators, renewable generation or stor-
age:
 +)-)+:)
 ∑',( ‾',(,# ⋅ ',(,& + ∑! !,& + ∑- -,#,& ≥ (1 + ) #,& ∀ , (9)

 +)-)+:) +)-)+:)
 -,#,& ≤ -,& -,#,& ≤ -,5 -,#,& ∀ , , (10)

 +)-)+:)
Where the additional variable -,#,& prevents an empty storage from contributing to fulfilling the
reserve demand.

9 The reserve margin increases as in the 9th Basic plan from 17% until 2024, 18% until 2028 to 22%.

Technical Annex - Climate Analytics and Solutions for Our Climate (2021). Employment opportunities from a coal-to-
renewables transition in South Korea
 24
Estimating the employment impacts of an accelerated coal phase out

OVERVIEW ON BASIC EMPLOYMENT FACTOR APPROACH
We apply the general approach proposed by Rutovitz and co-authors [5] which has for example been
used in the Energy [R]evolution Report by Greenpeace International, Global Wind Energy Council and
Solar Power Europe, assessing job opportunities from energy transition round the world [31]. The basic
methodology proposes to use employment factors to assess the employment impacts of an energy
transition. The general approach has been applied and extended more recently. Ram et al. (2020) ex-
plicitly include jobs in transmission and also in decommissioning of power plants [6]. In the book on
achieving the Paris Agreement Climate Goals [32], Dominish et al. extend the approach by adding more
detailed occupational dimensions [33]. Apart from global analyses, the approach has also been applied
for specific countries with country-specific employment factors (e.g. Australia [34] or South Africa
[35]). Advantages of the approach are that assumptions can be made very transparent and impact
chains are clearly laid out. Moreover, it is very flexible as the employment factors can be adjusted
based on local data if available.

The approach estimates direct jobs associated with electricity generation and includes jobs in manu-
facturing, construction & installation, operations & maintenance. Moreover, jobs in fuel supply, trans-
mission and decommissioning can be added if relevant.

The underlying basic (simplified) rational is illustrated in Figure 6. Newly installed capacity for electric-
ity generation in a given year create jobs in manufacturing of technology parts (to the degree these
are produced with the country as defined by the local share, these are local jobs) and jobs in construc-
tion and installation of these added capacity over the construction period. The total capacity that is in
place and running in a given year is contributing to jobs in operation and maintenance over the lifetime
of the respective installation. To reflect ‘learning’, e.g. improvements in technology efficiency and ma-
turing production techniques leading to increasing the efficiency, the employment factor can be ad-
justed over time with a so-called decline factor.

For the calculation of local employment in manufacturing, the share of technology parts that is manu-
factured within the country or region of interest has to be defined. If relevant to a country-specific
context, local share assumptions can also be applied to other sectors if – for example – expertise on
installation and construction or operation and maintenance cannot be covered by the country and
experts from abroad are involved.

The calculation is conducted for each relevant technology for electricity generation with technology-
specific employment factors and assumptions on lifetime and construction duration.

Figure 6 General overview on methodology. Source: [34]

Technical Annex - Climate Analytics and Solutions for Our Climate (2021). Employment opportunities from a coal-to-
renewables transition in South Korea
 25
As Ram et al. (2020) and Rutovitz et al. (2015) estimate employment impacts globally, they apply re-
gional employment multipliers to adjust the ‘base’ employment factors for each technology and job
activity with regional adjustment factors to account for differences in productivity between regions.

Note that the employment factor approach typically focuses on direct employment only, and does not
quantify indirect employment further down the supply chain nor employment induced by the spending
of wages throughout the economy. Still, a comparison of jobs for the different technologies over time
can yield an indicative picture of the overall developments and employment effects for the analysed
scenarios. However, the estimates should not be interpreted as a projection of net employment ef-
fects.

APPLYING OF THE EMPLOYMENT FACTOR APPROACH IN THIS STUDY

Focus of this study

For our analysis, we focus on estimating the employment impacts of phasing out South Korean coal
power plants in line with the Paris Agreement temperature target and replacing these coal power
plants with renewable energy installations of solar PV (rooftop and utility-scale installations) as well as
wind (onshore and offshore installations). As explained above, we build on previous work10 on Paris
Agreement-compatible unit-level decommissioning schedules for South Korea.

Note that while the energy modelling takes into account the entire energy mix in terms of existing
capacity for all power generation technologies, we do not assess the employment impacts for transi-
tioning the whole South Korean energy system to 100% renewable energy. More specifically, the anal-
ysis focuses on the employment implications of replacing coal-fired power capacity with solar and
wind renewable energy capacity as well as storage in South Korea. We do not assess the employment
related to other renewable energy technologies such as hydro, marine, biomass or waste capacity.11 In
addition, we compare the employment effects of replacing coal-fired power capacity with solar and
wind renewable energy capacity to a ‘current policy’ scenario derived based on coal decommissioning
schedule from the 9th Basic Plan For Electricity Supply & Demand. This ‘current policy’ scenario envis-
ages the conversion of selected coal-fired power plants to natural gas-fired power plants while it also
builds up renewable energy capacity. Correspondingly, we only assess employment related to the trans-
formation of coal power plants to natural gas and disregard employment in other natural gas-fired
power plants. We limit our analysis to showing results until 2030, as, first, this is the timeline relevant
for the Paris Agreement-compatible phase out date in 2029 and second, the uncertainty increases the
further into the future the analysis is conducted.

Extensions of the basic approach developed in this study
While we build on the basic employment factor approach suggested by Rutovitz et al. (2015) [5] and
updated and extended by Ram et al. (2020) [6], we extend this basic approach in three ways.

First, whenever suitable local data is available, we derive South Korea-specific employment factors and
parameters. This is explained in detail below.

10 In a Climate Analytics study from 2020 a coal phase out pathway for South Korea under the Paris Agreement was derived
 [43]. In another study earlier this year, unit-level-phase out schedules for coal have been analysed assessing the impacts
 on air pollution and health [2].
11 We do however take the current energy mix in terms of existing capacity for all power generation technologies into account

 for modelling the amount of solar and wind capacity to replace coal for the given energy system structure as described
 above.

Technical Annex - Climate Analytics and Solutions for Our Climate (2021). Employment opportunities from a coal-to-
renewables transition in South Korea
 26
Second, we assess the employment impacts of different coal phase out scenarios based on unit-level
specific phase out schedules that are compatible with the Paris Agreement and compare the results to
the ‘current policy’ scenario reflecting the current policy plan as represented by the 9th Basic Plan. For
the analysis of coal phase out in South Korea, data on historical installed capacity as well as future
capacity scenarios are based on results from the PyPSA model on the technology mix and storage
needs using inputs from the unit-level coal phase out scheduled as well as the modelling of RE poten-
tials in South Korea (see section 3.2). Based on this, the data on (future) newly installed capacity as
well as total already installed capacity for the relevant technologies are derived for the employment
analysis.

Third, we exploit spatially explicit data and modelling results to provide employment estimates on the
subnational level for South Korea. The underlying methodology for this subnational disaggregation is
explained in more detail below.

EXTENDING THE GENERAL APPROACH TO THE SUBNATIONAL LEVEL

While Ram et al. (2020) [6] and Rutovitz et al. (2015) [4] typically provide aggregated employment
estimates on the national level, we extend the analysis to obtain estimates for the subnational level
such as on province levels. For this, we make use of the spatially explicit information of the coal power
plant locations as well as of the spatially explicit modelling of the potentials for solar and wind in South
Korea described above. This is explained in more detail below.

Assigning coal- and natural gas-related jobs to the subnational level
We make use of information on longitude and latitude of coal power plant locations as provided by
the Global Coal Plant Tracker [4] to assign the respective direct employment related to the coal power
plant, such as construction and installation, operation and maintenance as well as decommissioning
jobs to the respective district the coal power plant is located in. For jobs related to coal where the
location of where the work is carried out is not necessarily linked to location of the power plant itself,
such as manufacturing of coal power plant related technology parts, we report those separately with-
out assigning them to a specific region – while also being included in the aggregated national-level
estimates.
With respect to natural gas, we only consider those natural gas power plants that are planned to be
transformed from coal- to natural gas-power plants according to the 9th Basic Plan for Electricity De-
mand and Supply (in the Current Policies scenario), and do not account for pre-existing or planned
natural gas power plants other than those, as our analysis specifically focuses on the employment im-
pacts of phasing out coal. As a consequence, in our analysis employment in natural gas only plays a
role for the current policy scenario. For the location of the natural gas-power plant that had been
resulting for the transformation of existing coal power plants, we assume that the location of the re-
spective coal power plant as provided by Global Coal Plant Tracker applies also to the natural gas power
plant replacing this coal power plant [4].

Assigning RE-related jobs to the subnational level
The modelling of potentials for solar PV rooftop and open field (utility-scale) as well as for onshore and
offshore wind potentials in South Korea (as described in section 3.2) provides explicit geospatial infor-
mation of where those identified potentials lie in South Korea. Based on this information, we assign
the RE-related jobs that are directly bound to the location to the respective subnational level. These
include jobs in construction and installation, and operation and maintenance of solar and wind, differ-
entiating the locations of the respective sub-technologies (onshore wind and PV rooftop and open

Technical Annex - Climate Analytics and Solutions for Our Climate (2021). Employment opportunities from a coal-to-
renewables transition in South Korea
 27
You can also read