PROPOSED GAS INFRASTRUCTURE EXPANSIONS ARE POOR INVESTMENTS FOR THE REGION-AND THE WORLD - Robert Rozansky - Global Energy Monitor
←
→
Page content transcription
If your browser does not render page correctly, please read the page content below
Asia’s Gas Lock-In

2021
 PROPOSED GAS INFRASTRUCTURE EXPANSIONS ARE
POOR INVESTMENTS FOR THE REGION—AND THE WORLD

                 Robert Rozansky
ASIA’S GAS LOCK-IN
Global AUTHOR
Energy Robert Rozansky is a research analyst at Global Energy
Monitor Monitor.
ABOUT GLOBAL ENERGY MONITOR
Global Energy Monitor (GEM) is a network of researchers EDITING AND PRODUCTION
developing collaborative informational resources on fossil Edited by Ted Nace, Mason Inman, and James Browning.
fuels and alternatives. Current projects include: Design and page layout by David Van Ness. Maps created by
■ Global Coal Plant Tracker Scott Zimmerman. The author would also like to acknowl-
edge the contributions of Lorne Stockman, Gerry Arances,
■ Global Fossil Infrastructure Tracker
Greig Aitken, and Susanne Wong.
■ Europe Gas Tracker
■ Global Gas Plant Tracker
PERMISSION FOR NONCOMMERCIAL USE
■ Global Coal Mine Tracker
This publication may be reproduced in whole or in part and
■ Global Steel Plant Tracker
in any form for educational or nonprofit purposes without
■ Global Wind Power Tracker special permission from the copyright holders, provided
■ Global Solar Power Tracker that acknowledgement of the source is made. No use of this
■ Inside Gas newsletter publication may be made for resale or other commercial
■ CoalWire newsletter purpose without the written permission of the copyright
holders. Copyright © October 2021 by Global Energy Monitor.
■ GEM.wiki
ABOUT THE GLOBAL GAS PLANT TRACKER AND FURTHER RESOURCES
The Global Gas Plant Tracker (GGPT) is under development
GLOBAL FOSSIL INFRASTRUCTURE TRACKER
and set for release in Q4 2021, with a full dataset avail-
The Global Gas Plant Tracker (GGPT) and Global Fossil able on request. The Global Fossil Infrastructure Tracker
Infrastructure Tracker (GFIT) are online databases that iden- (GFIT) provides over 35 summary data tables on oil and gas
tify, map, describe, and categorize gas infrastructure. The pipelines and terminals broken down by region, c ountry,
GGPT tracks gas-fired power plants and the GFIT tracks oil and company; methodology notes; and an interactive
and gas pipelines and liquefied natural gas (LNG) terminals. global map. Summary tables for the Asian gas infrastruc-
Developed by Global Energy Monitor, these trackers use ture analyzed in this report are available here. To obtain
footnoted wiki pages to document each gas project. primary data for either the GGPT or GFIT, contact Ted Nace
(ted.nace@globalenergymonitor.org).
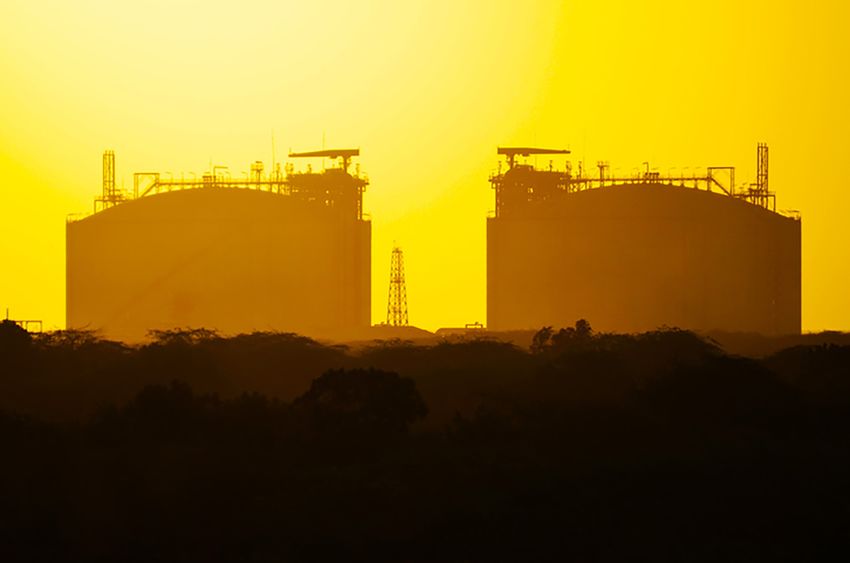
ABOUT THE COVER
The cover photo shows LNG tanks in Hazira, Gujarat, India.
Image from Getty Images, with photo credit to Puneet
Vikram Singh.
GLOBAL ENERGY MONITOR REPORT | OCTOBER 2021 | 2
Global
                                                                                                     Energy
                                                                                                     Monitor

Asia’s Gas Lock-In
PROPOSED GAS INFRASTRUCTURE EXPANSIONS ARE
POOR INVESTMENTS FOR THE REGION—AND THE WORLD

Robert Rozansky

                  EXECUTIVE SUMMARY
                  Plans in Asia to develop hundreds of billions of dollars of new power
                  plants, pipelines, and terminals for imported gas pose a major threat to
                  limiting global warming to 1.5° Celsius. This gas infrastructure in devel-
                  opment threatens to lock in high levels of greenhouse gas emissions and
                  lock out the adoption of energy sources that are cleaner, cheaper, and
                  more secure.

                  This report focuses on gas infrastructure that is proposed and in con-
                  struction in Asia, including power plants, pipelines, and terminals
                  for importing liquefied natural gas (LNG). It includes the following
                  highlights:

                  ■   Across East, South, and Southeast Asia there are plans to build
                      US$379 billion of new gas infrastructure: US$189 billion of gas-fired
                      power plants, US$54 billion of gas pipelines, and US$136 billion of
                      new LNG import and export terminals. This new infrastructure could
                      become stranded assets as the global economy shifts toward clean
                      energy.

                  ■   There are 320 gigawatts (GW) of gas-fired power plants in develop-
                      ment across Asia, which, if built, would nearly double gas power
                      capacity in the region. This expansion would be the size of the entire
                      gas-fired power fleet in Europe and Russia, and it would increase
                      global gas-fired power capacity by one-fifth.

GLOBAL ENERGY MONITOR                                                                 REPORT | OCTOBER 2021 | 3
ASIA’S GAS LOCK-IN
■ Asia is the most important part of the world for a global LNG
industry seeking to expand. There are plans in Asia to develop
452 million tonnes per annum (mtpa) of new LNG import terminal
capacity, which comprises 70% of such global capacity in develop-
ment (Figure ES1). There are more than enough import terminals
in development to absorb the entire global LNG trade of 2020.
■ The expansion could consume a large portion of the world’s carbon
budget. If built and run at full capacity, the LNG import terminals and
gas pipelines in d
evelopment in Asia would enable enough consump-
tion of imported gas to produce 117 gigatonnes of carbon dioxide
equivalent (Gt CO2-eq) over their lifespans. This is a quarter of all
emissions the world can produce while maintaining a good chance of
limiting global warming to 1.5° C.
■ Gas infrastructure is expensive and long-lived. Assets often cost
billions of dollars and operate for decades. If built, many projects
will likely be uncompetitive with renewables even before they are
finished. Gas infrastructure also presents economic risks due to gas
price volatility, security issues, and the potential that it will cease to
be v
iable in an increasingly low-carbon world.
■ Renewables are a cost-effective, reliable alternative to gas in
power generation, especially when combined with storage and
demand-side management. Renewables are also a superior option
for distributed generation, which can increase energy access in
rural parts of the world. Decarbonization of the power sector with
Figure ES1: LNG Import Capacity in Development by Region, June 2021
East Asia includes China with Hong Kong and
Macao, Japan, South Korea, and Taiwan.
Southeast Asia includes Brunei, Cambodia,
Indonesia, Laos, Malaysia, Myanmar, Papua New
Guinea, the Philippines, Singapore, Thailand,
Timor L’este, and Vietnam.
South Asia includes Bangladesh, India, Pakistan,
and Sri Lanka.
MENA refers to the Middle East and North Africa.
Source: Global Energy Monitor. Includes projects in construction and in pre-construction d
evelopment.
GLOBAL ENERGY MONITOR REPORT | OCTOBER 2021 | 4ASIA’S GAS LOCK-IN
renewables would lay the groundwork for clean electrification of
other sectors, including applications that currently use gas such as
residential and commercial heating.
■ Governments have supported the expansion of gas infrastructure in
Asia through public finance institutions. There is a risk that they will
continue to do so. A survey of global public financing shows that pub-
lic institutions provided US$22.4 billion in financing for gas projects
in Asia between 2014 and 2018. Recent announcements by the Asian
Development Bank, World Bank, and others show that these institu-
tions have not yet committed to withdrawing from gas financing, and
remain open to funding midstream infrastructure and power plants.
International public finance signals confidence in project viability that
encourages private sector investment, and redirection of such finance
away from gas would help align both private investment and public
policy with net-zero goals.
INTRODUCTION
With Asian planners increasingly moving away from previously appreciated. Rather than benefiting the
coal to meet the region’s growing energy needs, gas climate, the growth in gas combustion that would
has been widely embraced as the inevitable alterna- result from a massive lock-in of new gas infrastructure
tive on both economic and environmental grounds. would wreak havoc on plans to rein in emissions and
Based on that rationale, new gas infrastructure proj- mitigate some of the worst effects of climate change.
ects, including pipelines, LNG terminals, and gas-fired On economic terms, the ground has also shifted.
power plants, have been rapidly advanced across the The rapidly falling cost of renewable alternatives, in
region, amounting to over US$379 billion for projects particular those accompanied by reliability enhancing
in the construction or pre-construction stages as of components such as battery storage and demand man-
June 2021. Asia is home to nearly three-quarters of all agement, has undermined the status of gas as the most
LNG import capacity in development; it will have a economically favorable option for new power. Falling
tremendous influence on the global gas trade. Increas- solar, wind, and storage costs threaten to make long-
ingly, however, the logic underlying the expansion of term gas projects such as LNG terminals obsolete long
gas is being called into question. According to climate before their normal lifespans. Overall, the combina-
analysts, the assumption that gas is a climate-friendly tion of a better understanding of the climate damage
alternative to coal is seriously misguided, in light of caused by gas and a rapidly changing economic equa-
increasing evidence that the magnitude and signif- tion means that the rationales for Asia’s expansion of
icance of the climate-damaging methane emissions gas infrastructure are no longer supportable.
produced along the gas supply chain are greater than
GLOBAL ENERGY MONITOR REPORT | OCTOBER 2021 | 5ASIA’S GAS LOCK-IN
GAS LOCK-IN: PLANS FOR EXPANDING
POWER PLANTS, PIPELINES, AND TERMINALS
GEM’s surveys of gas infrastructure find that across imported gas is burned—and associated m ethane
East, South, and Southeast Asia there is a massive emissions in the supply chain are evaluated on a
buildout of gas infrastructure in development—i.e. 100-year horizon.3,4 Under the same assumptions,
projects that are proposed or under construction.1 pipelines and terminals in pre-construction phases
GEM finds that there are plans within Asia to build of development could enable 73 Gt CO2-eq. Since
320 GW of new gas-powered generation. This expan- developers will likely abandon some projects in the
sion would be the size of the entire gas-fired power early stages and projects typically do not operate
fleet in Europe and Russia. It would add a fifth to at full capacity, these are upper-bound estimates.
global gas-fired power capacity, and it would nearly Nonetheless, these are staggering figures: the total
double gas power capacity in Asia. GEM has identified of 117 Gt CO2-eq is a quarter of the world’s carbon
over 63,000 kilometers of gas pipelines in develop- budget to maintain a 50% chance of limiting global
ment in Asia, enough to wrap around the Earth one warming to 1.5° C. If associated methane emissions in
and a half times. These additions would increase the the supply change are evaluated on a 20-year horizon,
length of pipelines in the region by roughly 50%, the scale of the impact would be even greater: 144 Gt
and would triple import capacity by pipeline to Asia. CO2-eq, about a third of the carbon budget.
Finally, GEM has catalogued 25 mtpa and 452 mtpa of
new LNG export and import capacity, respectively, in GEM estimates that Asia’s infrastructure plans would
development. Import capacity additions of this scale amount to US$189 billion of investment in new gas-
would allow for over 3 million annual shipments of fired power plants, US$54 billion in gas pipelines, and
LNG by tanker and the reception of more LNG per US$136 billion in LNG import and export terminals.
year than the entire world imported in 2020 (BP 2021, As the global economy shifts toward clean energy,
GIIGNL 2019).2 much of this US$379 billion in new infrastructure
could become stranded assets: projects that cease to
GEM’s data on gas-fired power plants is recorded in be economically viable before the end of their antic-
the Global Gas Plant Tracker. Its data on gas pipelines ipated lifetimes due to changes associated with the
and LNG terminals is recorded in the Global Fossil energy transition. Gas projects could become stranded
Infrastructure Tracker. GEM has catalogued the Asian as a result of economic conditions, such as declining
gas infrastructure analyzed in this report in a set of competitiveness with cheap renewable power, or reg-
summary tables. ulatory conditions, such as new policies to decarbon-
ize the electric grid (Carbon Tracker 2017). Stranded
Once built, gas infrastructure is designed to operate assets represent wasted capital. The premature retire-
for decades. The pipelines and terminals currently ment of gas facilities will harm the public and private
in construction in Asia could import enough gas over institutions that have invested in them, the workforces
their lifetimes to release 43 gigatonnes of CO2 equiv- that are employed by them, and the economies that
alent (Gt CO2-eq), if operated at full capacity and the have grown to rely on them (OCI 2016).
1. GEM’s surveys of gas pipelines, LNG terminals, and gas plants were completed in January 2021, June 2021, and August 2021 respectively.
Methodology and full results may be found at http://Globalenergymonitor.org.
2. Assuming tanker capacities of 175,000 cubic meters LNG.
3. See the methodology section for more details.
4. The lifecycle emissions estimates used in this calculation account for uncaptured venting and fugitive emissions of methane, the primary
component in gas, along the gas supply chain. Methane has a much greater global warming potential evaluated over a 20-year horizon than over
a 100-year horizon.
GLOBAL ENERGY MONITOR REPORT | OCTOBER 2021 | 6ASIA’S GAS LOCK-IN
Table 1 shows investment in projects that are pro- building projects amounting to about US$16 billion,
posed and in construction across East, South, and US$8 billion, and US$7 billion, respectively. Vietnam’s
Southeast Asia. China dominates planned investment, exceptionally large proposed investment is both a
accounting for US$131 billion. Beyond China, the result of anticipated increases in electricity demand
largest gas expansions by investment are planned in and the high level of interest from government and
Vietnam, Indonesia, India, Thailand, Bangladesh, industry in building new gas projects; these figures
South Korea, the Philippines, Japan, Myanmar, may evolve with the upcoming release of a new power
Taiwan, and Pakistan. Of those, India, Thailand, and development plan. Less than 1% of Vietnam’s planned
Indonesia are the countries with the most invest- investments are actually in projects that have reached
ment in infrastructure currently under construction, the construction phase.
Table 1: Planned investment for Gas Infrastructure in Asia (US$ billions)
Power Plants Pipelines Terminals
Country Proposed Construction Proposed Construction Proposed Construction Total
China 41.3 13.7 9.2 10.1 32.5 23.8 130.5
Vietnam 52.8 0 0.2 0 5.4 0.3 58.6
Indonesia 5.4 3.3 2.7 0.8 16.6 2.9 31.8
India 0.7 0 7.6 7.3 5.0 8.9 29.5
Thailand 5.6 5.0 0.5 0.6 6.1 2.1 19.9
Bangladesh 10.4 1.9 1.9 0.3 2.1 0 16.5
South Korea 9.6 1.3 2.0 0 3.2 0 16.1
Philippines 8.6 0.4 0 0 2.9 2.1 14.0
Japan 8.7 0.1 2.8 0.5 0.7 0.3 13.0
Myanmar 5.6 0 2.7 0 1.6 2.5 12.3
Taiwan 5.6 0.5 2.5 0.1 3.0 0 11.7
Pakistan 0 1.4 1.2 0.5 3.8 0.8 7.6
Papua New Guinea 0 0 0 0 6.5 0 6.5
Malaysia 1.5 1.9 0.7 0 0 0 4.1
Cambodia 2.3 0 0 0 1.0 0 3.3
Sri Lanka 0.9 0.2 0 0 1.0 0 2.0
Singapore 0 0 0 0 1.5 0 1.5
Brunei 0 0 0.1 0 0 0 0.1
Timor L’este 0 0 0.1 0 0 0 0.1
Source: Global Energy Monitor. Estimates are based on global and regional average capital expenditures for building new gas infrastructure, and may diverge
from projected costs at the project level. See the Methodology appendix for details.
GLOBAL ENERGY MONITOR REPORT | OCTOBER 2021 | 7ASIA’S GAS LOCK-IN
Figure 1: Gas-Fired Power Plants in Development in Asia
Gas-Fired Power Plants:
= in construction
= proposed
Source: Global Energy Monitor
Figure 2: Gas Pipelines and Terminals in Development in Asia
Gas Pipelines:
= in construction
= proposed
Gas Terminals:
= in construction
= proposed
Source: Global Energy Monitor
GLOBAL ENERGY MONITOR REPORT | OCTOBER 2021 | 8ASIA’S GAS LOCK-IN
BACKGROUND: ASIA’S CLIMATE AND ENERGY FUTURE AT A CROSSROADS
GEM’s data shows that Asia is at the center of the grow- Whether such diplomatic and policy measures will
ing global LNG market: it is home to 59% of the world’s be translated into reality depends on what type of
existing LNG import capacity and 70% of the world’s energy investments are made in the coming decade.
capacity in construction or pre-construction develop- The announcement of carbon neutrality goals by
ment. Asia will be a dominant force determining the three major East Asian economies is evidence for
future of gas in the energy transition. hope, as is the rapid growth in Asia’s renewable
power capacity, which now accounts for nearly half
In response to the worsening climate crisis, all the global total and is expected to double in less than
Asian countries have signed on to the Paris Climate five years, led by deployment of new solar photo
Agreement (beyond a few exceptions in the M iddle voltaics (PV)(IRENA 2021a, Rystad 2020). But despite
East). In addition, several of the region’s largest these positive steps, reports from governments, news
economies have pledged to achieve carbon n eutrality outlets, and companies across Asia reveal a disturbing
by mid-century: Japan and South Korea by 2050 trend: the region is planning a massive buildout of
through legislated commitments, and China by infrastructure to import foreign fossil gas to satisfy
2060 through a stated policy. rising energy demand. As described in the following
section, that buildout poses major problems both on
environmental and economic grounds.
Figure 3: LNG Import Capacity in Development by Region, June 2021
East Asia includes China with Hong Kong and Macao, Japan,
South Korea, and Taiwan.
Southeast Asia includes Brunei, Cambodia, Indonesia, Laos,
Malaysia, Myanmar, Papua New Guinea, the Philippines, Singa-
pore, Thailand, Timor L’este, and Vietnam.
South Asia includes Bangladesh, India, Pakistan, and Sri Lanka.
MENA refers to the Middle East and North Africa.
Source: Global Energy Monitor. Includes projects in construction and in pre-construction development.
GLOBAL ENERGY MONITOR REPORT | OCTOBER 2021 | 9ASIA’S GAS LOCK-IN
THE PROBLEMS WITH GAS
Gas is composed of methane and other hydrocar- on gas for 23% of its generation (BP 2021).5 Despite
bons known as natural gas liquids (EIA 2020). It is misperceptions, gas is dirty, it is expensive, and it
among the most widely consumed fuels worldwide. undermines efforts to avert the worst impacts of the
In 2020, the global economy consumed 3.8 trillion climate crisis.
cubic meters of gas, and the electricity sector relied
Emissions
Gas burned worldwide is one of the main sources of the world will exhaust its carbon budget: the amount
CO2 emissions. In 2019, gas accounted for 22% of all of CO2 that can be emitted while maintaining a good
fossil fuel emissions (IEA 2020c). Burning more gas chance of meeting this climate target. Coal-to-gas
will contribute to the continued rise of global emis- switching is also not a viable solution. A 2019 analysis
sions, at a time when they must begin a sharp decline from Bloomberg New Energy Finance (BNEF) modeled
if the world is to avert the worst effects of climate a scenario in which coal plants were replaced by 2035
change. Even if CO2 were the only greenhouse gas primarily by gas, and found that emissions levels were
released by gas consumption—and as discussed below, still significantly above a 1.5° C pathway (BNEF 2021).
it is not—there is no room for developing new gas
fields and expanding gas consumption. Figure 4 shows In addition to emitting CO2 through combustion,
that emissions from currently producing gas, oil, and new findings over the past decade have revealed that
coal projects are already too great to maintain a 50% the production, transportation, and consumption
chance of limiting global warming to 1.5° C (OCI 2016). of gas all leak large amounts of methane, a potent
If emissions continue at current rates for ten years, greenhouse gas. For example, research led by the
Figure 4: Carbon Dioxide Emissions from Developed Global Fossil Fuel Reserves,
Compared to Carbon Budgets within Range of the Paris Goals.
1200
1000
Coal
800
Developed
reserves
Gt CO2
Gas
600
400
Oil
1.5ºC
Carbon budget
200
Land use
change Cement
0
Emissions 1.5ºC (50% chance)
Sources: Oil Change International analysis based on data from Rystad Energy, IEA, World Energy Council, IPCC, and Global Carbon Project.
Remaining carbon budgets are as of January 1, 2020.
5. Gas can be used in diverse applications including electricity generation, commercial and residential heating, and transportation, and industrial
processes. Electricity generation is the sector driving much of the planned gas expansion in Asia, and thus is the focus of this report.
GLOBAL ENERGY MONITOR REPORT | OCTOBER 2021 | 10ASIA’S GAS LOCK-IN
Environmental Defense Fund found that 60% more are just 7% and 2% of LNG emissions, respectively
methane is leaking along the U.S. supply chain than (NRDC 2020).
the U.S. Environmental Protection Agency estimated
in 2015 (Alvarez et al. 2018). Methane has a global Figure 5 shows the flurry of planned new LNG import
warming impact that is 86 times that of CO2 on a capacity under development across the region. The
20-year time scale and 34 times that of CO2 on a 100- purpose of some of this new capacity is to replace
year time scale (Myhre et al. 2014). some dwindling supplies. For instance, gas provides
20% of electricity generation in the Philippines, but
Even more gas is leaked and burned when it is shipped the country’s primary gas resource, the Malampaya
across the world. LNG is gas that has been cooled to gas field, is expected to run out by 2027 (Shiga et al.
–162° C and condensed into a liquid so that it may be 2021). China is the main exception, with domestic gas
transported by ocean tanker from gas producers to production expected to double by 2040 (IEA 2020c).
consumers. Countries in Asia are advancing plans to However, the level of planned new LNG import
dramatically expand LNG imports, which is of grave capacity for the region far exceeds the amount needed
concern from an emissions perspective. The liquefac- to replace declining domestic gas supplies. The LNG
tion of gas requires large amounts of energy and can import capacity in development in Asia is approx-
consume up to 10 percent of the feed gas (Total 2018). imately equivalent to the existing export capacity
This process also uses ozone-depleting refrigerants. of every LNG exporter in the world combined. It is
Furthermore, the ships transporting LNG burn addi- enough infrastructure to absorb the entire global LNG
tional fossil fuels for power. The Natural Resources trade of 2020 (GIIGNL 2021).
Defense Council has estimated that liquefaction,
shipping, and regasification of LNG can increase the Expanding gas consumption across Asia is incompati-
lifecycle emissions of gas by 8% to 21% on a 20-year ble with net-zero emissions scenarios that would seek
time frame. As a result, lifecycle emissions for US LNG to limit global warming to 1.5° C, in line with the Paris
are only 27% to 33% lower than coal evaluated over Agreement. The IEA’s Net-Zero Emissions by 2050
this time frame. This stands in stark contrast to the Scenario, consistent with these international goals,
lifecycle emissions for solar and wind power, which finds that global gas consumption should peak around
Figure 5: LNG Import Capacity Operational and in Development in Asia, June 2021.
300.0
200.0 Proposed
Construction
mtpa
Operating
100.0
0.0
a
n
a
nd
do n
a
es
ea
an
m
ar
e
sh
a
a
a
Ba por
in
di
si
si
k
di
pa
a
na
nm
in
an
de
r
st
iw
la
ne
ay
Ch
In
bo
Ko
Ja
pp
ai
ki
et
a
Ta
iL
la
ya
al
m
ng
Th
Pa
Vi
h
ng
ili
M
Sr
M
Ca
ut
In
Si
Ph
So
Country
Source: Global Fossil Infrastructure Tracker, Global Energy Monitor
GLOBAL ENERGY MONITOR REPORT | OCTOBER 2021 | 11ASIA’S GAS LOCK-IN
2025 and then decline rapidly through 2050. Under this up to 2050 while living standards rise, especially in
scenario, there is no need for expanding LNG capacity, the global South,” and which relies little on carbon
as fossil gas traded as LNG would fall by 60% between capture and storage. For this scenario, IPCC finds that,
2020 and 2050 (IEA 2021). The Intergovernmental with respect to 2010 levels, primary energy from gas
Panel on Climate Change (IPCC) describes its P1 consumption should fall by 25% by 2030 and 74% by
scenario as one in which “social, business and tech- 2050 (IPCC 2019).
nological innovations result in lower energy demand
Economic Challenges
Building gas infrastructure is financially risky, espe- IEA (IEA 2020a). In Indonesia, for instance, a pro-
cially in the power sector, where costs for renewables posed 6 GW increase in gas capacity is being used to
are falling rapidly. Plans to sink hundreds of billions boost the amount of “clean” power in the current draft
of dollars into new gas infrastructure in Asia rest on of its national energy plan for 2021–2030 (Enerdata
the assumption that gas is the most cost effective and 2021). Demand for electricity is growing in much of
reliable option for producing power. Yet that assump- Asia. In Thailand, electricity consumption is forecast
tion is no longer valid, given the dramatically rapid to increase 50% by 2030, up to 300 Terawatt-hours
decline in clean energy costs—over 90% since 2009. (TWh), while Vietnam’s electricity consumption is
Planned growth in gas power capacity in Asia is shown forecast to nearly double by 2035, reaching 388 TWh
in Figure 6. (OIES 2020). Even so, many planned gas projects are
not needed to meet countries’ future demand. Ban-
Electricity generation is the primary driver for new gladesh’s thermal fleet of power plants, for example,
gas development in most countries in Asia (China and operated at only 40% of its capacity between 2019 and
India are exceptions, with most new gas targeted for 2020 (IEEFA 2021c). In some countries in the region,
industrial uses such as the production of methanol governments subsidize power companies’ lost revenue
and fertilizer). The power sector is responsible for 60% due to overcapacity. In Pakistan, it is estimated that
of anticipated incremental demand growth for gas in such payments will cost the government US$10 billion
Emerging Asia between 2019 and 2025, according to a year by 2023 (IEEFA 2021d).
Figure 6: Gas-fired Power Plant Capacity Operating and in Development in Asia, June 2021
200
150 Proposed
Construction
Operating
100
GW
50
0
a
m
an
a
do d
ia
sh
an
a
Pa ia
n
ya s
ar
m e
a
ka
ei
e
r
in
re
di
di
ta
n
un
Ba nes
s
o
na
nm
in
an
de
p
iw
la
ay
Ch
In
bo
Ko
s
ap
Ja
pp
Br
ai
ki
et
Ta
iL
la
al
ng
Th
Vi
h
ng
ili
M
Sr
M
Ca
ut
In
Si
Ph
So
Country
Source: Global Energy Monitor, Global Gas Plant Tracker, September 2021.
GLOBAL ENERGY MONITOR REPORT | OCTOBER 2021 | 12ASIA’S GAS LOCK-IN
Clean energy portfolios (CEPs), comprising renewable unpredictable or facilities prohibitively expensive
power with storage and demand-side management, to run during price spikes. This past year has seen a
now outcompete gas-fired power in much of the world, number of such price spikes caused by shocks includ-
including Asia, and are expected to become even ing the Covid-19 pandemic and the blockage of the
more competitive as solar PV, wind, and storage costs Suez Canal by a stuck ship.
continue to decline. Today, the International Renew-
able Energy Agency (IRENA) has found that 62% of all Spot prices for LNG in Asia ranged from $2 to $30 per
renewable power generation worldwide, or 162 GW, million British thermal units (MMBtu) in 2020 (S&P
has lower costs than the cheapest new fossil fuel Global 2021). In Japan, a major importer of gas, elec-
option. The share of renewable generation competitive tricity prices surged to record levels during a global
with fossil fuels doubled in 2020 with respect to the gas shortage in January 2021 (IEEFA 2021b). More
previous year (IRENA 2021b). BNEF has forecast that recently, Pakistan was forced to purchase LNG for
by 2050 the average global levelized costs of electricity September 2021 at $15 per MMBtu, the highest prices
for solar PV, onshore wind, and offshore wind will since it began imports, to avoid blackouts (Stapczynski
fall by an additional 70%, 50%, and 45%, respectively 2021). Volatility in the global gas market is expected
(ETC 2021). Adding storage and demand-side manage- to increase over the coming years. As the Institute for
ment only improves the economics by increasing the Energy Economics and Financial Analysis (IEEFA) has
renewables’ capacity factor (i.e., how much capacity written, “Emerging markets, which almost by defini-
is actually used). Rocky Mountain Institute found that tion are more price sensitive, will find the forthcoming
2019 was the break-even year in the United States when price environment challenging. They may find their
CEPs began to outcompete new gas (RMI 2019). newly installed gas generators being underutilised,
while tariffs for gas and electricity customers will
In addition to being cheaper and more climate rise.” IEEFA has estimated that around US$50 billion of
friendly, renewable power has distinct energy security proposed gas-fired power projects in Vietnam, Bangla-
advantages with respect to gas. Volatility in fuel prices desh, and Pakistan are at risk of cancellation because
or fuel availability can make gas project revenues of increasing LNG price volatility (IEEFA 2021a).
RENEWABLES: A VIABLE SOLUTION FOR ASIA
As discussed elsewhere in this report, in most parts of the Even for the provision of flexible power, renewables are
world renewables are now or will soon be more affordable a preferred option. Flexible “peaker” gas-fired power plants
than gas. Utility-scale solar PV is the cheapest electricity are more expensive because they are less efficient and
source in China and India (BNEF 2021). Renewables are require more gas to run. Lazard finds that the unsubsidized
already competitive with new gas plants in South Korea, and levelized cost of energy from gas peaker plants is $175
are expected to be competitive with existing gas plants as per megawatt-hour (MWh), compared to $40/MWh and
early as 2023 (Carbon Tracker 2020). There is little financial $37/MWh for wind and utility-scale crystalline solar PV,
advantage in waiting to build; IRENA projects that renew- respectively (Lazard 2020). Furthermore, batteries are better
able projects built by emerging economies in 2020 will save suited to short-term (1–4 hours) fluctuations in energy.
up to US$156 billion over their lifespans (IRENA 2021b).
Most Asian countries have ample renewable resources.
Furthermore, scaling up renewables now is a cheaper and
Carbon Tracker has found that China, India, Vietnam,
faster pathway to net-zero emissions than having to build
and Thailand have 10 to 100 times more solar and wind
and eventually retire a new fleet of fossil infrastructure.
GLOBAL ENERGY MONITOR REPORT | OCTOBER 2021 | 13ASIA’S GAS LOCK-IN
resources available than total energy demand require- power market design,” it will be “feasible and cost-effective”
ments. Indonesia, Laos, and Cambodia have over 100 to achieve variable renewable penetration levels of 75–90%.
times more. Because renewable costs are declining so Some markets already operate with variable renewable
rapidly, it is quickly becoming economical to harness these penetration levels of 30% or greater, such as Denmark and
resources. Globally, half of all renewable resources that are Uruguay, and regions in China operate with levels of 15–20%
technically available today may be captured economically; (ETC 2021). On average, emerging markets outside of China
by the end of the decade, 90% of all such resources could had renewable penetration rates of 4.1% as of 2020 (Carbon
be captured economically (Carbon Tracker 2021b). The Tracker 2021a).
widespread geographic availability of renewable resources
Across Asia, renewable power is rapidly gaining momentum.
is also beneficial for providing distributed generation that
Starting from very little installed solar, Vietnam installed
increases energy access. According to the International
4.8 GW in 2019 and 11.5 GW in 2020 (Ha 2021). The coun-
Institute for Sustainable Development (IISD), renewables
try’s draft eighth power development plan anticipates that
are well matched for many developing economies, such as
renewable power will account for about 25% of the country’s
those in Asia, because “they often have ample sunshine
energy mix by 2030, surpassing generation from oil and
and/or wind resources . . . and modular development can
gas-fired power (Huong 2021). Last year Myanmar had a
be well matched to where and when demand growth is
1 GW solar auction that brought in prices between $35/MWh
occurring, including electrifying remote rural populations”
to $51/MWh, easily cost-competitive with gas (Bellini 2020).
(IISD 2021).
South Korea recently announced an 8.2 GW offshore wind
Although renewable technologies generate power inter- project, set to be the largest in the world (Renewable Energy
mittently due to the natural variability of wind speeds and World staff 2021). Bangladesh’s power minister recently set
solar intensity, intermittency can be managed with existing a target to provide 40% of power generation from renew-
technical, policy, and regulatory solutions, even at high rates able sources by 2041 (Dhaka Tribune staff 2021). Japan’s
of renewable deployment. The Energy Transitions Commis- government has announced goals of generating 10 GW of
sion states with the “application of new technologies and electricity from offshore wind by 2030 and 30–45 GW by
approaches to system operation, supported by appropriate 2040 (Okutsu et al. 2021).
Figure 7: Levelized Costs of Energy for Renewables vs. Gas
400
300
Solar PV - Chrystalline
US$/MWh
Wind
200
Gas Peaker
Gas Combined-Cycle
100
0
2009 2010 2011 2012 2013 2014 2015 2016 2017 2018 2019 2020
Source: Lazard’s Levelized Cost of Energy Analysis - Version 14.0. The data presented in this figure are global, unsubsidized
mean values for utility-scale generation.
GLOBAL ENERGY MONITOR REPORT | OCTOBER 2021 | 14ASIA’S GAS LOCK-IN
THE GAS INDUSTRY’S VISION: ASIA AS THE INEVITABLE
CENTER OF THE NEW GLOBAL LNG MARKET
Imperiled by the rise of cheap renewables and public Wood Mackenzie forecasts that Asia will account for
alarm about climate change, the gas industry has 95% of global LNG demand growth between 2020 and
painted a vision of a world in which rapid growth in 2022 (Wood Mackenzie 2021). Demand for gas, and LNG
gas consumption continues for decades, with Asia in particular, is growing faster in Asia than anywhere
leading the way. As shown in Figure 8, this vision of else in the world. Shell forecasts that Asia will continue
rapid global gas growth led by Asia is reflected in the dominating global LNG demand growth for decades,
distribution of both existing and planned LNG import accounting for 75% by 2040 (Shell 2021). In line with
infrastructure. industry projects, the IEA has forecast that emerg-
ing Asian economies such as Bangladesh, Pakistan,
Figure 8: LNG Import Capacity in Asia vs. the Rest of the World Thailand, and Vietnam will be the major driver of
1000 expanding LNG imports globally. According to the IEA,
In Development
Emerging Asia will be the second-biggest contributor
750
Operating to global gas demand growth between now and 2025
(IEA 2020a).
mpta
500
250
Demand growth in Asia is central to the strategies of
gas exporters and traders, such as the United States
0 and Japan. Broadly, the efforts of these countries
Asia Rest of the World
and others are part of a larger trend as the fossil gas
Source: Global Energy Monitor, Global Fossil Infrastructure Tracker,
June 2021. industry seeks to restructure itself from a collection
Figure 9: LNG Terminals in Development Worldwide
Import LNG Terminals:
= in construction
= proposed
Export LNG Terminals:
= in construction
= proposed
Source: Global Energy Monitor, Global Fossil Infrastructure Tracker, June 2021
GLOBAL ENERGY MONITOR REPORT | OCTOBER 2021 | 15ASIA’S GAS LOCK-IN
of regional markets into a wider and more integrated There are signs that the gas industry is beginning to
global system. see the writing on the wall, as civil society, businesses,
and governments around the world are increasingly
Against the backdrop of a struggling domestic fracking recognizing the need to shift to a net-zero economy.
industry, the United States has sought to expand gas The current global expansion of gas infrastructure
exports. The United States was on track to become the has been appropriately called by Quartz “the last
world’s largest gas exporter by 2024 before the Covid- great fossil fuel gold rush.” According to a gas market
19 pandemic, which led to a collapse in gas prices analyst with the Center for Strategic and International
and wreaked havoc on financing for new gas export Studies, “People are starting to appreciate that this
terminals and pipelines (GEM 2021b). Still, US LNG could be the last window. . . . If you don’t sanction a
exports to Asia increased by 67% in 2020, with South project in the next few years, you may never sanction
Korea, Japan, and China as the primary destinations a project” (McDonnell 2020). From the perspective of
(Boudreau 2021). gas producers and traders, building gas projects in
Asia and building them now may be the most import-
ant factor for locking in future demand.
HOW PUBLIC POLICY AND FINANCE ARE PROPPING UP THE GAS EXPANSION
The Trump administration pushed LNG diplomacy in in public and private financial aid for “decarboniza-
Asia, securing commitments from Japan to purchase tion” projects in Asia including coal-to-gas switching
US LNG and invest in American infrastructure, and (Reuters staff 2021a). South Korea, another major
funding trade missions and research initiatives to gas trader and importer, has also heavily financed
boost LNG purchases in Vietnam (GEM 2020, Bou- LNG projects through its public finance institutions.
dreau 2021). The Biden administration’s stance toward Research by Solutions for Our Climate has found that
LNG exports remains unclear. The administration’s The Export-Import Bank of Korea, Korea Trade Insur-
Department of Energy recently announced that it ance Corporation, and Korea Development Bank have
would assess lifecycle emissions associated with a pro- provided US$23.1 billion in financing to shipbuilding
posed LNG export project as part of an environmen- of LNG carriers over the past ten years (SFOC 2021).
tal review, but it has not yet moved to enforce such
reviews for over 20 other proposed export projects; Much of the funding for Asia’s gas expansion is com-
eliminate public subsidies or other incentives for LNG ing from governments themselves, through public
infrastructure around the world; signal opposition to finance institutions. Multilateral development banks,
expanding LNG; or undertake other actions that would bilateral development banks, and export credit agen-
significantly curtail LNG exports (Anchondo 2021). cies continue to support gas development around the
world. A recent report from IISD examined public
Increased LNG consumption around the world is financing for gas in low- and middle-income coun-
central to the strategy of Japan, a major trader and tries across Asia, Oceania, Europe, Africa, and Latin
importer, which has sought to enhance the stabil- America and the Caribbean. IISD found that countries
ity of a volatile global LNG market. Japan is one were receiving more financing for gas than any other
of the largest funders of gas projects beyond its energy source, and that four times as much public
borders; between January 2017 and June 2020, its finance went to gas as did to wind or solar. Such public
public and private financing institutions provided support is vital to the success of expensive energy
at least US$23.4 billion of financing for LNG termi- projects. While international finance is typically a
nals, tankers, and pipelines in other countries (GEM small fraction of total finance, it signals confidence
2020). In June, Japan pledged to offer US$10 billion in project viability that encourages private sector
GLOBAL ENERGY MONITOR REPORT | OCTOBER 2021 | 16ASIA’S GAS LOCK-IN
investment (IISD 2021). According to the IEA, public There is a high risk that public funding for gas could
financing and policy support for gas in countries in continue. The ADB is currently updating its Energy
Asia will be a key determinant in whether global gas Policy, and a draft version states that it “may finance
demand increases into the 2030s (IEA 2020c). natural gas projects (including gas transmission
and distribution pipelines, terminals, storage facil-
The Shift the Subsidies database compiled by Oil ities, gas-fired power plants, natural gas for heating
Change International (OCI) reveals the nature of pub- and cooking)” (Pardiker 2021). In June 2021, JBIC
lic finance in Asia in recent years (OCI 2021). A review announced a new three-year business plan through
of the database finds that US$22.4 billion in public March 2024. JBIC Governor Tadashi Maeda said that
finance went to gas projects in Asia between 2014 and JBIC will continue financing upstream development of
2018, led by the Export-Import Bank of China, Japan LNG and gas-fired power generation projects (Reuters
Bank for International Cooperation (JBIC), and Asian staff 2021b). In June 2021, the World Bank published
Development Bank (ADB) (see Table 2). According to its Climate Change Action Plan for 2021–2025. The
OCI’s data, only 4% of this financing went toward gas World Bank Group says this plan signals a shift toward
projects that expanded energy access. Gas is not well- “greening entire economies,” yet leaves the door open
suited for expanding energy access, given that 85% for choosing fossil gas projects to meet energy access
of those worldwide without access to electricity live needs (World Bank Group 2021).
in rural areas. Renewables are much better suited for
distributed generation (IISD 2021).
Table 2: Top Public Financiers of Gas Projects in Asia (2014–2018)
Institution Financing (US billions)
1 Export-Import Bank of China 4.3
2 Japan Bank for International Cooperation 4.1
3 Asian Development Bank 2.9
4 Nippon Export and Investment Insurance 2.4
5 International Finance Corporation 1
Source: Oil Change International’s Shift the Subsidy database
CONCLUSION
Asia’s gas buildout deserves a re-examination, based Asia’s gas buildout is not inevitable. For example,
on the rapidly changing economics of energy. Clean over the past five years new coal power capacity in
energy portfolios such as solar PV and wind power the planning stage in Southeast Asia has declined by
paired with storage and demand-side management 80% (GEM 2021a). Political and financial institutions,
are safer and ultimately more beneficial investments. civil society, and energy providers have the power to
Asia is an engine of growth, and it does not need to change course in the region, and with good reason.
run on gas. Redirection of public finance away from New gas infrastructure in Asia is a risky bet for the
gas infrastructure can be a determinative signal for climate, imperiling its countries’ net zero commit-
private investment, aligning both private investment ments. New gas is a risky economic investment for the
and public policy with net-zero goals. As shown by region as well, locking countries into dependency on
the remarkable speed at which the tide has turned a volatile, foreign resource that is quickly losing out to
against coal power, change is occurring quickly in the cleaner alternatives.
energy industry.
GLOBAL ENERGY MONITOR REPORT | OCTOBER 2021 | 17ASIA’S GAS LOCK-IN
METHODOLOGY
The data on gas infrastructure in this report is based of new gas terminals and pipelines are 50 years.
on GEM’s Global Gas Plant Tracker (power plants) and There is little data available on gas terminal and
Global Fossil Infrastructure Tracker (terminals and pipeline lifetimes because the vast majority that have
pipelines), as of June 2021. been constructed have yet to be retired; 50 years is
a conservative estimate based on GEM’s data. The
GEM analyzed data from the following countries in National Energy Technology Laboratory has modeled
East, South, and Southeast Asia: Bangladesh, Brunei, the 20-year and 100-year lifecycle emissions associated
Cambodia, China with Hong Kong and Macao, India, with scenarios including gas delivered by pipeline
Indonesia, Japan, Laos, Malaysia, Myanmar, Pakistan, from Russia to China, LNG shipped from Australia to
Papua New Guinea, the Philippines, Singapore, South China, and LNG shipped from the US to China (NETL
Korea, Sri Lanka, Taiwan, Thailand, Timor L’este, and 2019). The first scenario was used to estimate the
Vietnam. lifecycle emissions associated with gas imported by
pipeline, and the average of the two latter scenarios
To estimate theoretical maximum lifecycle emissions
was used to estimate the lifecycle emissions associated
associated with Asian gas infrastructure in develop-
with LNG imported through terminals.
ment, GEM calculated the total amount of gas that
could be imported into Asia through gas terminals To calculate investment in Asian gas infrastructure,
and pipelines in development, based on the following the following figures were used to convert power plant
assumptions: (1) all Asian gas infrastructure currently capacities, terminal capacities, and pipeline lengths
in development is built, (2) all infrastructure is used into capital expenditures in US dollars.
for its full lifetime at full capacity, and (3) the lifetimes
Table 3: Costs of Gas Infrastructure used to Estimate Investment
Gas Infrastructure Type Cost Source
Power Plant Combined-Cycle $630/kW a (IEA 2020c, p.418)
Power Plant Other $482/kW b (IEA 2020b, p.43; IEA 2020d, p.418)
Import Terminal Onshore $274/tonne c (IGU 2018, p.53)
Import Terminal Floating $129/tonne d
(IGU 2018, p.54)
Export Terminal Onshore (Greenfield) $1501/tonne e (IGU 2018, p.25)
Export Terminal Onshore (Brownfield) $458/tonne f
(IGU 2018, p.25)
Export Terminal Floating $1501/tonne g (IGU 2018 p.25; OIES 2019, p.16)
Pipeline N/A $5033/meter h
(Smith 2020, p.2)
Notes
a. Based on the average of (IEA 2020c, p.418) estimates for combined-cycle plants in China and India.
b. Based on GEM’s estimate for Asian combined-cycle plants from (IEA 2020c), scaled according to the ratio between mean overnight costs for CC plants and open-cycle/internal
combustion plants presented in (IEA 2020b, p.43).
c. Based on average global cost of new onshore LNG import capacity in 2017 per (IGU 2018, p.53).
d. Based on average global cost of floating import terminal capacity in 2017 per (IGU 2018, p.54).
e. Based on average global onshore greenfield export terminal capacity costs in 2017 per (IGU 2018, p.25).
f. Based on average global onshore brownfield export terminal capacity costs in 2017 per (IGU 2018, p.25).
g. Based on average global onshore greenfield export terminal capacity costs in 2017 (IGU 2018, p.25). (OIES 2019, p.16) finds that floating export terminal costs are in approximately
the same range as onshore terminal costs, and most new floating capacity is assumed to be greenfield.
h. Based on (Smith 2020, p.2) estimate for the cost of building new gas pipelines in the US in 2020, and applied to all East Asian countries excluding China. For South Asian countries
(and China), a regional estimate of $687/meter was applied, based on an average of known pipeline costs in India. For Southeast Asian countries, a regional estimate of $1330/meter
was applied, based on an average of known pipeline costs in Indonesia.
GLOBAL ENERGY MONITOR REPORT | OCTOBER 2021 | 18ASIA’S GAS LOCK-IN REFERENCES Alvarez, R et al. Assessment of methane emissions _____ (2021b). Pipeline Bubble 2021: Tracking Global from the U.S. oil and gas supply chain. Science. Oil and Gas Pipelines. Published February, 2021. Published July 13, 2018. DOI: 10.1126/science. Ha, T. Renewables are booming in Vietnam. Will the aar7204 upswing last? Eco-Business. Published April 13, Anchondo, C et al. Surging U.S. LNG puts Biden in 2021. climate bind. E&E News. Published July 8, 2021. Huong, T. Latest draft of national Power Development Bellini, E. Myanmar’s 1 GW solar tender concludes Plan VIII up for comments. Vietnam Investment with lowest bid of $0.0348/kWh. PV Magazine. Review. Published September 7, 2021. Published September 24, 2020. Institute for Energy Economics and Financial Analysis BloombergNEF (BNEF). New Energy Outlook 2021. (IEEFA). 2021a. Gas and LNG Price Volatility to Published July, 2021. Increase in 2021. Published January, 2021. Boudreau, J et al. The U.S. Risks Losing Out From Its _____ (2021b). IEEFA: Bangladesh needs a renewables Own Trade Push in Vietnam. Vietstock. Published focus, not a switch from ‘coal to gas’. Published July 2, 2021. April 13, 2021. BP. Statistical Review of World Energy 2021. Published _____ (2021c). IEEFA: Bangladesh’s power system July 8, 2021. overcapacity problem is getting worse. Published Carbon Tracker (2021a). Reach for the Sun: The January 20, 2021. emerging market electricity leapfrog. Published _____ (2021d). IEEFA: Fossil fuel pressure and risks July 14, 2021. mounting for multilateral development banks. _____. Stranded Assets. Published August 23, 2017. Published April 19, 2021. _____ (2021b). The Sky’s the Limit: Solar and wind Intergovernmental Panel on Climate Change (IPCC). energy potential is 100 times as much as global Presentation on IPCC Special Report on Global energy demand. Published April 23, 2021. Warming of 1.5°C. Published September, 2019. _____. Whack-A-Mole: Will South Korea’s coal power International Energy Agency (IEA). 2020a. Gas 2020. transition be undermined by overcompensated gas? Published June, 2020. Published April 21, 2020. _____. Net Zero by 2050: A Roadmap for the Global Dhaka Tribune staff. State Minister Nasrul: 40% of Energy Sector. Published May 2021. power will come from renewable sources in 2041. _____ (2020b). Projected Costs of Generating Electricity Dhaka Tribune. Published June 25, 2021. 2020. Published December 2020. Enerdata. Indonesia’s PT Pertamina plans to add 10 _____ (2020c). World Energy Outlook 2020. Published GW of capacity by 2026. Published July 7, 2021. October, 2020. Energy Information Administration (EIA). Natural gas International Gas Union (IGU). 2018 World LNG Report explained. Published December 9, 2020. (27th World Gas Conference Edition). Published Energy Transitions Commission (ETC). Making Clean July 7, 2018. Electrification Possible: 30 Years to Electrify the The International Group of Liquefied Natural Gas Global Economy. Published April, 2021. Importers (GIIGNL). LNG Information Paper #3 Global Energy Monitor (GEM) (2021a). Boom and 2019 Update: LNG Ships. Published in 2019. Bust 2021: Tracking the Global Coal Plant Pipeline. _____. The LNG Industry GIIGNL Annual Report 2021. Published April, 2021. Published in 2021. _____. Gambling on Gas: Risks Grow for Japan’s $20 International Institute for Sustainable Development Billion LNG Financing Spree. Published June, 2020. (IISD). Step Off the Gas: International public GLOBAL ENERGY MONITOR REPORT | OCTOBER 2021 | 19
ASIA’S GAS LOCK-IN

  finance, natural gas and clean alternatives in the      Reuters staff (2021a). Japan pledges $10 bln financial
  Global South. Published June 6, 2021.                     support for Asia’s energy transition. Reuters.
International Renewable Energy Agency (IRENA).              Published June 21, 2021.
   2021a. Renewable Capacity Statistics 2021.             _____ (2021b). JBIC to support exports of coal power
   Published March, 2021.                                    plants with CCS or ammonia co-firing. Reuters.
_____ (2021b). Renewable Power Generation Costs in           Published June 29, 2021.
   2020. Published June, 2021.                            Renewable Energy World staff. South Korea
Lazard. Lazard’s Levelized Cost of Energy Analysis—         announces ambitious 8.2GW wind complex.
  Version 14.0. Published October 2020.                     Renewable Energy WorldPublished February 17,
McDonnell, T. Qatar is winning the last great fossil        2021.
  fuel gold rush. Quartz. Published October 6, 2020.      Rocky Mountain Institute (RMI). The Growing Market
Myhre, G et al. Anthropogenic and Natural                   for Clean Energy Portfolios. Published in 2019.
  Radiative Forcing in Climate Change 2013: The           Rystad Energy. Asia-Pacific’s renewable energy
  Physical Science Basis. Contribution of Working           capacity set for 58% growth over five years, driven
  Group I to the Fifth Assessment Report of the             by solar. Published October 20, 2020.
  Intergovernmental Panel on Climate Change.              S&P Global. Platts JKM™ (Japan Korea Marker) LNG
  Published March 24, 2014.                                 Price Assessment. Accessed 2021.
National Energy Technology Laboratory (NETL). Life        Shell. Shell LNG Outlook 2021. Published February,
  Cycle Greenhouse Gas Perspective on Exporting             2021.
  Liquefied Natural Gas from the United States: 2019      Shiga, Y et al. Southeast Asia scrambles for LNG with
  Update. Published September 12, 2019.                      gas fields tapping out. Nikkei Asia. Published June
Natural Resources Defense Council (NRDC). Sailing to         2, 2021.
  Nowhere: Liquefied Natural Gas is Not an Effective      Smith, C. Liquids pipeline operators’ net incomes
  Climate Strategy. Published December 8, 2020.             increase 23.5%. Oil & Gas Journal. Published
Oil Change International (OCI). Shift the Subsidies         October 5, 2020.
   Database: Public Finance Still Funding Fossils.        Solutions for Our Climate (SFOC). Fueling the Climate
   Accessed April, 2021.                                     Crisis: South Korea’s Public Financing for Oil and
_____. The Sky’s Limit: Why the Paris Climate                Gas. Published August 31, 2021.
   Goals Require a Managed Decline of Fossil Fuel         Stapczynski, S et al. Pakistan Forced to Buy Priciest
   Production. Published September, 2016.                    LNG Shipments to Avoid Blackouts. Bloomberg.
Okutsu, A et al. Suga plan for greener Japan stirs hope      Bloomberg. Published July 29, 2021.
  in wind energy sector. Nikkei Asia. Published May       Total. Innovation: Using less energy to liquefy natural
  7, 2021.                                                   gas. CNBC. Published October 8, 2018.
The Oxford Institute for Energy Studies (OIES).           Wood Mackenzie. How Asia changed the global LNG
  Emerging Asia LNG Demand. Published September,            market in the space of a year. Published April 21,
  2020.                                                     2021.
_____. Floating LNG Update – Liquefaction and Import      World Bank Group. World Bank Group Climate
   Terminals. Published September 2019.                     Change Action Plan 2021–2025 : Supporting Green,
Pardiker, R. Asian Development Bank will stop               Resilient, and Inclusive Development. Published
  financing coal, but leaves a door open for gas.           June 22, 2021.
  Climate Tracker. Published June 17, 2021.

GLOBAL ENERGY MONITOR                                                               REPORT | OCTOBER 2021 | 20
You can also read