Meteorological and Climate Modelling Services Tailored to Viticulturists
←
→
Page content transcription
If your browser does not render page correctly, please read the page content below

Atmospheric and Climate Sciences, 2021, 11, 148-164
                                                                                                https://www.scirp.org/journal/acs
                                                                                                          ISSN Online: 2160-0422
                                                                                                            ISSN Print: 2160-0414

Meteorological and Climate Modelling Services
Tailored to Viticulturists

Ignasi Porras1, Josep Maria Solé1, Raül Marcos2, Raúl Arasa1

Meteosim SL, Barcelona, Spain
1

Barcelona Supercomputing Center (BSC), Barcelona, Spain
2

How to cite this paper: Porras, I., Solé,       Abstract
J.M., Marcos, R. and Arasa, R. (2021) Me-
teorological and Climate Modelling Servic-      Grape production is likewise inherently interconnected to climate and
es Tailored to Viticulturists. Atmospheric      weather, and, although grapes may grow worldwide, premium wine-grape
and Climate Sciences, 11, 148-164.
                                                production occurs in Mediterranean-like climate ranges. Changes in climate
https://doi.org/10.4236/acs.2021.111010
                                                and weather patterns are threatening premium wine-grapes, directly affecting
Received: December 15, 2020                     the European wine industry. This is because grapevines are extremely sensi-
Accepted: January 15, 2021                      tive to their surrounding environment, with seasonal variations in yield much
Published: January 18, 2021
                                                higher than other common crops, such as cereals. With a view to making
Copyright © 2021 by author(s) and               South European wine industry resilient to climate change, VISCA (Vineyards
Scientific Research Publishing Inc.             Integrated Smart Climate Application) project has deployed a Climate Service
This work is licensed under the Creative
                                                (CS) Decision Support System (DSS) tool that provides to wine producers
Commons Attribution International
License (CC BY 4.0).                            with well-founded information to be able to apply correctly adaptation strat-
http://creativecommons.org/licenses/by/4.0/     egies on specific grape varieties and locations, and to achieve optimum pro-
               Open Access                      duction results (e.g., yield and quantity). In this paper we show the meteoro-
                                                logical, seasonal and climatic models and data sets used to answer the viticul-
                                                turist needs; from short-term and mid-term forecast to seasonal forecast and
                                                climate projections.

                                                Keywords
                                                Weather Extreme Events, Adaptation to Climate Change, Climate Services,
                                                Wine Industry, VISCA

                                              1. Introduction
                                              Agriculture is a highly dependent sector on heat, sunlight and water, and there-
                                              fore very sensitive to climate change. According to the current climate projec-
                                              tions, weather events worldwide are very likely to become more extreme and
                                              frequent. In Europe, Southern countries will be frequently affected by heat

DOI: 10.4236/acs.2021.111010 Jan. 18, 2021                        148                           Atmospheric and Climate Sciences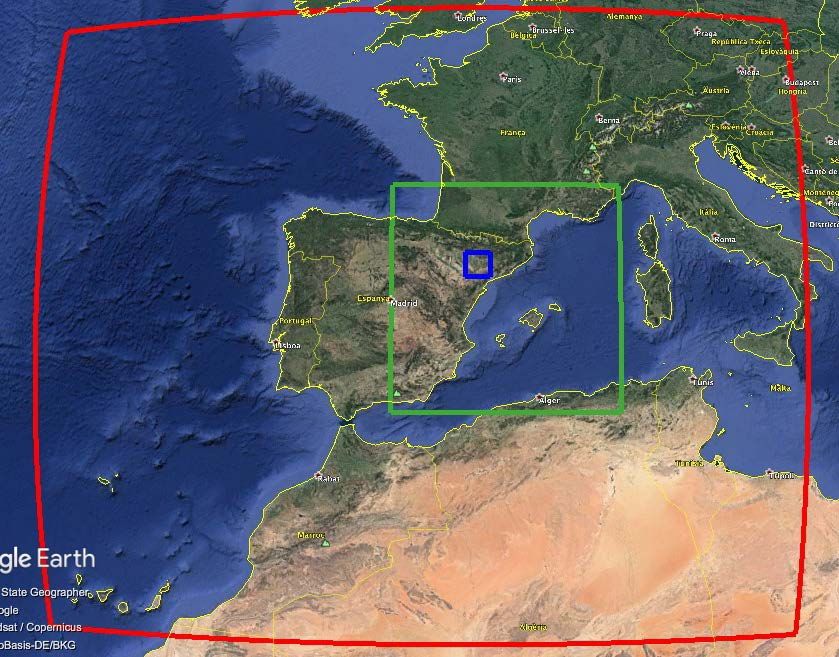
I. Porras et al.

                               waves, therefore making this region more vulnerable to droughts and wildfires,
                               which will lead to economic, environmental, and even human losses. In addi-
                               tion, Mediterranean countries are prone to undergo hydrological resources’ de-
                               crease, due to climate modification (lower precipitation rates) and demographic
                               concentration changes [1] [2]. On the other hand, extreme precipitations will
                               occur especially in the central and northern parts of Europe, giving rise to
                               floods, resulting in a decrease of water quantity and quality due to the fact that
                               hydrological systems will be altered, which may also decrease the water availabil-
                               ity in the surrounding regions [3] [4].
                                  Agriculture happens to be the major land use of the earth, and this is expected
                               to increase as population growth and diet changes may drive food needs up to
                               60% by 2050 [5] [6]. Therefore, agriculture should ensure food security in a
                               world where 800 million people are currently chronically [7]. Although agricul-
                               ture has shown ability to adapt to changing conditions, it is very likely that the
                               above projections overpass agriculture’s adaptation limits. Even if policies and
                               efforts to reduce emissions prove effective, some climate change is inevitable;
                               therefore, strategies and actions to adapt to climate change impacts are needed
                               [8] [9].
                                  Grape production is not different from the rest of agricultural activity, and
                               they are likewise inherently interconnected to climate and weather, and, al-
                               though grapes may grow worldwide, premium wine-grape production occurs in
                               Mediterranean-like climate ranges. Changes in climate and weather patterns are
                               threatening premium wine-grapes (e.g., decrease of the grape quality and quan-
                               tity, undesirable changes in alcohol production, and acid and sugar concentra-
                               tions), directly affecting the European wine industry [10]. This is because grape-
                               vines are extremely sensitive to their surrounding environment, with seasonal
                               variations in yield much higher than other common crops, such as cereals [11].
                                  As wine growers are facing the growing impact of climate change, the demand
                               for enhanced tools designed and able to support them has grown. In particular,
                               there is a high interest for solutions that can provide accurate weather forecast
                               data together with other useful information (e.g., phenological forecast and irri-
                               gation optimisation) would be of the greatest value. Until now the proposed
                               strategies aimed at mitigating and adapting to these conditions involved a range
                               of climatic scales and covered multiple aspects of grapevine management (e.g.
                               change of locations and/or grapevine variety selection), but there was no solu-
                               tion integrating all those aspects in a single adapted tool for winegrowers [12]
                               [13] [14].
                                  Responding to these needs, the VISCA (Vineyards Integrated Smart Climate
                               Application, https://www.visca.eu/) an R & I project co-funded under the Hori-
                               zon 2020 programme has developed a Climate Service (CS) Decision Support
                               System (DSS) that integrates climate and agricultural modelling, and end-users’
                               specifications, in order to design medium- and long-term adaptation strategies
                               to climate change on vineyards. This objective has been achieved through the
                               integration of climatic data, phenological and irrigation models, and end-users’

DOI: 10.4236/acs.2021.111010                       149                           Atmospheric and Climate Sciences
I. Porras et al.

                               requirements into a system co-designed with relevant South-European wine
                               companies from Spain (Codorniu), Italy (Mastroberardino) and Portugal (Sy-
                               mington), in order to allow them to take well-founded decisions (e.g., harvest-
                               ing, defoliation, pruning, minimum water needs, etc.); foresee extreme events at
                               short and medium time-scales; ease the decision-making planning months ahead
                               through the use of seasonal predictions and the development of strategies thanks
                               to the climate projections.
                                 In this paper we show the innovative work done within the VISCA DSS, a
                               platform that integrates meteorological and climate modelling services that will
                               improve the work of the end-users in their daily tasks as to support them long
                               term activities. In particular, we show the meteorological models and data sets
                               used to answer the viticulturist needs from short-term to mid-term forecast and
                               from seasonal forecast to climate projections.

                               2. Methodology
                               2.1. Demo Site Areas and Cellars
                               With a view to making South European wine industry resilient to climate
                               change, VISCA intends to deploy a climate service tool that provides wine pro-
                               ducers with well-founded information to be able to correctly apply adaptation
                               strategies on specific grape varieties and locations and, thus, achieve optimum
                               production results (e.g., yield or quality). It has been validated by real demon-
                               stration with end-users on three demo sites belonging to wine stakeholders from
                               Spain, Italy and Portugal, which are likewise partners in the consortium: Codor-
                               niu, Mastroberardino and Symington. In Table 1 it is shown the end-users demo
                               site characteristics.

                               2.1.1. Codorniu (Spain)
                               Codorniu wine cellar (https://www.codorniu.com/es) is located in the Denomi-
                               nation of Origin (DO) region called Costers del Segre, in the southwest slope of
                               Raimat hills in Catalonia (Spain). This location confers special and differentiated
                               characteristics: higher sunlight exposure in the afternoon, which allows the
                               grapes to accumulate more degree days, achieving an earlier ripening without
                               losing acidity. These are well drained soils; the slight inclination of the fields
                               confers a natural draining of the rainwater. Being on the slope of the hill causes

                               Table 1. End-users demo site characteristics.

                                                                                    Average annual   Average annual
                                                          Location       Altitude
                                                                                     precipitation    temperature

                                                       41˚39'44.99''N,
                                     Codorniu                            ~300 mm      ~450 mm            ~15˚C
                                                        0˚30'26.71''E

                                                        41˚3'41.40''N,
                                 Mastroberardino                         ~400 mm      ~750 mm            ~16˚C
                                                        14˚58'53.04''E

                                                       41˚14'54.25''N,
                                    Symington                            ~170 mm      ~540 mm            ~16˚C
                                                        7˚6'32.76''O

DOI: 10.4236/acs.2021.111010                           150                           Atmospheric and Climate Sciences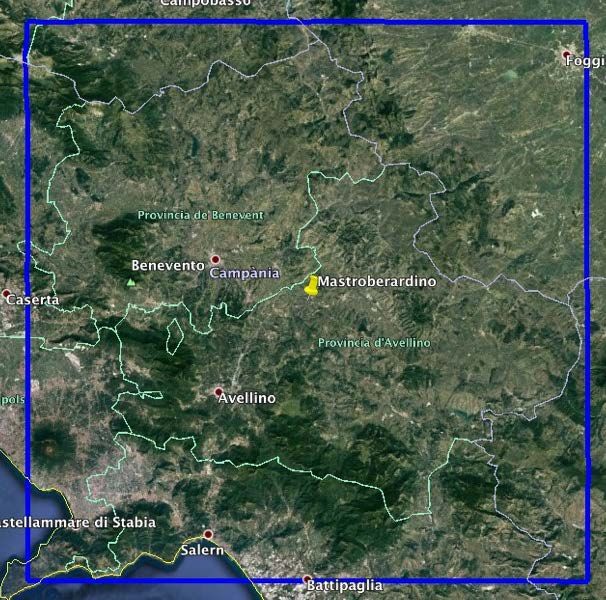
I. Porras et al.

                               steady currents of air, which provides a natural cooling down, conferring a spe-
                               cial microclimate.
                                 The viticulture performed in this plot is ecological, where the green pruning is
                               especially important: buds and leaves thinning is used to adjust the vine’s pro-
                               ductive-vegetative equilibrium. The soil composition consists of lutites (mineral
                               clay and limestone) with sandstone (compact fine sand), and it keeps a vegetal
                               cover that contributes to increasing the biodiversity, plus controlling erosion.
                               Regarding general climate characteristics, Costers del Segre region has a conti-
                               nental climate, with annual rainfall between 300 and 450 mm. Annual average
                               temperature is around 15˚C, but variations among the year are remarkable,
                               going below 0˚C in winter and overpassing 35˚C in summer. The grape varieties
                               in these plots are Chardonnay and Tempranillo.

                               2.1.2. Mastroberardino (Italy)
                               Mastroberardino (https://mastroberardino.com/) is an Italian winery located in
                               the Campania region. The demonstration site is located in Mirabella Eclano Es-
                               tate, in the heart of the Taurasi DO area. The vineyards are surrounded by a
                               large natural landscape, not far from the archaeological excavations of Aecla-
                               num. The estate covers 65 hectares on hill territory with an altitude between 350
                               and 450 meters above sea level. This estate is spread over several hills with dif-
                               ferent exposures and it is dedicated to the production of red grapes on the slopes
                               from the Aglianico variety. Actually, this state is epicentre of Aglianico grape
                               production, research and experimentation. The climate in this area is continen-
                               tal and characterized by large thermal day-night excursions (up to 20˚C). Aver-
                               age annual rainfall is around 750 mm.

                               2.1.3. Symington (Portugal)
                               Symington Family Estates (https://www.symington.com/) is one of the principal
                               Port producers and is the leading vineyard owner in the Douro Valley with a to-
                               tal area of 1006 hectares (2486 acres) of vines spread across 27 Quintas dotted
                               around the Douro’s three sub-regions (Baixo Corgo, Cima Corgo and Douro
                               Superior) in what is the world’s largest mountain vineyard. Portugal’s geograph-
                               ic isolation, as well as some past conservatism on the part of its wine producers
                               has worked in the country’s favour in terms of the preservation of the rich ge-
                               netic diversity of its indigenous grape varieties. The demonstration site, Quinta
                               do Ataíde, is located in Douro Superior and it has in total 85 ha vineyards. It
                               consists of two plots with the variety Touriga Nacional, and one plot with Tou-
                               riga Franca. Although Ataíde has a fairly homogeneous, flat terrain, sandy-loam
                               and loam soil composition, uneven soil drainage has been identified to result in
                               some variance in grape quality. The Douro enjoys its own micro-climate, which
                               is an important reason for the quality and style of its wines. The most important
                               geological features responsible for this are several mountain ranges sheltering it
                               from the Atlantic Ocean influence, giving it a continental climate, with hot and
                               dry summers and cooler and wetter winters. Average annual temperatures range

DOI: 10.4236/acs.2021.111010                        151                          Atmospheric and Climate Sciences
I. Porras et al.

                               from 11.8˚C to 16.5˚C. Rainfall ranges throughout the year from 50.6 mm in the
                               wettest month down to 6.9 mm during the driest month.

                               2.2. Modelling Approach
                               This section summaries the developments carried out for the meteorological
                               components of the VISCA DSS and shows the meteorological and climate mod-
                               els used for each time-scale, from short-term to mid-term weather forecast and
                               from seasonal forecast to climate projections. Figure 1 shows and schema about
                               the different timescales covered by the meteorological and climate models used
                               in the VISCA DSS and the related skill. Since short-term and mid-term weather
                               forecast have pretty good skills the first forecast days, after some days, the skill
                               decreases rapidly. On the other hand, seasonal forecast and climate projections
                               have a constant fair skill along the forecast lead time. The sub-seasonal to sea-
                               sonal timescale was not considered within the project.

                               2.2.1. Short and Mid-Term Weather Forecast
                               During the last years, the use of deterministic Numerical Weather Prediction
                               (NWP) models has increased significantly due to higher accuracy of the models,
                               easier access to community models, computational advances, etc. Despite the
                               inherently uncertainty they can have due to the initial conditions of the atmos-
                               phere, several calibrations can be applied to minimize the discrepancies against
                               the real weather conditions. Due to numerical weather prediction models have a
                               wide range of options to set up: physical options, dynamical options, horizontal
                               model resolution, number of vertical layers and density, etc., it is crucial confi-
                               gurate the model with the properly parametrizations and model options [15]
                               [16].
                                  On the other hand, weather forecasts are inherently uncertain because the ini-
                               tial state of the atmosphere can never be known perfectly, and the model equa-
                               tions must be expressed through approximations and simplification in the model
                               system. Furthermore, even the smallest uncertainties in the initial conditions of
                               the forecast model tend to rapidly increase over time because of the chaotic na-
                               ture of the atmosphere. Therefore, rather than integrating a single forecast from

                               Figure 1. Timescale showing the skill progression from weather and seasonal forecast to
                               climate projections, as used in VISCA DSS. Source: Adapted from iri.columbia.edu/news/
                               qa-subseasonal-prediction-project.

DOI: 10.4236/acs.2021.111010                         152                            Atmospheric and Climate Sciences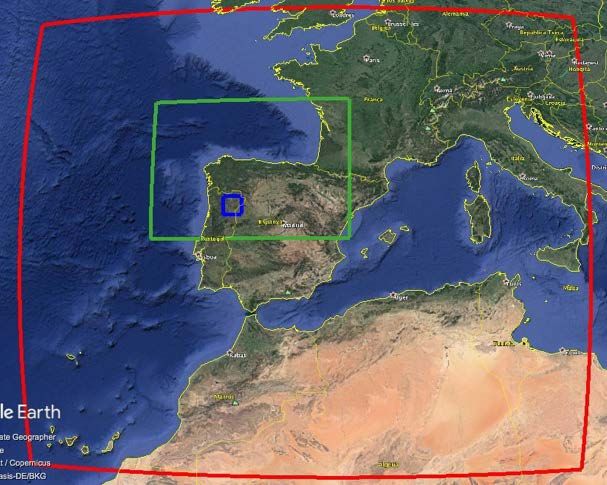
I. Porras et al.

                               a supposedly best guess of the initial state (as was done in short-term forecast-
                               ing), it has been shown that a better approach would be to start the forecast from
                               several slightly different initial conditions and then derive as many, presumably
                               somewhat different, outcomes from these differing initial conditions (Figure 2).
                               This approach is called ensemble forecasting and as outcome, produces forecasts
                               that are given as probability distribution. From these distributions it is possible
                               to calculate local probabilities for different weather events using thresholds.
                                 In this way and within the VISCA framework, the short-term weather data
                               covers the hourly deterministic forecast for the following 48 hours and provides
                               information of the mean temperature, wind speed, accumulated precipitation,
                               relative humidity and downward short-wave flux. The mid-term, on the other
                               hand, it’s a 10-day probabilistic forecast of the same variables.
                                 1) Short-term forecast simulation domains
                                 To ensure that the model represents as many meteorological phenomena as
                               possible in the different meteorological scales (synoptic, mesoscale, microscale),
                               meteorological modelling has been applied to a nested grid architecture defined
                               by three domains. Since Tables 2-4 show the main characteristics of the simula-
                               tion domains, Figures 3-5 show the modelling domain schemes for each
                               end-user demo site area.

                               Figure 2. The principle of ensemble-based probabilistic forecasting. In this example it is
                               shown how 12 different ensemble members evolve in time due to slightly different initial
                               conditions.

                               Table 2. Simulation domains and its characteristics for Codorniu end-user area.

                                                                       CODORNIU end-user

                                    Characteristic                 Domain D01           Domain D02        Domain D03

                                                               South-West Europe and                        Vineyard
                                      Description                                          East Spain
                                                                 North West Africa                        surroundings

                                 Horizontal resolution             9 km × 9 km           3 km × 3 km       1 km × 1 km

                                       Grid size                     370 × 300             310 × 310        100 × 100

                                     Domain size                3330 km × 2700 km      930 km × 930 km   100 km × 100 km

DOI: 10.4236/acs.2021.111010                             153                             Atmospheric and Climate Sciences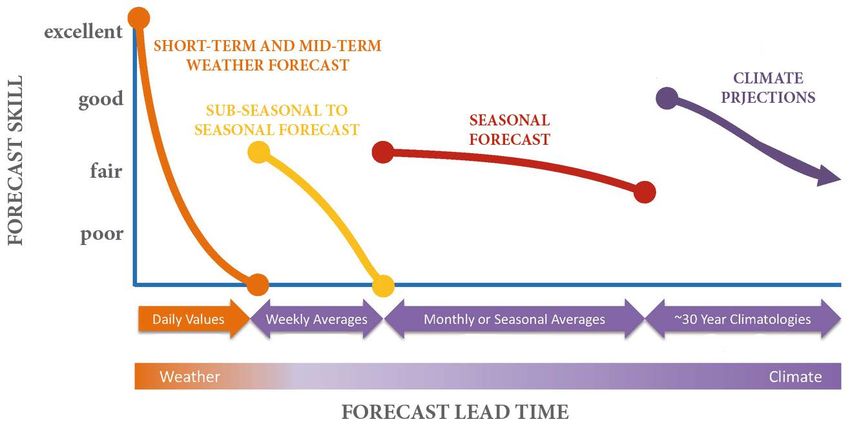
I. Porras et al.

                               Figure 3. Simulation domains for Codorniu end-user located in Spain. 9 km grid resolu-
                               tion domain D01 (red), 3 km grid resolution domain D02 (green) and 1 km grid resolu-
                               tion domain D03 (blue). Images generated using Google Earth.

                               Figure 4. Simulation domains for Mastroberardino end-user located in Italy. 9 km grid
                               resolution domain D01 (red), 3 km grid resolution domain D02 (green) and 1 km grid
                               resolution domain D03 (blue). Images generated using Google Earth.

                               Figure 5. Simulation domains for Symington end-user located in Portugal. 9 km grid res-
                               olution domain D01 (red), 3 km grid resolution domain D02 (green) and 1 km grid reso-
                               lution domain D03 (blue). Images generated using Google Earth.

DOI: 10.4236/acs.2021.111010                         154                            Atmospheric and Climate Sciences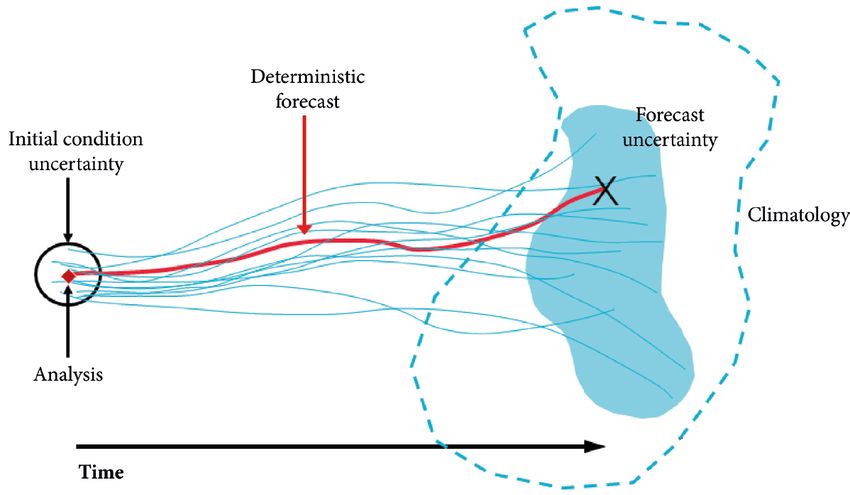
I. Porras et al.

                               Table 3. Simulation domains and its characteristics for Mastroberardino end-user area.

                                                                 MASTROBERARDINO end-user

                                    Characteristic                 Domain D01                Domain D02         Domain D03

                                                            Italy, Nord-West Tunisia,
                                                                                                                  Vineyard
                                     Description           Balkans region, Corsica and        South Italy
                                                                                                                surroundings
                                                           Southern Europe countries

                                 Horizontal resolution              9 km × 9 km               3 km × 3 km       1 km × 1 km

                                       Grid size                     151 × 151                 150 × 150         100 × 100

                                     Domain size                 1350 km × 1350 km          450 km × 450 km   100 km × 100 km

                               Table 4. Simulation domains and its characteristics for Symington end-user area.

                                                                     SYMINGTON end-user

                                    Characteristic               Domain D01                Domain D02          Domain D03

                                                          South-West Europe and      West-north Spain and        Vineyard
                                     Description
                                                            North West Africa          North Portugal          surroundings

                                 Horizontal resolution            9 km × 9 km              3 km × 3 km          1 km × 1 km

                                       Grid size                   370 × 300                370 × 262            100 × 100

                                     Domain size               3330 km × 2700 km         1110 km × 786 km     100 km × 100 km

                                 2) Short-term forecast data set
                                 The regional and mesoscale meteorological model used in the project has been
                               the Weather Research and Forecasting-Advanced Research (WRF-ARW) ver-
                               sion 3.9.1.1 [17], developed by the National Centre of Atmospheric Research
                               (NCAR). It is a universally used community mesoscale model and a state-of-the-art
                               atmospheric modelling system that is applicable for meteorological research,
                               climate scenarios and numerical weather prediction. WRF-ARW is a fully com-
                               pressible and non-hydrostatic model with terrain-following hydrostatic pressure
                               coordinate.
                                 Different options that WRF-ARW offers can be combined in many different
                               ways. WRF-ARW has different parameterizations for microphysics, radiation
                               (long and short wave), cumulus, surface layer, planetary boundary layer and
                               land surface as physical options. To obtain WRF-ARW highest accuracy, it is es-
                               sential to carry out a sensitive analysis of these different options by numerical
                               experiments [17] [18] [19].
                                 In order to reduce the biases of the WRF-ARW model, some improvements
                               have been implemented in order to better perform the precipitation and tem-
                               perature, two of the main variables that directly affect the vineyards. Firstly, we
                               have chosen the parametrization of physical processes of the model that better
                               perform in the area of interest. Many previous studies have evaluated the sensi-
                               tivity of WRF-ARW to several parametrization schemes for regional climates
                               over Europe [20]. They showed how the temperature is significantly dependent
                               on the land surface model. On the other hand, they reveal how averaged daily

DOI: 10.4236/acs.2021.111010                             155                                Atmospheric and Climate Sciences
I. Porras et al.
precipitation appears to be unaffected by the longwave radiation scheme. They
conclude that modelling precipitation is problematic for WRF-ARW with biases
of up to 100%. Other studies presented how the precipitation is directly related
to land surface model and cumulus scheme parametrizations. Vertical distribu-
tion of humidity and temperature were also studied examining the sensitivity of
planetary boundary layer schemes [21].
Secondly, we have investigated the potential improvements in using numerical
weather prediction model data assimilation system to set-up better initial condi-
tions [22]. Data assimilation is the technique for combining observational data
with the model [23]. Within the VISCA framework, the three-dimensional
variational data assimilation (3DVar) system has been implemented into the
WRF-ARW, and the analysis system used was the Grid point Statistical Interpola-
tion (https://ral.ucar.edu/solutions/products/gridpoint-statistical-interpolation-gsi).
3) Mid-term forecast data set
The National Centres for Environmental Prediction (NCEP) is the leading
centre that produces global forecasts. The Global Ensemble Forecast System
(GEFS) forecast ensemble is based upon the notion that erroneous forecasts re-
sult from a combination of initial analysis errors and model deficiencies, the
former dominating during the first five days. Analysis errors amplify mostly in
the sensitive parts of the atmosphere where strong low-pressure areas develop.
These errors then move downstream and amplify and thereby affect the
large-scale flow. To estimate the effect of possible initial analysis errors and the
consequent uncertainty of the forecasts, small changes to the analysis are made
creating an ensemble of many different “perturbed” initial states. In order to
save computational time, the ensemble members are run at a lower (~40 kilome-
tres) spatial resolution.
The GEFS consists of 21 separate forecasts or individual ensemble members
that are created for lead times of up to 16 days (384 hours) four times a day.
However, within the VISCA proposes, GEFS products are considered up to 10
days forecast.
More information about the work done and the results can be found in the
VISCA project website (report on weather forecast extreme events,
https://www.visca.eu/index.php/the-project-4/deliverables-and-scientific-articles
/send/4-delivera-bles-and-scientific-articles/26-visca-deliverable-2-2-report-on-
weather-forecast-extreme-events).
2.2.2. Seasonal Forecast
The production of statistically consistent and reliable predictions is a necessary
condition for the elaboration or climate services. To this aim bias correction and
downscaling techniques have been applied in the development of the VISCA
DSS seasonal forecast. In our case, after comparing the performance of simple
bias correction and calibration approaches, we have chosen the latter as the one
showing the best results [24]. Regarding the spatial scale gap, the VISCA DSS
uses calibration with in-site data as a downscaling adjustment method (after
DOI: 10.4236/acs.2021.111010 156 Atmospheric and Climate SciencesI. Porras et al.
comparing it with a perfect prognosis analog approach that gave a poorer out-
come).
We have also improved the seasonal forecasts trough the combination of sea-
sonal forecasts from several forecast systems in a multi-model ensemble [25]
[26]. The main advantage of the multi-model ensembles comes from a better
consistency and reliability than those ensembles from individual systems [27],
which are essential properties for the probabilistic seasonal forecast to be usable
for decision-making [25] [28]. Nevertheless, the skill enhancement of the mul-
ti-model ensemble compared to the best available forecast system is rather mar-
ginal and limited to some specific regions.
The estimation of the seasonal forecast quality based on its past performance
is a fundamental step to aid end-user decision-making [25], because it allows
quantifying the forecast benefit relative to other prediction approaches. Thus,
seasonal predictions must be systematically compared to a reference (reanalysis
or observations) to assess their overall quality in a multi-faceted process known
as forecast quality assessment [29]. Three sources of uncertainty in common
scoring metrics of probabilistic predictions should be considered: improper es-
timates of probabilities from small-sized ensembles, insufficient number of
forecast cases, and imperfect reference values due to observation errors. A way
to alleviate these problems is to use several scoring measures to offer a compre-
hensive picture of the forecast quality of the system [30] and to apply statistical
inference as often as required. This information is also valuable to decide about
the application of the optimal bias correction and downscaling methods [31].
Hence, this quality assessment framework seeks to provide the end-users with
the tools to understand which approaches could be better for their interests con-
sidering three different probabilistic metrics: fair ranked probability skill score
(FRPSS), fair continuous ranked probability skill score (FCRPSS), reliability dia-
grams; and one deterministic: ensemble-mean correlation.
Within the VISCA framework, the seasonal forecasts provide information for
the temperature and precipitation tercile probability for the next six months
(monthly forecasts) and the next two seasons (3-month aggregation forecasts).
The forecasts have been bias corrected and downscaled following a calibration
procedure. Besides, a multi-model approach has been developed (with little gain
compared to the use of single forecast). They have been also verified considering
four metrics: ensemble correlation, fair ranked probability skill score, fair conti-
nuous probability skill score and reliability diagrams. In all the cases, whenever
the skill of the forecast is worse than the climatology, the climate information is
provided instead of the model forecast.
Seasonal Forecast Data Set
a) Seasonal Forecast System 4 (SEAS4)
SEAS4 is the fourth generation of European Centre of Medium-range Weath-
er Forecasts (ECMWF) seasonal prediction system [32]. Is a fully coupled gener-
al circulation model that provides operational multi-variable seasonal predic-
tions in a real-time basis. In this study we have focused on period 1981-2015.
DOI: 10.4236/acs.2021.111010 157 Atmospheric and Climate SciencesI. Porras et al.
Last 35 years of predictions proceed from the combination of the 30-years hind-
casts with the 5-year regular contemporary pool of predictions. All predictions
have a minimum of 15-member ensemble (51 members for those which start
dates are on 1st day of months February, May, August and November, and at
every month since May 2011) and 7-month’s forecast horizon. The predictions
used for the discussion are those initialized the 1st of November and the 1st of
May. We have used monthly mean data for mean temperature, maximum tem-
perature, minimum temperature and precipitation.
b) Seasonal Forecast System 5 (SEAS5)
SEAS5 is the fifth generation of ECMWF’s seasonal forecasting system [33]. It
replaces the former SEAS4 and uses the Integrated Forecast System (IFS). The
re-forecast of SEAS5 covers a 36-year period, from 1981 to 2017, with an ensem-
ble of 25 members. Compared to the SEAS4 it includes a number of enhance-
ments in the atmospheric resolution, land-surface initialisation and in the ocean
model. In the atmospheric component, there are 9 vertical levels. Regarding the
land-surface initialisation, the SEAS5 includes a new offline recalculation at the
native atmospheric resolution with a revised precipitation forcing. Although this
initialisation is still not perfect (the reanalysis and real-time assimilation are not
the same), the tests performed show a good degree of consistency between the
initialisation of SEAS5 re-forecast and real-time predictions. Finally, the SEAS5
uses the new version of ocean model Nucleus for European Modelling of the
Ocean (NEMO), with and upgraded model version, ocean physics and resolu-
tion.
c) Météo-France System-6 (MF6)
MF6 is the sixth generation of Météo-France long-range prediction system
[34]. The hindcast covers the period 1993-2016 and consists of an ensemble of
25 members. The operational ensemble starts from 2017 and has 51 members.
The ensemble spread is generated by a stochastic dynamics’ technique in addi-
tion to using a lagged initialization. The atmospheric component is the Ar-
pege-IFS [35] which is a complex code designed not only for weather forecast or
climate simulation, but also for data assimilation, forecast pre-and post-processing.
It has been extended, diversified and complexified since 1986 jointly by
Météo-France and ECMWF.
d) Met Office Global Seasonal Forecasting System version 5 (GloSea5)
In VISCA we have used the latest coupled configuration of the GloSea5, in
particular the Global Coupled 2.0 (GloSea5-GC2) [36]. The re-forecast of Glo-
Sea5-GC2 covers a 36-year period, from 1981 to 2016, with an ensemble of 28
members. Overall, the GloSea5-GC2 is shown to be an improvement on the con-
figurations used currently, particularly in terms of modes of variability (e.g.
mid-latitude and tropical cyclone intensities, the Madden–Julian Oscillation and
El Niño Southern Oscillation).
More information about the work done and the results can be found in the
VISCA project website (seasonal forecasts quality assessment report,
https://www.visca.eu/index.php/the-project-4/deliverables-and-scientific-articles
DOI: 10.4236/acs.2021.111010 158 Atmospheric and Climate SciencesI. Porras et al.
/send/4-deliverables-and-scientific-articles/25-visca-deliverable-2-1-seasonal-for
ecasts-quality-assessment-report).
2.2.3. Climate Projections
The purpose of this section is to show an overview of the work done within the
project. The idea was to analyse the change of climate variables which are im-
pacting the most in the viticulture, namely mean precipitation and temperature,
but also temperature and precipitation extreme events for the coming decades
until 2100.
Within the VISCA framework, first of all, a set of climate indices were defined
giving key information about the impact on the wine sector: seasonal tempera-
ture climatology, defined as the mean temperature over a period of a 3-monthly
season; seasonal daily precipitation climatology, defined as the mean of maxi-
mum daily precipitation over a period of a 3-monthly season; and finally, the
Winkler index that classifies a location according to the range of the Growing
Degree-Days (GDD, https://mrcc.illinois.edu/gismaps/info/gddinfo.htm). The
analysis was performed at European scale, but also specific results were provided
for the 3 demo sites provided by the end-users of the project.
Climate Projection Data Set
a) Gridded observational dataset (E-OBS)
E-OBS data has been used as observational dataset. This is a gridded observa-
tional dataset derived through interpolation of the European Climate Assess-
ment and Data (ECA & D, https://www.ecad.eu/) station data described col-
lected at European scale. The station dataset comprises a network of 2316 sta-
tions, with the highest station density in Ireland, the Netherlands and Switzer-
land, and lowest density in Spain, Northern Africa, the Balkans and Northern
Scandinavia. The number of stations used for the interpolation differs through
time and by variable.
The E-OBS dataset is derived through a three-stage process:
Monthly means of temperature and precipitation are first interpolated to a
0.1-degree latitude by longitude grid using three-dimensional (latitude, lon-
gitude, elevation) thin plate splines.
Daily anomalies, defined as the departure from the monthly mean tempera-
ture or precipitation, are interpolated to the same 0.1-degree grid, and com-
bined with the monthly mean grid. For temperature, daily anomalies are in-
terpolated using kriging with elevation as an external variable. For precipita-
tion kriging is first used o interpolate the state (wet/dry); after that the mag-
nitude at ‘wet’ 0.1-degree grid points is interpolated using universal kriging.
Finally, the 0.1-degree points are used to compute area-average values at the
four E-OBS grid resolutions (0.25-degree and 0.5-degree regular lati-
tude-longitude grid and 0.22-degree and 0.44-degree Lat-Lon rotated-pole
grids).
In the present study the 0.22-degree Lat-Lon rotated-pole grid has been used,
because it coincides with the grid of EURO-CORDEX grid (see chapter below).
DOI: 10.4236/acs.2021.111010 159 Atmospheric and Climate SciencesI. Porras et al.
The full dataset covers the period from 1950 to 2017 (both included).
b) EURO-CORDEX climate projections
EURO-CORDEX (https://www.euro-cordex.net/) is the European branch of
the international CORDEX initiative, which is a program sponsored by the
World Climate Research Program (WRCP) to organize an internationally coor-
dinated framework to produce improved regional climate change projections for
all land regions world-wide. The CORDEX-results are being used worldwide to
assess for climate change impact and to feed adaptation studies within the time-
line of the Fifth Assessment Report (AR5) of the Intergovernmental Panel on
Climate Change (IPCC) and beyond.
EURO-CORDEX consists of a set of simulations provided by the participating
groups. Nowadays, mainly dynamical downscaling simulations are available,
namely the output of a regional climate model (RCM) coupled to a Global Cli-
mate Model (GCM) or a Reanalysis. The outputs of these simulations are availa-
ble on rotated-pole regular grids at 0.11 degrees of horizontal resolution (~12
km, depending on the latitude). They are free to download from Earth System
Grid Federation (ESGF) nodes like https://esgf-data.dkrz.de/projects/esgf-dkrz/.
More information about the work done and the results can be found in the
VISCA project website (decadal projection performance report,
https://www.visca.eu/index.php/the-project-4/deliverables-and-scientific-articles
/send/4-deliverables-and-scientific-articles/83-2-5).
3. Conclusions
The extension and the quality of wine production are strongly related to the en-
vironmental conditions of the grape growing season. Grapevine growing factors
are determined within a narrow climatic range in which the adequate heat ac-
cumulation, the availability of enough water and the low risk of extreme tem-
perature episodes are required. As an example, in 2017 a historically low pro-
duction (8% less in comparison with 2016) was registered due to climate condi-
tions.
While climate patterns can differ radically from one year to another (climate
variability), climate change is more concerning, because a significant shift in the
long-term climatology would make the wine business unsustainable. Adaptation
measures are most probably needed to adapt the current grape varieties to war-
mer climate conditions and the presence of more frequent and more intense ex-
treme events such as heat waves, heavy rainy or long dry spells.
Future suitability of a certain viticulture region highly depends on the change
on the mean patterns on temperature and precipitation in the coming decades,
but also on the impact of extreme temperature and precipitation. For that rea-
son, estimation regional changes in temperature and precipitation and the de-
rived impacts on the suitability of vine cultivation are of paramount importance
for the business of gives critical information for making strategic decisions and
investments in the near future, which will make the industry more resilient and
adapted to climate change.
DOI: 10.4236/acs.2021.111010 160 Atmospheric and Climate SciencesI. Porras et al.
The VISCA DSS is a tool that integrates meteorological and climate informa-
tion, among others, in order to provide well-funded information to the end-users
to design medium- and long-term adaptation strategies to climate change on vi-
neyards; foresee extreme events at short and medium time-scales; ease the deci-
sion-making planning months ahead through the use of seasonal predictions
and the development of strategies thanks to the climate projections. In this paper
we have shown the meteorological, seasonal and climatic models, and the data
sets used to answer the viticulturist needs for all time-scales.
As a short-term weather model, we have used the WRF-ARW version 3.9.1.1,
providing hourly forecast information for the following 48 hours for those in-
teresting variables for viticulturists: mean temperature, wind speed, accumulated
precipitation, relative humidity and downward short-wave flux.
GEFS information has been used to compute probabilistic forecast up to
10-days in advance for the same variables.
SEAS4, SEAS5, MF6 and GloSea5 seasonal prediction systems have been used
to compute the seasonal forecast. This provides information for the temperature
and precipitation tercile probability for the next six months (monthly forecasts)
and the next two seasons (3-month aggregation forecasts).
Within the climate projections, we have used E-OBS data to perform climatic
indices related to the wine sector and EURO-CORDEX climate projections to
analyse the projected change over the period 2010-2099.
More information about the work done and the results can be found in the
VISCA project website: Report on weather forecast extreme events,
https://www.visca.eu/index.php/the-project-4/deliverables-and-scientific-articles
/send/4-delivera-bles-and-scientific-articles/26-visca-deliverable-2-2-report-on-
weather-forecast-extreme-events; Seasonal forecasts quality assessment report,
https://www.visca.eu/index.php/the-project-4/deliverables-and-scientific-articles
/send/4-deliverables-and-scientific-articles/25-visca-deliverable-2-1-seasonal-for
ecasts-quality-assessment-report; Decadal projection performance report,
https://www.visca.eu/index.php/the-project-4/deliverables-and-scientific-articles
/send/4-deliverables-and-scientific-articles/83-2-5.
Acknowledgements
This work has been developed within the framework of the project VISCA (Vi-
neyards’ Integrated Smart Climate Application), an R&I project co-funded un-
der the Horizon 2020 programme with a total budget of 3.20 M€. The authors
gratefully acknowledge VISCA consortium, composed of 11 members from dif-
ferent fields including end-users (Codorniu, Mastroberardino and Symington),
for their support and collaboration.
Conflicts of Interest
The authors declare no conflicts of interest regarding the publication of this pa-
per.
DOI: 10.4236/acs.2021.111010 161 Atmospheric and Climate SciencesI. Porras et al.
References
[1] Intergovernmental Panel on Climate Change (2019) Climate Change and Land: An
IPCC Special Report on Climate Change, Desertification, Land Degradation, Sustainable
Land Management, Food Security, and Greenhouse Gas Fluxes in Terrestrial Ecosys-
tems.
https://www.ipcc.ch/site/assets/uploads/2019/11/SRCCL-Full-Report-Compiled-191
128.pdf
[2] United States Environmental Protection Agency (n.d.) Climate Change Indicators:
Weather and Climate. https://www.epa.gov/climate-indicators/weather-climate
[3] Working at Bio Intelligence Service (2012) Literature Review on the Potential Cli-
mate Change Effects on Drinking Water Resources across the EU and the Identifi-
cation of Priorities among Different Types of Drinking Water Supplies. Contract
Number 070326/SER/2011/610284/D1.
https://ec.europa.eu/environment/archives/water/adaptation/pdf/ADWICE_FinalR
eport.pdf
[4] Singh, S. and Tiwari, S. (2019) Climate Change, Water and Wastewater Treatment:
Interrelationship and Consequences. In: Singh, R., Kolok, A. and Bartelt-Hunt. S.,
Eds., Water Conservation, Recycling and Reuse: Issues and Challenges, Springer,
Singapore, 203-214. https://doi.org/10.1007/978-981-13-3179-4_11
[5] Food and Agriculture Organization (2009) Global Agriculture towards 2050.
http://www.fao.org/fileadmin/templates/wsfs/docs/Issues_papers/HLEF2050_Globa
l_Agriculture.pdf
[6] Science Communication Unit, University of the West of England, Bristol (2013)
Science for Environment Policy In-Depth Report: Sustainable Food.
https://ec.europa.eu/environment/integration/research/newsalert/pdf/sustainable_f
ood_IR8_en.pdf
[7] Food and Agriculture Organization, International Fund for Agricultural Develop-
ment, United Nations Children’s Fund, World Food Programme and World Health
Organization (2020) The State of Food Security and Nutrition in the World 2020.
Transforming Food Systems for Affordable Healthy Diets. Food and Agriculture
Organization, Rome.
[8] Metzger, M.J. and Rounsevell, M.D.A. (2011) A Need for Planned Adaptation to
Climate Change in the Wine Industry. Environmental Research Letters, 6, Article
ID: 031001. https://doi.org/10.1088/1748-9326/6/3/031001
[9] Hannah, L., Roehrdanz, P., Ikegami, M., Shepard, A., Shaw, M., Tabor, G., Zhi, L.,
Marquet, P. and Hijmans, R. (2013) Climate Change, Wine, and Conservation.
Proceedings of the National Academy of Sciences of the United States of America,
110, 6907-6912. https://doi.org/10.1073/pnas.1210127110
[10] Keller, M. (2010) Managing Grapevines to Optimise Fruit Development in a Chal-
lenging Environment: A Climate Change Primer for Viticulturists. Australian Jour-
nal of Grape and Wine Research, 16, 56-69.
https://doi.org/10.1111/j.1755-0238.2009.00077.x
[11] Chloupek, O., Hrstkova, P. and Schweigert, P. (2004) Yield and Its Stability, Crop
Diversity, Adaptability and Response to Climate Change, Weather and Fertilisation
over 75 Years in the Czech Republic in Comparison to Some European Countries.
Field Crops Research, 85, 167-190. https://doi.org/10.1016/S0378-4290(03)00162-X
[12] Mosedale, J., Abernethy, K., Smart, R., Wilson, R. and Maclean, I. (2016) Climate
Change Impacts and Adaptive Strategies: Lessons from the Grapevine. Global
Change Biology, 22, 3814-3828. https://doi.org/10.1111/gcb.13406
DOI: 10.4236/acs.2021.111010 162 Atmospheric and Climate SciencesI. Porras et al.
[13] Viguie, V., Lecocq, F. and Touzard, J.M. (2014) Viticulture and Adaptation to Climate
Change. Journal International des Sciences de la Vigne et du Vin, hal-00982086, 55-60.
https://hal-enpc.archives-ouvertes.fr/hal-00982086/document
[14] Adapting Viticulture to Climate Change (2016) Adapting Viticulture to Climate
Change: Guidance Manual to Support Winegrowers’ Decision-Making.
https://www.adviclim.eu/wp-content/uploads/2015/06/B1-deliverable.pdf
[15] Reboredo, B., Arasa, R. and Codina, B. (2015) Evaluating Sensitivity to Different
Options and Parameterizations of a Coupled Air Quality Modelling System over
Bogotá, Colombia. Part I: WRF Model Configuration. Open Journal of Air Pollution, 4,
47-64. http://dx.doi.org/10.4236/ojap.2015.42006
[16] Arasa, R., Porras, I., Domingo-Dalmau, A., Picanyol, M., Codina, B., González, M.
(2016) Defining a Standard Methodology to Obtain Optimum WRF Configuration
for Operational Forecast: Application over the Port of Huelva (Southern Spain).
Atmospheric and Climate Sciences, 6, 329-350.
http://dx.doi.org/10.4236/acs.2016.62028
[17] Skamarock, W.C., Klemp, J.B., Dudhia, J., Gill, D.O., Barker, D.M., Duda, M.G.,
Huang, X.-Y., Wang, W. and Powers, J.G. (2008) A Description of the Advanced
Research WRF Version 3. No. NCAR/TN-475+STR, University Corporation for
Atmospheric Research, Boulder. http://dx.doi.org/10.5065/D68S4MVH
[18] Arasa, R., Soler, M.R. and Olid, M. (2012) Evaluating the Performance of a Region-
al-Scale Photochemical Modelling System: Part I. Ozone Predictions. International
Scholarly Research Notices, 2012, Article ID: 860234.
https://doi.org/10.5402/2012/860234
[19] Saha, S., Moorthi, S., Wu, X., Wang, J., Nadiga, S., Tripp, P., Behringer, D., Hou,
Y.-T., Chuang, H.-Y., Iredell, M., Ek, M., Meng, J., Yang, R., Peña, M., Van den
Dool, H., Zhang, Q., Wang, W., Chen, M. and Becker, E. (2014) The NCEP Climate
Forecast System Version 2. Journal of Climate, 27, 2185-2208.
https://doi.org/10.1175/JCLI-D-12-00823.1
[20] Mooney, P.A., Mulligan, F.J. and Fealy, R. (2013) Evaluation of the Sensitivity of the
Weather Research and Forecasting Model to Parameterization Schemes for Regional
Climates of Europe over the Period 1990-95. Journal of Climate, 26, 1002-1017.
https://doi.org/10.1175/JCLI-D-11-00676.1
[21] Stergiou, I., Tagaris, E. and Sotiropoulou, R. (2017) Sensitivity Assessment of WRF
Parameterizations over Europe. Proceedings of the 2nd International Electronic
Conference on Atmospheric Sciences, 16-31 July 2017, 119.
https://doi.org/10.3390/ecas2017-04138
[22] Yang, J.H., Dua, K.Q., Wu, J.K., Qin, X., Shi, P.H., Liu, H.C., et al. (2014) Effect of
Data Assimilation Using WRF-3DVAR for Heavy Rain Prediction on the Northeas-
tern Edge of the Tibetan Plateau. Advances in Meteorology, 2015, Article ID 294589.
https://doi.org/10.1155/2015/294589
[23] Kleist, D., Parrish, D.F., Derber, J.C., Treadon, R., Wu, W. and Lord, S. (2009) In-
troduction of the GSI into the NCEP Global Data Assimilation system. Weather and
Forecasting, 24, 1691-1705. https://doi.org/10.1175/2009WAF2222201.1
[24] Torralba, V., Doblas-Reyes, F.J. and Gonzalez-Reviriego, N. (2017) Uncertainty in
Recent Near-Surface Wind Speed Trends: A Global Reanalysis Intercomparison.
Environmental Research Letters, 12, Article ID: 114019.
https://doi.org/10.1088/1748-9326/aa8a58
[25] Doblas-Reyes, F.J., Pavan, V. and Stephenson, D. (2003) The Skill of Multi-Model
Seasonal Forecasts of the Wintertime North Atlantic Oscillation. Climate Dynamics,
DOI: 10.4236/acs.2021.111010 163 Atmospheric and Climate SciencesI. Porras et al.
21, 501-514. https://doi.org/10.1007/s00382-003-0350-4
[26] Weigel, A.P., Liniger, M. and Appenzeller, C. (2008) Can Multi-Model Combina-
tion Really Enhance the Prediction Skill of Probabilistic Ensemble Forecasts? Quar-
terly Journal of the Royal Meteorological Society, 134, 241-260.
https://doi.org/10.1002/qj.210
[27] Hagedorn, R., Doblas-Reyes, F.J. and Palmer, T.N. (2005) The Rationale behind the
Success of Multi-Model Ensembles in Seasonal Forecasting—I. Basic Concept. Tel-
lus A, 57, 219-233. https://doi.org/10.3402/tellusa.v57i3.14657
[28] Alessandrini, S., Sperati, S. and Pinson, P. (2013) A Comparison between the
ECMWF and COSMO Ensemble Prediction Systems Applied to Short-Term Wind
Power Forecasting on Real Data. Applied Energy, 107, 271-280.
https://doi.org/10.1016/j.apenergy.2013.02.041
[29] Mason, S.J. and Baddour, O. (2008) Statistical Modelling, in Seasonal Climate: Fo-
recasting and Managing Risk. Springer, Dordrecht, 167-206.
[30] Jolliffe, I. and Stephenson, D. (2012) Forecast Verification: A Practitioner’s Guide in
Atmospheric Science. Wiley and Sons, 240 p.
[31] Ruffault, J., Martin-StPaul, N.K. and Duffet, C. (2014) Projecting Future Drought in
Mediterranean Forests: Bias Correction of Climate Models Matters! Theoretical and
Applied Climatology, 117, 113-122. https://doi.org/10.1007/s00704-013-0992-z
[32] Molteni, F., Stockdale, T., Balmaseda, M., Balsamo, G., Buizza, R., Ferranti, L.,
Magnusson, L., Mogensen, K., Palmer, T. and Vitart, F. (2011) The New ECMWF
Seasonal Forecast System (System 4). No. 656, European Centre for Medium-Range
Weather Forecasts, Reading. http://dx.doi.org/10.21957/4nery093i
[33] European Centre for Medium-Range Weather Forecasts (2017) SEAS5 User Guide.
https://www.ecmwf.int/sites/default/files/medialibrary/2017-10/System5_guide.pdf
[34] Documentation of the METEO-FRANCE Pre-Operational Seasonal Forecasting System
(2017).
https://www.umr-cnrm.fr/IMG/pdf/system6-technical.pdf
[35] Déqué, M., Dreveton, C. and Braun, A. (1994) The ARPEGE/IFS Atmosphere Mod-
el: A Contribution to the French Community Climate Modelling. Climate Dynam-
ics, 10, 249-266. https://doi.org/10.1007/BF00208992
[36] Met Office Seasonal Prediction System: GloSea5.
https://www.metoffice.gov.uk/research/climate/seasonal-to-decadal/gpc-outlooks/u
ser-guide/technical-glosea5
DOI: 10.4236/acs.2021.111010 164 Atmospheric and Climate SciencesYou can also read