Mining Map Interaction Semantics in web-based Geographic Information Systems (WebGIS) for Usability Analysis
←
→
Page content transcription
If your browser does not render page correctly, please read the page content below
AGILE: GIScience Series, 2, 16, 2021. https://doi.org/10.5194/agile-giss-2-16-2021
Proceedings of the 24th AGILE Conference on Geographic Information Science, 2021.
Editors: Panagiotis Partsinevelos, Phaedon Kyriakidis, and Marinos Kavouras.
This contribution underwent peer review based on a full paper submission.
© Author(s) 2021. This work is distributed under the Creative Commons Attribution 4.0 License.

Mining Map Interaction Semantics in web-based Geographic
Information Systems (WebGIS) for Usability Analysis
René Unrau, Christian Kray

r.unrau@uni-muenster.de, c.kray@uni-muenster.de

Institute for Geoinformatics, University of Münster, Germany

Abstract. Due to the increased availability of geospa-                          extensive map search engines like Google Maps1 for
tial data, web-based geographic information systems                             contemporary points of interests, fully-featured map
(WebGIS) have become more popular in recent years.                              builder and exploration tools like the ArcGIS Map
However, the usability of these systems poses new                               Viewer2 for businesses and organizations as well as
challenges as user interactions are strongly affected                           open government initiatives for citizen participation
by the map and are thus different from interactions                             in urban planning processes (Rall et al., 2019). Some
with traditional user interface elements. In this pa-                           of these systems with extensive functionality may re-
per, we propose a method for evaluating the usabil-                             quire complex user interfaces while, for example, a
ity of web-based geographic information systems by                              visualization of search results is only built for sim-
analyzing user intentions through map interaction pat-                          ple purposes (Fechner et al., 2015; Lobo et al., 2015;
terns. We use a pattern mining algorithm to extract fre-                        Roth and MacEachren, 2016). Thus, users’ knowl-
quent interaction sequences from user sessions and la-                          edge of geospatial visualization and interactions dif-
bel these with their interaction semantics that repre-                          fers greatly and the design of user interfaces (UIs)
sent the users’ immediate intentions. To evaluate our                           might yield diverse and potentially conflicting require-
approach, we conducted a user study with 60 partic-                             ment (Roth et al., 2015b; Hoover et al., 2014; Traynor
ipants in a WebGIS scenario and identified varying                              and Williams, 1995). However, all users expect good
user strategies for a selection task based on two dif-                          usability. As a result, designing WebGIS UIs is dif-
ferent geovisualizations. Our results indicate that the                         ficult and requires evaluation approaches that go be-
chosen approach can uncover the underlying intentions                           yond efficiency and effectiveness to evaluate the us-
of users’ interaction patterns and facilitate insights into                     ability (Rzeszewski and Kotus, 2019; Poplin et al.,
the usability of WebGIS.                                                        2017; Kiefer et al., 2017).

Keywords. template, formatting, reproducible paper                              Evaluating the usability of a WebGIS is difficult, too,
guidelines                                                                      as the map represents a central component and is thus
                                                                                the target of most interactions. Compared to traditional
                                                                                UI elements (such as buttons, sliders, and dropdowns)
                                                                                interactions with the map are more strongly affected by
                                                                                its state. For example, the current scale of the map sig-
1    Introduction                                                               nificantly affects users’ zoom interactions for a given
                                                                                task. If the zoom level is badly chosen for a specific
The increased availability of geospatial data, public                           task users might need longer, are dissatisfied with their
participation initiatives, and the technical capabilities                       experience, or even unable to finish. Treating map in-
of modern web browsers have led to the proliferation of                         teractions like any other functionality can cause prob-
web-based geographic information systems (WebGIS)                               lems and misunderstanding as they have a significant
across multiple platforms (mobile and desktop) in re-                           impact on how successful users are when accessing
cent years. As a result, the variety of WebGIS contents                         a WebGIS and considerably affect which UI elements
and applications has grown and includes, for example,
                                                                                    1
                                                                                        https://www.google.com/maps/
                                                                                    2
                                                                                        https://www.arcgis.com/apps/mapviewer/index.html

                                                                                                                                     1 of 11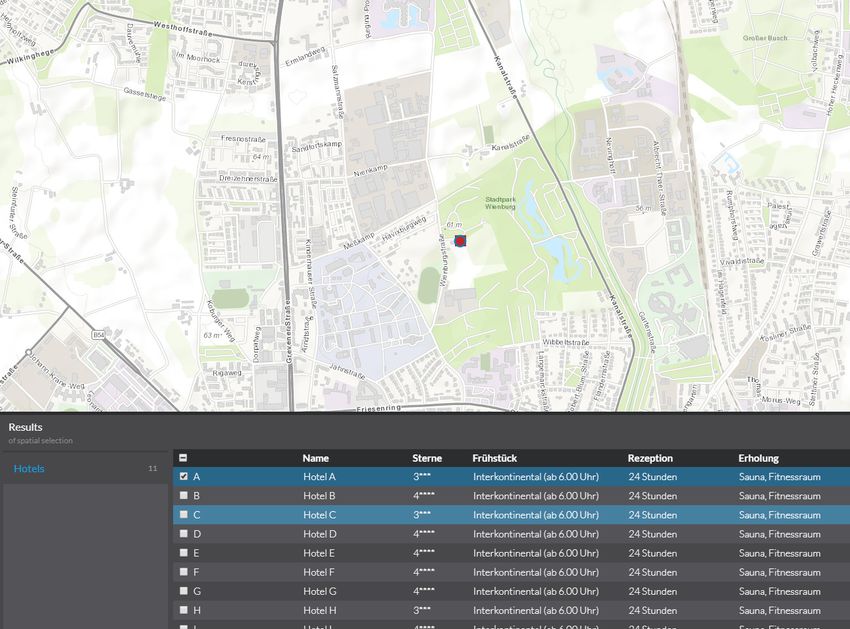
are used in which order and how often. Consequently,                   scale navigation as well as user session analysis and
the map state and multi-scale navigation technique af-                 map interaction semantics. Next, we provide the moti-
fects the efficiency, effectiveness and satisfaction of                vation and rationale for our approach and describe the
users. It is, therefore, essential to thoroughly evaluate              steps that are required to generate map interaction se-
map interactions to understand these issues better and                 mantics. In section four, we evaluate the approach in a
to assess the usability of WebGIS.                                     realistic user study that we conducted with 60 partici-
Companies like Google have been doing work on the                      pants. The discussion section gives an overview of the
usability of their web mapping products for more than                  implications and limitations of the obtained results and
10 years (Riegelsberger and Nakhimovsky, 2008). To                     our approach. The paper concludes with a summary of
create interaction models that are independent of a par-               our key findings and contributions.
ticular interface, research in the field of cartography
has evolved taxonomies and topologies that describe
single actions such as search, selection, and manip-                   2     Related Work
ulation (Crampton, 2002; Roth, 2012) in geographic
maps. Recording and analyzing such actions allows for
                                                                       In this section, we present work that is related to We-
optimizations of, for example, the ratio of displayed
                                                                       bGIS evaluation scenarios and software instrumenta-
information or recommendations of individual spatial
                                                                       tion in this domain. First, we provide an introduction
content (Tahir et al., 2012; Aoidh et al., 2009; Weak-
                                                                       to multi-scale navigation. Second, we discuss existing
liam et al., 2005). Despite this trend, there is only few
                                                                       evaluation approaches that use map interactions to an-
research that analyzes the semantics of map interaction
                                                                       alyze user behavior. Finally, we show how map inter-
sequences and thus the usability of the used WebGIS
                                                                       action semantics have been defined and manually de-
(Roth and MacEachren, 2016; Unrau et al., 2017). Map
                                                                       rived in previous work to detect the underlying user
interaction semantics are the logical aspects of the pro-
                                                                       intentions.
cess that underlies the user’s actions and thus reflect
the user’s immediate intentions. The interpretation of
interaction patterns through semantic descriptions may                 2.1   Multi-scale navigation
facilitate the understanding of these intentions and re-
veal further insights into the usability of the application            Multi-scale navigation is a technique that is used by
that would otherwise remain hidden.                                    systems with varying uses of space, time or visual ef-
In this paper, we propose an approach for identifying                  fect to allow users to attain both focused and contex-
and analyzing map interaction semantics in geospatial                  tual views of their information space (Cockburn et al.,
tasks for usability assessment. We (a) instrument We-                  2009). It was developed to address the breadth of in-
bGIS clients to collect map interactions, (b) apply data               formation that often can’t be conveniently displayed
mining techniques to retrieve recurring patterns of ac-                at one time on a single screen or view. The result-
tion sequences from this data, and (c) create labels for               ing interfaces allow users to work at multiple levels
the resulting map interaction semantics to (d) analyze                 of detail. Evaluations of multi-scale navigation need
the users’ behavior for usability assessment. To evalu-                to identify effective and ineffective uses of these in-
ate our approach, we conducted a user study with 60                    terfaces. Therefore, terms like the level of details or
participants in a WebGIS scenario. While the overall                   the visible extent are translated into a computational
goal for all participants was the same, we created two                 model, which is used to calculate an analytic solution
different geovisualizations and analyzed differences in                for optimal animations (Furnas and Bederson, 1995).
the map interaction semantics. In contrast to traditional              These models can be tested via user experiments that
usability measures, our approach explicitly considers                  include free parameters like animation speed. For ex-
the semantics of map interactions and facilitates the                  ample, JellyLens is a context-aware and adaptive lense
comparison of user strategies in WebGIS workflows                      technique that smoothly integrates two levels of details
beyond efficiency and error rates.                                     in one view (Pindat et al., 2012). In a controlled experi-
                                                                       ment the authors showed that this improves the visibil-
Our contributions are (1) a new approach for evaluating
                                                                       ity of content in the focus region and preserves a larger
the usability of WebGIS by comparing map interaction
                                                                       part of the context region. Similarly, PolyZoom allows
semantics through empirically derived interaction pat-
                                                                       multi scale and multi focus exploration of 2D spaces by
terns; and (2) the usability assessment of an adapted
                                                                       building hierarchies of focus regions, stacked on each
geovisualization method for a selection task based on
                                                                       other such that each subsequent level shows a higher
our approach. Although we only investigate a small set
                                                                       magnification (Javed et al., 2012). In their validation,
of map interactions (pan, zoom-in/-out, and select), our
                                                                       the authors showed that this approach performed better
approach is the first step towards a usability assessment
                                                                       then contemporary standard techniques. These evalua-
for WebGIS based on map interaction semantics.
                                                                       tions usually include quantitative measures such as the
The remainder of this paper is structured as follows:                  task completion time, number of interactions, and er-
First, we review related work in the fields of multi-                  ror rate to rate the effectiveness of novel approaches.

AGILE: GIScience Series, 2, 16, 2021 | https://doi.org/10.5194/agile-giss-2-16-2021                                       2 of 11
In this paper, we aim to go beyond these numerical re- into patterns, the analysis of user intentions for usabil-
sults and evaluate the usability of an interface by in- ity evaluation has not been evaluated yet.
terpreting the exact interaction patterns of participants Roth developed the idea of interaction primitives for
and analyzing their sessions. cartographic interfaces by giving an overview of ex-
isting taxonomies that focus on the stages of interac-
2.2 User Session Analysis tion (Roth, 2012). He investigated the usability of a
WebGIS by creating relationships between interaction
In the past, large-scale analyses of map interaction data primitives and intentions to articulate user personas in
have been conducted for various reasons. For exam- a controlled interaction study (Roth and MacEachren,
ple, Aoidh et al. investigated mouse trajectories on the 2016). In this paper, we take the next logical step be-
map element to understand the geospatial interests of yond prior research, reporting on a large-scale user
users (Aoidh et al., 2009). They captured the users’ study to learn how variations of the UI impact users’
mouse movements, clustered the geographic locations intentions for WebGIS. In particular, we will answer
of the mouse cursor positions and visualized the re- the question if different map-based UIs have an impact
sults for exploratory analysis on a new map. Although on the users’ interaction patterns for a predefined task.
this approach is sufficient for obtaining insights into
the geospatial interests of users, it does not incorporate
interactions with traditional UI elements that may pro- 3 Approach
vide tools for working with the geospatial data on the
map. When a user moves the mouse cursor to a UI el- The overall goal of our approach is to detect common
ement next to the map (e.g., to toggle between various interaction patterns in WebGIS sessions and provide
geographic layers) a gap between the following mouse semantic labels which aim to describe the users’ imme-
cursor positions is created (Tahir et al., 2012). diate intentions. We thus complement traditional met-
Using eye-tracking for data collection is in particular rics to evaluate the efficiency and effectiveness by ex-
interesting for applications that focus on exploratory plicitly capturing map-related aspects and interactions.
usages, such as WebGIS which governmental author- To accomplish this task, we design and evaluate a pro-
ities provide to integrate citizens into planning pro- totypical toolkit for integration into existing WebGIS
cesses. By tracking the users’ focus points and focus that combines tailored data collection and pattern min-
duration, eye-tracking has been applied for investigat- ing techniques. The resulting map interaction seman-
ing map interactions (May and Gamble, 2014; Kiefer tics may facilitate the identification of usability issues
et al., 2017; Manson et al., 2012) or users’ exploration and support the improvement of map UIs.
of buttons and icons (Alaçam and Dalcı, 2009; Çöl- To capture the users’ map interactions, we instrument
tekin et al., 2009) in WebGIS. However, additional the client software of a WebGIS and send logs with
hardware is required and needs to be calibrated for meta information to a central database. Next, we iden-
each user. tify common interaction sequences by applying a well-
known pattern mining algorithm to this dataset. Fi-
2.3 Map Interaction Semantics nally, we manually interpret these patterns and assign
semantic labels. The first part of this non-intrusive and
Sequential patterns of map interactions can be ex- scalable approach can be automated and is, therefore,
tracted for interpreting the users’ intentions and pro- implemented into a holistic toolkit that collects the re-
vide helpful information. For example, Hiramoto et quired data and extracts map interaction patterns for
al. defined operation chunks and complex chunks to analysis. In the following, we provide an overview of
query the web for information related to the users’ each step.
map interactions and visible contents (Hiramoto and
Sumiya, 2006). Operation chunks describe “opera- 3.1 Software Instrumentation
tion sequences that carry meaning“ and complex
chunks “reflect the users’ intentions“. A hierarchy Instrumenting software for usability analysis has be-
of operations (e.g., panning), operation chunks (e.g., come a common technique in HCI research (Lazar
narrowing-down) and complex chunks (e.g., com- et al., 2010). The goal is to collect the required data
paring points) can then be used to conclude from automatically and facilitate remote user studies. Al-
the users’ behavior. Hirose et al. extended this ap- though the initial development cost might be higher,
proach and enhanced map interfaces with an additional the instrumented software can be mass deployed and
overview map (Hirose et al., 2007). They also provide a thus reduce the effort for experimenters. Furthermore,
link between the inferred intention and the spatial con- instrumenting software allows the conduction of user
tent by determining the center point or a spatial area studies in the user’s environment and, thereby, reduces
for complex chunks. Although their model represents experimenter bias and novelty effects. As modern We-
a good baseline for aggregating single map interactions bGIS use a variety of web browser technologies to
AGILE: GIScience Series, 2, 16, 2021 | https://doi.org/10.5194/agile-giss-2-16-2021 3 of 11provide tools for displaying, editing and analyzing In our logging module we add additional metadata,
geospatial data, many user interactions cannot be re- such as the timestamp, to the event data and send the
trieved from server logs but must be collected from information to our second software component.
within the client (i.e., the users’ web browser). To im- We used the open-source database engine Elastic-
plement our approach for the evaluation, we make use search4 as a central archive that runs on a central
of three software components. server. Elasticsearch provides a schema-less index and
First, we instrument the JavaScript source code of the can thus be filled with custom data fields without ad-
WebGIS client by connecting user interaction events justing the data model. These capabilities ensure that
with a custom logging script. Most WebGIS rely on our approach is customizable and facilitates the real-
mapping frameworks to provide geographic maps and ization of further logging scenarios in the future with
tools in web browsers (Roth et al., 2015a). Frequently, little effort.
these frameworks already provide programming inter- Finally, in our third software component, we extract
faces that allow developers to subscribe to user inter- patterns in the logged data via a python script that au-
action events and can thus be used for our purpose. For tomatically retrieves the map interaction data from our
our evaluation, we connected our logging script to the Elasticsearch instance and extends an implementation
ArcGIS API for JavaScript3 and subscribed to the fol- of GSP (Prado Lima, 2019) to mine the recorded user
lowing events which may be carried out via various in- sessions for reoccurring patterns.
put types (e.g., mouse click, keyboard, touch gestures):
3.2 Sequential Pattern Mining
• Zoom In (I) Increasing the scale of the map to
reveal more details.
WebGIS capabilities are usually limited compared to
• Zoom Out (O) Decreasing the scale of the map rich desktop GIS because WebGIS are accessed via
to get an overview. web browsers and sometimes mobile devices with less
computing power. For example, WebGIS do not pro-
• Pan (P) Moving the visible extent without chang- vide extensive functionality for creating custom maps
ing the scale to explore the map content. and analyzing large datasets in the client but instead
consume preprocessed data and provide carefully se-
• Select (S) Selecting a map entry to reveal more lected tools. Therefore, most WebGIS are built with fo-
details about it or adding it to a collection cused scenarios in mind and designers strive to identify
the most usable interface for the task at hand. Never-
However, our implementation is framework agnos- theless, these scenarios may consist of multiple steps
tic and accepts any events that are configured on that result in numerous (map) interactions and are thus
startup. Listing 1 shows a JavaScript code snippet that difficult to interpret. The extraction of recurring inter-
demonstrates how events of a mapping framework are action patterns facilitates the identification of typical
connected to our logging module. This lightweight ap- user behavior which, then, must be analyzed.
proach allows developers to easily instrument the code We will make use of Sequential Pattern Mining for this
of other WebGIS clients as they only need to learn the extraction process. Sequential pattern mining is an area
interfaces for retrieving the desired information. While of Data Mining or Knowledge Discovery that scans
this process still requires access to the WebGIS source and detects all data sequences which contain recur-
code the required effort is low. The developer does ring patterns (Srikant and Agrawal, 1996). Developed
not need profound programming skills or an extensive initially to analyze customer behavior, it also serves
knowledge of the WebGIS code base for carrying out our purpose to interpret the underlying intentions of
this task. For our evaluation, the instrumentation of WebGIS interactions. We adapt GSP (Generalized Se-
the JavaScript code for an existing WebGIS client was quential Pattern), an improved pattern detection algo-
completed within a few hours. rithm that scales linearly with the number of data se-
quences (Agrawal and Srikant, 1995). This level-based
Listing 1. JavaScript sample code for connecting logging algorithm iterates multiple times through the dataset.
module to third-party mapping framework events First, the frequency (support of a pattern) of all se-
// import logging module
import { logger } from "interaction-logging"
quences with the length of one (n = 1) is determined.
// subscribe to changes of map’s zoom level Next, non-frequent sequences are removed and the re-
mapView.watch("zoom", (newZoom, oldZoom) => {
// identify event type
maining sequences are used for the next iteration that
var evt = newZoom > oldZoom ? "in" : "out"; determines the frequency of patterns with the length of
// log event type and properties
logger.log("zoom-" + evt, newZoom);
two (n = 2). This procedure is repeated until the set of
}); frequent items is empty for the next iteration.
3 4
https://developers.arcgis.com/javascript/latest/ https://www.elastic.co/elasticsearch/
AGILE: GIScience Series, 2, 16, 2021 | https://doi.org/10.5194/agile-giss-2-16-2021 4 of 11A typical uses case of the GSP algorithm is the iden- chosen threshold for recognizing patterns and the fre-
tification of shopping patterns in a web shop to infer quency of identified patterns.
what customers might buy next. The input sequences,
in this case, are the ordered lists of previously bought
items for each customer. The resulting patterns are fre-
quent transaction sequences that could be used to dis-
4 Evaluation
play recommendations to customers. Customers who
buy some other articles in between also support a pat- To evaluate our approach, we conducted a user study
tern that does not include every of their items. Note and extracted interaction patterns for a localization
that these transactions do not need to be consecutive. tasks. Two groups of participants were provided with
For our application of the algorithm, we use lists of in- different multi-scale navigation techniques. The first
teractions that represent WebGIS user sessions as input group was equipped with a novel technique that
sequences. made use off-screen indicators (OSI) (Gustafson et al.,
2008; Ballatore, 2019). These OSI consists of triangles
A minimal support threshold (minsup) must be defined
whose sides can be traced and extrapolated to locate
as an additional parameter [0,1] and determines the
the off-screen object (i.e. map features that are outside
number of occurrences of sequences in the dataset to
the currently visible view) (Baudisch and Rosenholtz,
remain for the next iteration. The algorithm, then, re-
2003). By tracking the relative position of these ob-
turns the sequences for all iterations that fulfill this cri-
jects continuously users are able to estimate where the
teria and can thus be recognized as common patterns
triangle’s sides intersect and navigate precisely to the
in the dataset. The minsup value is usually determined
desired entry (Figure 1). Additionally, an alphabetical
by trial and error until a value is found that reveals in-
coding could be used by this group to match the fea-
teresting patterns. However, the size of the dataset (x)
tures on the map to the corresponding row in the ta-
plays an important role for the minsup value. If the
ble below. The coding was displayed next to the OSI
dataset is small, the threshold must be set to a high
on the map and as an attribute in the table rows to
value while a low value is required for large dataset.
facilitate the assignment of both representations. The
The exponential decay function (Fournier-Viger, 2010)
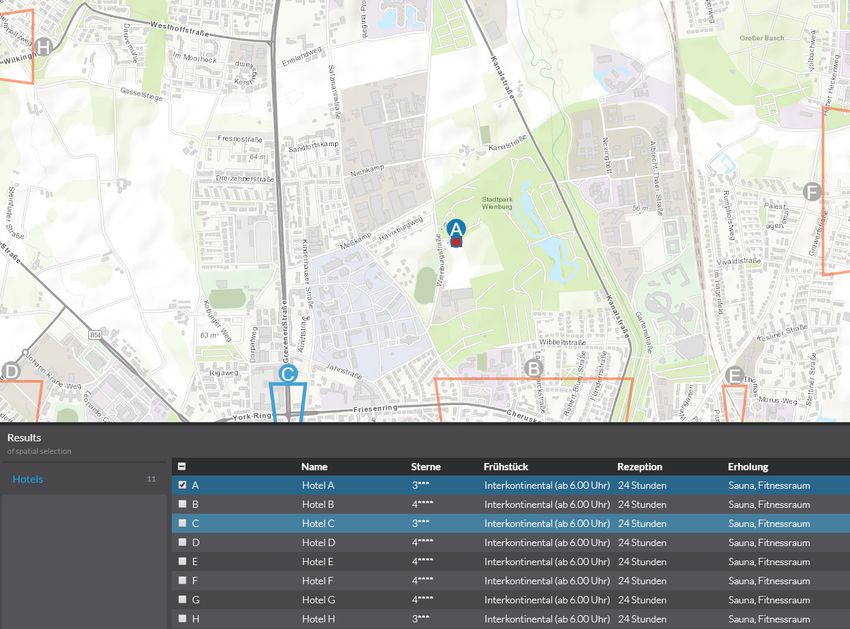
second group used a traditional geovisualization tech-
can be used to describe a curve that represents such a
nique for dynamic maps that simply highlights the map
behavior:
features with a point symbol and does not indicate if
minsup(x) = (e−ax−b ) + c and where additional features might be located outside
of the current map view. This group also had to men-
The parameters a, b, and c are static values that must tally match the table rows to the features on the map
be adjusted to make the curve behave differently. The by either hovering the one of them which highlighted
value of c represents the minimal minsup value (i.e. the the correspondent feature or row (Figure 2). We ran-
threshold for large datasets) of the curve. The values domly assigned participants to one of the two groups
of a and b determine the decline of the curve (i.e. the in a between-group user study.
minsup values will be lower for larger datasets) and
Participants: We opportunistically recruited 60 partic-
thus describe how long it will take before the minsup
ipants during a user conference of the tested WebGIS
value converges to the value of c.
to participate in the study using our optimized OSI
version. The primary criteria for participation in our
3.3 Semantic Labeling study included basic knowledge and experience with
WebGIS (i.e., participants were actual end-users). The
Finally, we assign descriptive labels to the detected resulting sample set of participants consisted of regu-
interaction patterns by interpreting the semantics. We lar users with high levels of motivation and WebGIS
distinguish between basic actions, the fundamental expertise. Our sample size of n = 60 for two different
operations for manipulating digital maps (i.e. the scenarios is sufficient to achieve a high level of thor-
recorded input events), and complex actions that are se- oughness based on recommendations for usability test-
quences of basic actions and represent more complex ing (Nielsen and Landauer, 1993).
interaction semantics. Material and Procedure: We conducted the study dur-
Complex actions are the result of our sequential pattern ing the mentioned conference in a quiet area at the con-
mining algorithm. These actions facilitate the interpre- ference venue. As the data collection was performed
tation of user intentions that are executed via multiple automatically, our simple usability setup consisted of
basic actions and, thus, reflect broader user strategies a laptop computer, an external monitor, and a mouse
for the overall task (e.g., Relative Position Confirma- that were used by the participants during testing. We
tion). In the following, we will denote the length of completed all sessions over two days, with our setup
interaction patterns that underlie our complex actions remaining in the same configuration throughout the pe-
as complexity. Complex actions will help us to detect riod.
if there is common user behavior, depending on the
AGILE: GIScience Series, 2, 16, 2021 | https://doi.org/10.5194/agile-giss-2-16-2021 5 of 11such as the area, were displayed in the table below the
map. By using the checkbox in one of the table rows,
the corresponding entry was added to or removed from
the set of selected entries. This task layout was created
to require participants to interact with the map as well
as with the table. We chose the initial extent of the map
view not to show all entries and, thus, required partici-
pants to interact with the map element via pan or zoom
actions. During the study, participants were allowed to
ask questions for clarification, and all sessions were
finished with a set of properties that fulfilled the given
criteria.
5 Results
Figure 1. The first group was presented with off-screen indica-
tors that reveal map entries which are not visible in the current
viewport of the screen. Our optimized visualization extends the In total, we collected 1248 map interactions from 60
indicators with an alphabetical coding to simplify the assignment user sessions (44 male, 16 female). Both geovisualiza-
of individual values from a table. tion types were used by two groups of 30 participants
each and an overall mean age of 38.3 (σ = 10.13) and
a self-rated GIS experience of 4.6 (σ = 0.95, Likert
scale: 1 to 5). An independent-samples t-test was con-
ducted to compare the task completion times. There
was no significant differences in the times with OSI
(M = 89.3 seconds, SD = 41.7) and without OSI (M =
92.2, SD = 86) conditions; t(54) = 0.2658, p = .7914.
About 60% of the users in the scenario with OSI se-
lected all property entries that fulfilled the required cri-
teria. In the scenario without OSI, the success rate was
73%. In both scenarios, properties that did not fulfill
the required criteria were selected by 6 or less partici-
pants. We performed a chi-square test of independence
to examine the relation between the geovisualization
and the count of basic actions. The relation between
Figure 2. The second group was equipped with a common geo- these variables was significant, X2 (3, N = 60) = 7.94,
visualization that display map entries as simple dots on the map. p = .47. Users with OSI were more likely to perform
The connection between map and table entries is not initially basic actions.
available, and users must hover or select table entries to mentally
establish the connection. For mining complex interaction in our dataset, we de-
termined a threshold of 30%, meaning that at least
30% of the groups’ participants (i.e., user sessions)
Similar to the idea of a usability kiosk (Nielsen, 1993), must have performed a particular sequence to be recog-
we invited passing-by persons to participate in a 10- nized as a pattern. This minsup value was established
minute user study that investigated an experimental de- via the exponential decay function (final parameters:
sign for visualizing the relationship between data in a x = 1248 a = −0.0017, b = −0.2, and c = 0.2). The
table and on the map. First, participants sat down in pattern mining algorithm detected 11 complex actions
front of our setup that guided users through the re- which were interpreted through the following map in-
quired steps and automatically assigned them to one teraction semantics:
of our two groups. Next, we asked participants to rate
their experience with GIS on a Likert scale based on • Detail Verification (I-O): Zooming in to inspect
the following statement: I have experience in working details of the entry or its surroundings before
with GIS (1: strongly disagree, 5: strongly agree). Be- zooming out again to establish the previous scale.
fore starting with the study, participants also had to
confirm an informed consent form about the anony- • Detail Selection (I-S): Zooming in to inspect de-
mously collected data. Without any initial exploration tails and select an entry.
period, every participant was tasked to select property
entries on the map that had a rectangular shape and an • Inspection (I-P): Zooming in and panning the
area bigger than a 5km2 . Attributes of the map entries, map to investigate details in a particular area.
AGILE: GIScience Series, 2, 16, 2021 | https://doi.org/10.5194/agile-giss-2-16-2021 6 of 11Pattern w/ indicators w/o indicators Semantic Description
Total Users Total Users
P,S 46 22 28 15 Browse Selection
P,I 21 15 - - Narrow-Down Search
P,O 20 14 14 11 Spread-Out Search
I,S 19 16 - - Detail Selection
I,P 19 12 - - Inspection
I,O - - 17 10 Detail Verification
O,P 30 15 22 14 Spread-Out Search
O,I 18 15 - - Rel. Pos. Confirmation
I,S,P 9 9 - - Scale Choice
S,O,I 9 9 - - Surroundings Inspection
O,P,S 11 9 13 12 Spread-Out Selection
S,P,S 29 15 - - Supervised Selection
P,S,P 31 16 - - Supervised Selection
P,S,P,S 18 9 - - Supervised Selection
S,P,S,P 23 13 - - Supervised Selection
Table 1. Complex actions with their total and user count for scenario with indicators and without indicators (both were conducted
by 30 participants each). Complex actions that did not pass the threshold for the group (30% of users) were ignored here. - I: Zoom
In; O: Zoom out; P: Pan; S: Select
With Off-Screen Indicators Without Off-Screen Indicators
Zoom Zoom
Select Select
In In
Zoom Zoom
Pan Pan
Out Out
Browse Selection Narrow-Down Search Spread-Out Search Detail Selection
Inspection Detail Verification Rel. Pos. Confirm. Scale Choice
Surround. Inspect. Spread-Out Selection Supervised Selection No Semantic
Figure 3. Complex actions and their semantic descriptions which passed the defined threshold (30% of user sessions with one or
more executions).
AGILE: GIScience Series, 2, 16, 2021 | https://doi.org/10.5194/agile-giss-2-16-2021 7 of 11• Relative Position Confirmation (O-I): Zooming Pattern w/ indicators w/o indicators
out to localize the current position based on the Total Users Total Users
surroundings before zooming in again to establish S,P 46 20 - -
the previous scale. S,I 12 10 16 13
S,O 20 14 23 16
• Spread-Out Search (P-O or O-P): Searching O,S 11 10 26 17
for further entries by increasing the visible area Table 2. Frequencies of detected interaction patterns which
through panning the map and zooming out to could not be interpreted and assigned to a map interaction
move on to a different location (faster). semantic. - I: Zoom In; O: Zoom out; P: Pan; S: Select
• Narrow-Down Search (P-I): Searching the map
by panning around before zooming in to a partic- Despite the variety of map interaction semantics for the
ular area. group with OSI, Supervised Selection stands out in our
data. This complex action is the result of multiple and
• Browse Selection (P-S): Scanning entries by pan- similar underlying interaction patterns while also being
ning the map before selecting an entry. the only one with a complexity higher than two and an
• Scale Choice (I-S-P): Reducing the scale to se- average execution per user above one (P,S,P: 31 ex-
lect an entry and panning the map to search for ecutions for 30 participants). Thus, the simple alterna-
the next entry of interest. As the user keeps the re- tion of Pan and Select seems to be a characteristic be-
duced scale after the selection, this semantic also havior of participants for this scenario. It seems plau-
determines a selection of a new scale by the user sible that Supervised Selection is a result of the opti-
for his search process. mized indicators which direct users to map entries out-
side of the visible map extent without having to zoom
• Surroundings Inspection (S-O-I): Confirming out.
the own position after selecting an entry to get an The algorithm detected four additional complex ac-
overview of remaining entries and their relative tions, but we could not assign any meaningful map in-
position. teraction semantic (see Table 2). However, these pat-
• Spread-Out Selection (O-P-S): Zooming out to terns seem to be exceptions that can be explained in
move to a different selection faster and selects an the context they were executed. The S,P pattern is a
item here. subset of the more complex Supervised Selection and
did not pass the threshold for the group without OSI,
• Supervised Selection ([S-]P-S[-P]): Keeping the for the described reasons. The remaining three pat-
same scale and continuously selecting entries by terns without a semantic description could indicate that
panning the map to get to items outside of the vis- users carried out their goal to select an entry and begin
ible extent. This semantic manifests in multiple with a new semantic interaction.
similar interaction patterns that are either subsets
or vary in the starting interaction before alternat-
ing between Pan and Select.
6 Discussion
In contrast to the basic interactions, the side-by-side
comparison of these complex actions reveals signifi- To provide a positive experience for users of a We-
cant differences between participants in the group with bGIS, it is essential to assess the usability of these
OSI and those without OSI (see Figure 3). While we systems. Prior work has analyzed the usage of We-
found ten different semantic interaction patterns in the bGIS to learn about users’ interaction with geospatial
group of participants with OSI, participants without data and inform the design of UIs. Roth, for exam-
OSI executed only four different patterns (see Table ple, compared the performance and used map operators
1). As the total interaction count is similar for both via interaction logs to identify user personas (Roth and
groups, the small set of map interaction semantics for MacEachren, 2016). Our findings confirm that map in-
the group without OSI (as well as the often lower ex- teractions can be used to interpret the users’ immedi-
ecution count for the remaining semantics) indicates a ate intentions which are essential for detecting flaws in
lack of a common strategy for these participants. In- the UI. This study, therefore, indicates that the steps
stead, we expect a variety of individual patterns below for retrieving the required data could be carried out
our chosen threshold for this group. by a holistic toolkit that supports UI designers in the
Browse Selection represents the most often detected decision-making process.
map interaction semantic for both groups (see Table By applying our new approach, presented in this pa-
1) and could describe the participants’ aim to scan the per, and comparing map interaction semantics through
map with the same scale while selecting entries. How- empirically derived interaction patterns we were able
ever, participants that were provided with OSI show a to identify that the majority of participants equipped
higher proportion for this semantic. with OSI approached the given localization task with
AGILE: GIScience Series, 2, 16, 2021 | https://doi.org/10.5194/agile-giss-2-16-2021 8 of 11the same interaction strategy. By making use of Super- Further limitations of our evaluation are the type of vised Selections these users could stay on a map scale our study participants as well as the complexity of the that allowed them to verify details on the map that were tested geovisualizations. The overall self-rated GIS ex- required for the given task while also being able to perience of our users was very high and the chosen pan to the next map entry. In contrast, traditional us- approach for recruiting participants on a conference ability measures, like task completion times, could not certainly contributes to a homogeneous cohort. Last, indicate significant differences between both groups. the tested scenarios represent simple tasks compared We can attribute this to the novelty of OSI for most to modern WebGIS that offer numerous tools and data users that might not result in increased performance sources. However, our work can be considered a first initially but requires some learning first. However, our step in to the investigation of the benefits of inter- approach can help usability experts to gain deeper in- action semantics for this domain. Instrumenting We- sights into user strategies from remotely logged map bGIS for automatic data collection and pattern extrac- interaction data and provide indicators that show if UI tion also simplifies the conduction of future studies in changes result in changed user behavior. more complex environments and with heterogeneous Our results also indicate open usability issues with the users. WebGIS that was evaluated. While OSI users were able Furthermore, it would be interesting to investigate the to make use of the provided indicators the extracted temporal and spatial correlation of interaction patterns patterns reveal that some of these users performed Rel- within user sessions. Finding out whether users with ative Position Confirmations. While OSI should sup- the same immediate intentions carried out the corre- port users in navigating to map entries without having sponding interaction patterns at the same geographic to zoom out it seems like these participants still wanted location on the map or at the same point in time rela- to keep track of their position on the map. Thus adding tive to their session start could reveal further insights an overview map to our UI could enhance the usability and help to differentiate groups of users with the same of the evaluated WebGIS. strategy further. Therefore, future work could visualize In addition, we found that some OSI participants (9 out this data as a map layer that can be explored by usabil- of 30) performed exactly one Scale choice in their ses- ity analysts to detect spatial and temporal patterns. sion. This could be an indicator for a poorly chosen initial scale that requires users to zoom in at the begin- ning of their session before they can benefit from the 7 Conclusion OSI and focus on the task at hand. Usability design- ers can use findings like this one to further analyze the The evaluation of map interaction patterns is critical logged interaction data to confirm this hypothesis and for usability assessment in web-based geographic in- adjust the initial scale of the evaluated WebGIS. formation systems because they differ from interac- Although zooming and panning represent the most tions with traditional UI elements. Recent trends, such critical map interactions in WebGIS scenarios, our as the Internet of Things, increase the dissemination of evaluation covered only a small subset of possible map geospatial data and the need for appropriate mediums interactions and a single selection task. Frequently, to display and manipulate location information in their modern WebGIS provide tools for spatial selections or context. Dynamic maps as a medium can handle these drawing notes which may lead to more complex inter- vast amounts of data and are increasingly accessed by action patterns. However, as WebGIS are designed to non-expert users via the World Wide Web. cover only a limited number of workflows, the inter- In this paper, we present an approach and toolkit for pretation of these patterns should be feasible if the aim detecting, describing and comparing map interactions of the user is known to the analyst. in WebGIS sessions for usability analysis. Map inter- Regarding our approach, further work is needed to action semantics describe the users’ immediate inten- evaluate the correctness of our map interaction seman- tions while interacting with the WebGIS and, thus, in- tics. In this study, the assumptions about the underlying crease insights into user behavior compared to ana- intentions were not validated by, for example, conduct- lyzing isolated interactions. To extract these intentions ing follow-up interviews with the participants. While from users’ sessions, we mined all user interactions for the quantitative results of our study indicate that many common patterns as they usually manifest in sequences users with OSI followed a common strategy, it remains of interactions. Because the data was collected auto- unclear if, for example, the intention of I,O was al- matically via an instrumented WebGIS software, our ways Detail Verification. However, the design of our approach facilitates the extraction of map interaction focused task, as well as the detected patterns, do not patterns without an experimenter on site or additional leave room for arbitrary interpretations in this context. hardware, such as eye-tracking devices. Future work should investigate more complex scenar- We conducted a kiosk study to investigate the feasi- ios and validate the resulting map interaction semantics bility and potential of our approach. Overall, the re- by consulting the study’s participants. sult provides evidence that the chosen geovisualiza- AGILE: GIScience Series, 2, 16, 2021 | https://doi.org/10.5194/agile-giss-2-16-2021 9 of 11
tion affects the users’ immediate intentions for the                   ence. Cyprus University of Technology, 17-20 June 2019, pp.
same task. We showed that off-screen indicators en-                    1–5, 2019.
courage specific user approaches and result in com-                    Baudisch, P. and Rosenholtz, R.: Halo: A Technique for
mon user strategies, whereas the lack of these indica-                 Visualizing Off-screen Objects, in: Proceedings of the
tors results in a variety of individual approaches. Our                SIGCHI Conference on Human Factors in Computing Sys-
method, therefore, can be used to compare the influ-                   tems, CHI ’03, pp. 481–488, ACM, New York, NY, USA,
ence of UI changes on the users’ intentions and assist                 https://doi.org/10.1145/642611.642695, 2003.
decision makers in usability evaluations. Our key con-                 Cockburn, A., Karlson, A., and Bederson, B. B.:
tributions are a new approach for evaluating the usabil-               A Review of Overview+detail, Zooming, and Fo-
ity of web-based geographic information systems by                     cus+context Interfaces, ACM Comput. Surv., 41,
comparing map interaction semantics through empiri-                    https://doi.org/10.1145/1456650.1456652, 2009.
cally derived interaction patterns; and the usability as-              Çöltekin, A., Heil, B., Garlandini, S., and Fabrikant,
sessment of an adapted geovisualization method for a                   S. I.: Evaluating the Effectiveness of Interactive Map
selection task based on our approach. In the future, we                Interface Designs: A Case Study Integrating Usabil-
will extend our toolkit to visualize the results and thus              ity Metrics with Eye-Movement Analysis, Cartogra-
provide more spatial and temporal context to analysts,                 phy and Geographic Information Science, 36, 5–17,
and we will assess the usefulness of our approach for                  https://doi.org/10.1559/152304009787340197, 2009.
more complex scenarios.                                                Crampton, J. W.: Interactivity Types in Geographic Visual-
                                                                       ization, Cartography and Geographic Information Science,
                                                                       29, 85–98, https://doi.org/10.1559/152304002782053314,
                                                                       2002.
8   Data and Software Availability
                                                                       Fechner, T., Wilhelm, D., and Kray, C.: Ethermap: Real-time
                                                                       Collaborative Map Editing, in: Proceedings of the 33rd An-
The computational environment was provided by us-                      nual ACM Conference on Human Factors in Computing Sys-
ing a virtual machine (OS: Windows 10) with an Elas-                   tems, CHI ’15, pp. 3583–3592, ACM, New York, NY, USA,
ticsearch cluster (version 2.1). For collecting user in-               https://doi.org/10.1145/2702123.2702536, 2015.
teractions during our study and retrieving this data                   Fournier-Viger, P.: Un modèle hybride pour le support à
for the analysis, the virtual machines were accessed                   l’apprentissage dans les domaines procéduraux et mal défi-
via a local network. As the used open source version                   nis, Ph.D. thesis, Université du Québec à Montréal, 2010.
of Elasticsearch does not provide any security layer,                  Furnas, G. W. and Bederson, B. B.: Space-Scale Di-
it is not possible to share any connection details to                  agrams: Understanding Multiscale Interfaces, in: Pro-
our datasets. To mine the retrieved data for pattern a                 ceedings of the SIGCHI Conference on Human Fac-
publicly available Python implementation of GSP was                    tors in Computing Systems, CHI ’95, p. 234–241,
used (https://doi.org/10.5281/zenodo.3333988).                         ACM Press/Addison-Wesley Publishing Co., USA,
                                                                       https://doi.org/10.1145/223904.223934, 1995.
                                                                       Gustafson, S., Baudisch, P., Gutwin, C., and Irani, P.: Wedge:
References                                                             Clutter-free Visualization of Off-screen Locations, in: Pro-
                                                                       ceedings of the SIGCHI Conference on Human Factors in
Agrawal, R. and Srikant, R.: Mining Sequential Patterns,               Computing Systems, CHI ’08, pp. 787–796, ACM, New
in: Proceedings of the Eleventh International Conference on            York, NY, USA, https://doi.org/10.1145/1357054.1357179,
Data Engineering, ICDE ’95, pp. 3–14, IEEE Computer So-                2008.
ciety, Washington, DC, USA, http://dl.acm.org/citation.cfm?
                                                                       Hiramoto, R. and Sumiya, K.: Web Information Retrieval
id=645480.655281, 1995.
                                                                       Based on User Operation on Digital Maps, in: Pro-
Alaçam, O. and Dalcı, M.: A Usability Study of WebMaps                 ceedings of the 14th Annual ACM International Sym-
with Eye Tracking Tool: The Effects of Iconic Represen-                posium on Advances in Geographic Information Sys-
tation of Information, in: Proceedings of the 13th Interna-            tems, GIS ’06, pp. 99–106, ACM, New York, NY, USA,
tional Conference on Human-Computer Interaction. Part I:               https://doi.org/10.1145/1183471.1183489, 2006.
New Trends, pp. 12–21, Springer-Verlag, Berlin, Heidelberg,
                                                                       Hirose, M., Hiramoto, R., and Sumiya, K.: GeminiMap - Ge-
https://doi.org/10.1007/978-3-642-02574-7_2, 2009.
                                                                       ographical Enhanced Map Interface for Navigation on the In-
Aoidh, E. M., Wilson, D. C., and Bertolotto, M.: A Study               ternet, in: Proceedings of the 7th International Conference
of Spatial Interaction Behaviour for Improved Delivery                 on Web and Wireless Geographical Information Systems,
of Web-Based Maps, in: Proceedings of the 9th Interna-                 W2GIS’07, pp. 279–292, Springer-Verlag, Berlin, Heidel-
tional Symposium on Web and Wireless Geographical In-                  berg, 2007.
formation Systems, W2GIS ’09, pp. 120–134, Springer-
                                                                       Hoover, J. H., Sutton, P. C., Anderson, S. J., and
Verlag, Berlin, Heidelberg, https://doi.org/10.1007/978-3-
                                                                       Keller, A. C.: Designing and evaluating a groundwa-
642-10601-9_9, 2009.
                                                                       ter quality Internet GIS, Applied Geography, 53, 55–65,
Ballatore, A.: A Context Frame for Interactive Maps, in:               https://doi.org/10.1016/j.apgeog.2014.06.005, 2014.
Geospatial Technologies for Local and Regional Develop-
                                                                       Javed, W., Ghani, S., and Elmqvist, N.: Polyzoom: Mul-
ment : short papers, posters and poster abstracts of the
                                                                       tiscale and Multifocus Exploration in 2d Visual Spaces,
22nd AGILE Conference on Geographic Information Sci-

AGILE: GIScience Series, 2, 16, 2021 | https://doi.org/10.5194/agile-giss-2-16-2021                                         10 of 11
in: Proceedings of the SIGCHI Conference on Hu- sociation for Computing Machinery, New York, NY, USA, man Factors in Computing Systems, CHI ’12, Associ- https://doi.org/10.1145/1358628.1358655, 2008. ation for Computing Machinery, New York, NY, USA, Roth, R., Donohue, R., Sack, C., Wallace, T., and Bucking- https://doi.org/10.1145/2207676.2207716, 2012. ham, T.: A Process for Keeping Pace with Evolving Web Kiefer, P., Giannopoulos, I., Athanasios Anagnostopoulos, Mapping Technologies, Cartographic Perspectives, 0, 25–52, V., Schöning, J., and Raubal, M.: Controllability Matters: 2015a. The User Experience of Adaptive Maps, Geoinformatica, 21, Roth, R. E.: Cartographic Interaction Primitives: Frame- 619–641, https://doi.org/10.1007/s10707-016-0282-x, 2017. work and Synthesis, The Cartographic Journal, 49, 376–395, Lazar, J., Feng, J. H., and Hochheiser, H.: Research Methods https://doi.org/10.1179/1743277412Y.0000000019, 2012. in Human-Computer Interaction, Wiley Publishing, Chich- Roth, R. E. and MacEachren, A. M.: Geovisual analytics and ester, UK, 2010. the science of interaction: an empirical interaction study, Car- Lobo, M.-J., Pietriga, E., and Appert, C.: An Evaluation of tography and Geographic Information Science, 43, 30–54, Interactive Map Comparison Techniques, in: Proceedings of https://doi.org/10.1080/15230406.2015.1021714, 2016. the 33rd Annual ACM Conference on Human Factors in Roth, R. E., Ross, K. S., and MacEachren, A. M.: User- Computing Systems, CHI ’15, pp. 3573–3582, ACM, New Centered Design for Interactive Maps: A Case Study York, NY, USA, https://doi.org/10.1145/2702123.2702130, in Crime Analysis, ISPRS International Journal of Geo- 2015. Information, 4, 262–301, http://www.mdpi.com/2220-9964/ Manson, S. M., Kne, L., Dyke, K. R., Shannon, J., 4/1/262, 2015b. and Eria, S.: Using Eye-tracking and Mouse Metrics Rzeszewski, M. and Kotus, J.: Usability and useful- to Test Usability of Web Mapping Navigation, Cartog- ness of internet mapping platforms in participatory raphy and Geographic Information Science, 39, 48–60, spatial planning, Applied Geography, 103, 56–69, https://doi.org/10.1559/1523040639148, 2012. https://doi.org/https://doi.org/10.1016/j.apgeog.2019.01.001, May, J. and Gamble, T.: Collocating Interface Objects: 2019. Zooming into Maps, in: Proceedings of the 32Nd Annual Srikant, R. and Agrawal, R.: Mining Sequential Patterns: ACM Conference on Human Factors in Computing Sys- Generalizations and Performance Improvements, in: Pro- tems, CHI ’14, pp. 2085–2094, ACM, New York, NY, USA, ceedings of the 5th International Conference on Extending https://doi.org/10.1145/2556288.2557279, 2014. Database Technology: Advances in Database Technology, Nielsen, J.: Usability Engineering, Morgan Kaufmann Pub- EDBT ’96, pp. 3–17, Springer-Verlag, London, UK, UK, lishers Inc., San Francisco, CA, USA, 1993. http://dl.acm.org/citation.cfm?id=645337.650382, 1996. Nielsen, J. and Landauer, T. K.: A Mathematical Model of Tahir, A., McArdle, G., and Bertolotto, M.: Identifying spe- the Finding of Usability Problems, in: Proceedings of the IN- cific spatial tasks through clustering and geovisual analysis, TERACT ’93 and CHI ’93 Conference on Human Factors in: 2012 20th International Conference on Geoinformatics, in Computing Systems, CHI ’93, pp. 206–213, ACM, New pp. 1–6, IEEE Computer Society, Washington, DC, USA, York, NY, USA, https://doi.org/10.1145/169059.169166, https://doi.org/10.1109/Geoinformatics.2012.6270301, 1993. 2012. Pindat, C., Pietriga, E., Chapuis, O., and Puech, C.: Jel- Traynor, C. and Williams, M. G.: Why Are Geo- lyLens: Content-Aware Adaptive Lenses, in: Proceedings graphic Information Systems Hard to Use?, in: Confer- of the 25th Annual ACM Symposium on User Interface ence Companion on Human Factors in Computing Sys- Software and Technology, UIST ’12, p. 261–270, Asso- tems, CHI ’95, pp. 288–289, ACM, New York, NY, USA, ciation for Computing Machinery, New York, NY, USA, https://doi.org/10.1145/223355.223678, 1995. https://doi.org/10.1145/2380116.2380150, 2012. Unrau, R., Ostkamp, M., and Kray, C.: An Approach for Poplin, A., Guan, W., and Lewis, B.: Online Survey of Het- Harvesting, Visualizing, and Analyzing WebGIS Sessions erogeneous Users and Their Usage of the Interactive Map- to Identify Usability Issues, in: Proceedings of the ACM ping Platform WorldMap, The Cartographic Journal, 54, SIGCHI Symposium on Engineering Interactive Computing 214–232, https://doi.org/10.1080/00087041.2016.1229248, Systems, EICS ’17, pp. 33–38, ACM, New York, NY, USA, 2017. https://doi.org/10.1145/3102113.3102122, 2017. Prado Lima, J. A. d.: GSP-Py - General- Weakliam, J., Bertolotto, M., and Wilson, D.: Implicit ized Sequence Pattern algorithm in Python, Interaction Profiling for Recommending Spatial Con- https://doi.org/10.5281/zenodo.3333988, 2019. tent, in: Proceedings of the 13th Annual ACM Inter- Rall, E., Hansen, R., and Pauleit, S.: The added value of pub- national Workshop on Geographic Information Systems, lic participation GIS (PPGIS) for urban green infrastructure GIS ’05, pp. 285–294, ACM, New York, NY, USA, planning, Urban Forestry Urban Greening, 40, 264–274, https://doi.org/10.1145/1097064.1097104, 2005. https://doi.org/https://doi.org/10.1016/j.ufug.2018.06.016, 2019. Riegelsberger, J. and Nakhimovsky, Y.: Seeing the Bigger Picture: A Multi-Method Field Trial of Google Maps for Mobile, in: CHI ’08 Extended Abstracts on Human Fac- tors in Computing Systems, CHI EA ’08, p. 2221–2228, As- AGILE: GIScience Series, 2, 16, 2021 | https://doi.org/10.5194/agile-giss-2-16-2021 11 of 11
You can also read