Transportation Research Part C
←
→
Page content transcription
If your browser does not render page correctly, please read the page content below
Transportation Research Part C 131 (2021) 103339
Contents lists available at ScienceDirect
Transportation Research Part C
journal homepage: www.elsevier.com/locate/trc
Predicting traffic demand during hurricane evacuation using
Real-time data from transportation systems and social media
Kamol Chandra Roy a, Samiul Hasan a, *, Aron Culotta b, Naveen Eluru a
a
Department of Civil, Environmental, and Construction Engineering, University of Central Florida, 12800 Pegasus Drive, Orlando, FL, United States
b
School of Science and Engineering, Tulane University, New Orleans, LA, United States
A R T I C L E I N F O A B S T R A C T
Keywords: In recent times, hurricanes Matthew, Harvey, and Irma have disrupted the lives of millions of
Traffic demand people across multiple states in the United States. Under hurricane evacuation, efficient traffic
Hurricane evacuation operations can maximize the use of transportation infrastructure, reducing evacuation time and
Traffic sensor
stress due to massive congestion. Evacuation traffic prediction is critical to plan for effective
Social media
LSTM neural network
traffic management strategies. However, due to the complex and dynamic nature of evacuation
Machine learning participation, predicting evacuation traffic demand long ahead of the actual evacuation is a very
challenging task. Real-time information from various sources can significantly help us reliably
predict evacuation demand. In this study, we use traffic sensor and Twitter data during hurricanes
Matthew and Irma to predict traffic demand during evacuation for a longer forecasting horizon
(greater than 1 h). We present a machine learning approach using Long-Short Term Memory
Neural Networks (LSTM-NN), trained over real-world traffic data during hurricane evacuation
(hurricanes Irma and Matthew) using different combinations of input features and forecast ho
rizons. We compare our prediction results against a baseline prediction and existing machine
learning models. Results show that the proposed model can predict traffic demand during
evacuation well up to 24 h ahead. The proposed LSTM-NN model can significantly benefit future
evacuation traffic management.
1. Introduction
In recent times, hurricanes Matthew, Harvey, Irma, and Dorian have disrupted the lives of millions of people across multiple states
in the United States. During a hurricane, mandatory or voluntary evacuation orders are issued over a large region so that potentially
impacted people can move to safer places. Under a hurricane evacuation, it is critical for emergency agencies to ensure smooth op
erations of interdependent infrastructure systems and emergency services. Efficient traffic operations can maximize the utilization of
existing transportation infrastructure, reducing evacuation time and stress due to massive congestion. Accurately predicting evacu
ation traffic is critical to plan for effective traffic operations strategies. However, because of the complex and dynamic nature of
evacuation participation, predicting evacuation traffic demand long ahead of the actual evacuation is a very challenging task.
Real-time information from various sources can significantly help us reliably predict evacuation demand. In addition, real-time
information can help us to better deal with unexpected events during a hurricane. For managing evacuations, transportation
agencies need to prepare detailed evacuation plans. For instance, in hurricane prone regions, agencies are required to develop regional
* Corresponding author.
E-mail address: samiul.hasan@ucf.edu (S. Hasan).
https://doi.org/10.1016/j.trc.2021.103339
Received 28 February 2020; Received in revised form 25 July 2021; Accepted 7 August 2021
0968-090X/© 2021 Elsevier Ltd. All rights reserved.
K.C. Roy et al. Transportation Research Part C 131 (2021) 103339
evacuation plans (Murray-Tuite et al., 2021; Urbina and Wolshon, 2003). Such a plan should ensure that the affected population can
depart regions under a hurricane threat in a timely manner. However, unexpected events such as a levee break (during hurricane
Katrina) or sudden changes of hurricane path (during hurricane Irma) could result in potentially fatal consequences when agencies
have not prepared for such an eventuality. Thus, having the flexibility to update evacuation plans and procedures in response to real-
time information allows for an improved evacuation plan. Current approaches are based on a defined set of expectations and are
seldom sensitive to the temporal and spatial dynamics of the event. Given the complexity and dynamics of a crisis event, following a
static emergency plan without responding to real-time information from various data sources offers a potentially sub-optimal plan. An
inter-disciplinary approach is needed to collect, integrate, and compile data to address the rapidly unfolding response environment
evolved during a disaster (Ge et al., 2019). This study addresses this challenge by developing an integrated data-driven modeling
framework that allows for real-time prediction of traffic during evacuation based on the data compiled from infrastructure systems
(such as traffic sensor data from roadways) and social media (such as messages posted in Twitter).
During recent hurricanes (Matthew, Irma), massive evacuations took place in the entire Florida region especially in its coastal
counties. Millions of people were under mandatory evacuation orders, creating severe congestion in major evacuation routes especially
in the interstate highways (I-75 and I-95). To alleviate congestion, emergency management agencies can adopt strategies such as
opening hard shoulder for traffic, contraflow operations, modified traffic control, route guidance, and staged evacuation etc. However,
traffic prediction plays the most critical role to decide upon the nature and extent of such congestion management strategies. Existing
works on traffic prediction mainly focus on short term (5 mins to 1 h) prediction, which is not adequate for managing hurricane
evacuations that last several days. During hurricanes, traditionally adopted short-term features such as present and past traffic con
ditions are not enough to make traffic predictions. Social media messages and geotagged information about the actions taken by the
users can provide valuable signals for predicting evacuation traffic in the long term. The objective of this study is to investigate how
real-time information from traffic and social media sensors can be used to better predict long-term traffic demand during evacuation.
We propose a machine learning approach for making long-term traffic prediction during evacuation. In particular, to predict traffic
demand during a hurricane for different forecast horizons, we propose a neural network model based on long-short term memory
(LSTM-NN) architecture. We have used Twitter data from hurricanes Matthew and Irma and the corresponding traffic counts from the
loop detectors in two major interstate highways (I-75 and I-95). We compare the results with a baseline forecast and other machine
learning algorithms such as K-nearest neighbor regression (KNN regression), support vector regression (SVR), gradient boosting
regression (GBR), and XGBoost regression (XGBR). Experimental results show that during hurricane evacuation, LSTM model captures
the traffic demand irregularities better than the other models. In this work, we answer the following four research questions:
• During hurricane evacuation, can we predict traffic demand for a longer time horizon utilizing real-time data from traffic sensors and social
media? We collect traffic data and Twitter data during two major hurricane evacuation periods. We use these two data sources for
predicting traffic demand for a longer forecast horizon (≥1 h).
• How far in advance can traffic demand be predicted during evacuation using real-time data? For that we apply the proposed models for
different forecast horizons (1–30 h) and compare the predictive performance of the models.
• How well does the predictive model perform when one of the data sources is not available? We apply the models for different combi
nations (only traffic data, only social media data, and combined) of the features and compare the predictive performance of the
models.
• How can we predict the uncertainties of the demand predictions during evacuation? We implement a machine learning model to predict
possible errors in prediction and give the prediction with 90% confidence interval.
2. Literature review
Previous studies investigated evacuation behavior during emergencies including hurricanes (Lindell et al., 2019a; Roy and Hasan,
2021). These studies mainly focused on understanding the factors relating to evacuation decisions (Fry and Binner, 2015; Gudishala
and Wilmot, 2013; Hasan et al., 2011, 2013; Huang et al., 2016), mobilization time (Sadri et al., 2013), departure time (Pel et al., 2012;
Rambha et al., 2019) and destination choice (Mesa-arango et al., 2013; Parady and Hato, 2016; Wilmot et al., 2006). Behavioral
response (Lindell et al., 2019b) to a disaster depends on many factors (Robinson et al., 2017) such as previous evacuation experience
(Arlikatti et al., 2006), receiving a warning (Baker, 1979), higher risk perception (Arlikatti et al., 2006), strong social network (Baker,
1979), gender (female) (Fothergill, 1996) etc. increase the likelihood to evacuate. On the other hand, factors such as frequent hazard
experience (Anderson, 1968), longer residence duration (Baker, 1979), fear of looting (Quarantelli, 1990) etc. decrease the likelihood
to evacuate.
Evacuation behavior also depends on the type of emergency events such as predictable events or evacuation with warning/notice
(e.g. hurricane, flood), unpredictable events or no-notice evacuation (e.g. earthquake, chemical spills, terrorist attack)(Golshani et al.,
2020, 2019), and short-notice evacuation (e.g. tsunami) (Parady and Hato, 2016). For example, unlike hurricanes, tsunami evacuation
destinations are likely to be within short distance (evacuation by foot is recommended)(Kubisch et al., 2020). For destination choice of
tsunami evacuation, Parady and Hato (Parady and Hato, 2016) proposed a spatially correlated logit model considering variables like
distance, altitude difference, number of buildings, shelters, etc.; such spatial correlation is yet to be explored for hurricane evacuation.
However in many cases, the covariates used in the models are not available for demand prediction during an unfolding disaster
(Murray-Tuite et al., 2019; Xu et al., 2016). Wilmot and Mei compared five types of models (participation rates, logistic regression and
3 types of neural networks) for predicting evacuation demand (Wilmot and Mei, 2004). Xu et al proposed an ordered Probit model for
predicting evacuation demand for a future event using data from North Carolina (Xu et al., 2016). Studies have proposed ensemble
2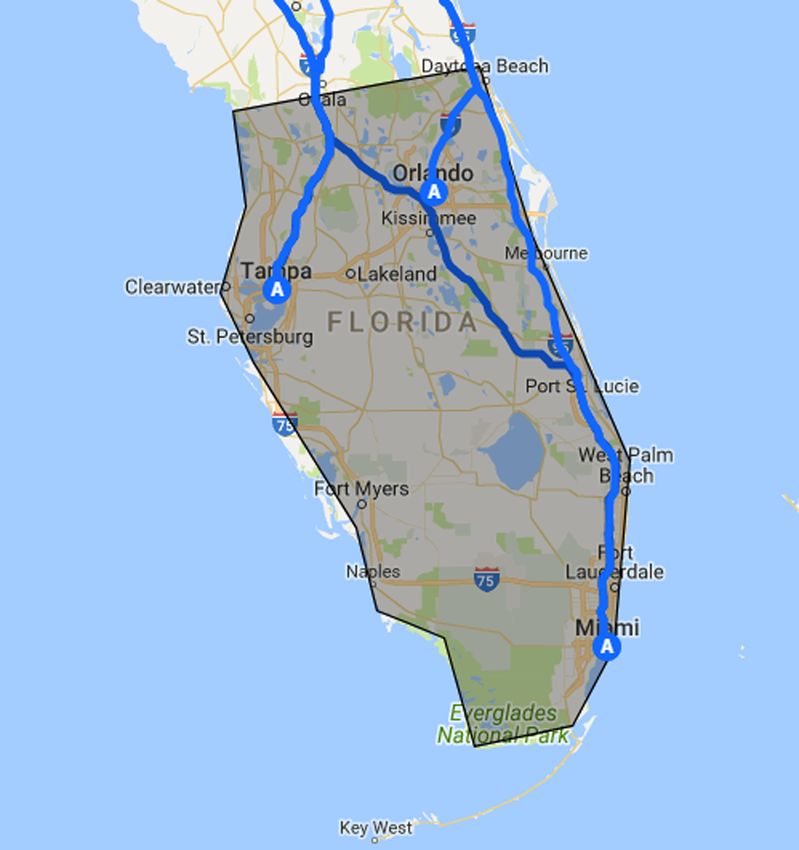
K.C. Roy et al.                                                                                   Transportation Research Part C 131 (2021) 103339

based framework (Blanton et al., 2020; Davidson et al., 2020), integrated modeling approach (Yang et al., 2019), sequential logit
(Gudishala and Wilmot, 2013), nested logit model (Gudishala and Wilmot, 2012), random parameter model (Sarwar et al., 2018),
portfolio choice model (Wong et al., 2020) to understand and predict evacuation. Although this type of modeling approach captures
individual level evacuation participation in greater detail, these approaches highly depend on surveys that are difficult to collect as a
hurricane unfolds in real-time. In this study, we use real-time data for predicting traffic demand during evacuation for a longer
forecasting horizon.
    During a hurricane, traffic state abruptly changes depending on the time to landfall and hurricane intensity. Evacuation orders are
issued considering the damaging effect of storm surge and the overall traffic impact. Evacuation process exerts significant challenges to
transportation planning and operations processes (Murray-Tuite and Wolshon, 2013; Parr et al., 2016). Litman described the planning
(e.g., transportation) failures during hurricane Katrina and Rita (Litman, 2006). During hurricane Katrina, only 60% of the projected
vulnerable people were willing to or able to evacuate. In contrast, during hurricane Rita enormous response to evacuation orders
created excessive traffic problems (e.g., 100-mile-long traffic jams, out of fuel etc.) and dozens of accidents or heat related deaths.
Considering these experiences, evacuation orders were not issued during hurricane Harvey (Mosher, 2017). Incorporating real-time
data in evacuation planning can make evacuation traffic management more flexible, pro-active, and effective.
    With ubiquitous sensors and smartphone devices, many real-time data sources are available now. Traffic detectors installed in the
road networks provide multi-resolution real-time data. These data sources have been used for traffic state prediction by many studies.
Seo et al. provide a comprehensive review of existing methods of highway traffic state (flow, volume, speed etc.) estimation (Seo et al.,
2017). However, these studies (Ma et al., 2015; Meng et al., 2015; Oh et al., 2017; Polson and Sokolov, 2017) mainly focus on short
term (5 min to 1 h) traffic state prediction. Modeling approaches include historical average and smoothing techniques (Smith and
Demetsky, 1997), auto-regressive moving average models (Smith and Demetsky, 1997), Kalman filter algorithms (Smith and
Demetsky, 1997), non-parametric regression (Smith and Demetsky, 1997), artificial neural networks (ANN) (Smith and Demetsky,

                                      Fig. 1. Detector Locations at I-75 and I-95 and the Study Area.

                                                                    3
K.C. Roy et al. Transportation Research Part C 131 (2021) 103339
1997) etc. However, during a hurricane, such short-term predictions are not adequate to adopt pro-active traffic management stra
tegies. In addition, historical data and present traffic conditions are not enough to predict long-term traffic states because of other
external factors such as unexpected events (He et al., 2013). During a hurricane, traffic flow does not follow typical periodical patterns;
rather it changes abruptly depending on many complex factors such as time to landfall, changes in hurricane path, evacuation orders
etc.
Online social media is a major source of real-time data containing public opinion about real-world events. In disaster management,
social media data have been used in different contexts such as understanding and detecting natural disasters (Garg and Kumar, 2016;
Guan and Chen, 2014; Kryvasheyeu Y, Chen H, Moro E, Van Hentenryck P, 2015), modeling human mobility (Roy et al., 2019; Wang
and Taylor, 2014), monitoring epidemics (Schmidt, 2012), responding to crises (Latonero and Shklovski, 2013; Sadri et al., 2020;
Ukkusuri et al., 2014), analyzing sentiment (Pak and Paroubek, 2010; Roy et al., 2020), and so on. Social media users can also serve as
social traffic sensors that traditional sensors cannot provide (Gu et al., 2016; Lv et al., 2017; Zhang et al., 2018). Moreover, traffic
information from social media can supplement traditional physical sensors installed in road networks (Kurkcu et al., 2015; Zhang et al.,
2015). Ming et al. have developed a social media (Twitter) based event detection and subway passenger flow prediction model under
event occurrence (Ni et al., 2017). He et al. (He et al., 2013) developed a regression based approach for long term traffic prediction
using Twitter data. However, this study did not investigate how well the method would perform in case of emergencies such as
hurricanes. Adding features based on tweet counts can improve long-term traffic volume prediction (He et al., 2013). However, traffic
pattern considered in these studies are either recurrent in nature or only have a peak for some hours. During hurricane evacuation,
traffic pattern is more unpredictable and can be significantly different from one hurricane to another hurricane.
Existing models for traffic demand prediction are not suitable in evacuation scenarios as these studies do not consider dynamic
features such as time to landfall, evacuation orders issued, and hurricane awareness that influence the temporal pattern of evacuation
demand. In this paper, we present an approach combining traffic sensor and Twitter data to predict traffic demand during hurricane
evacuation for a longer forecast horizon.
3. Study area and data description
In this study, for predicting traffic during evacuation, we have used both traffic volume and Twitter data. We collect traffic volume
from two detectors: one in I-75 and the other one from I to 95 interstate highway. We collect northbound volume data as we are
interested in only the evacuation traffic moving from the affected regions. The detector at I-75 is located at I-75 north bound direction
at mile marker 330.2 (see Fig. 1) (detector id-9828). The detector at I-95 is located at north bound direction at zone id-10077, district
5, Florida at location I95-N US 92 (see Fig. 1). These detectors are operated by the Florida Department of Transportation, and we have
collected the data from Regional Integrated Transportation Information System (www.ritis.org). The data include traffic volume in 15
min intervals.
For social media data, we have used Twitter data from hurricanes Matthew and Irma. We purchased hurricane Matthew data from
Fig. 2. Traffic Volume for 15 Minutes Intervals at Interstate Highways during Hurricane Evacuation (a) Hurricane Matthew (b) Hurricane Irma.
4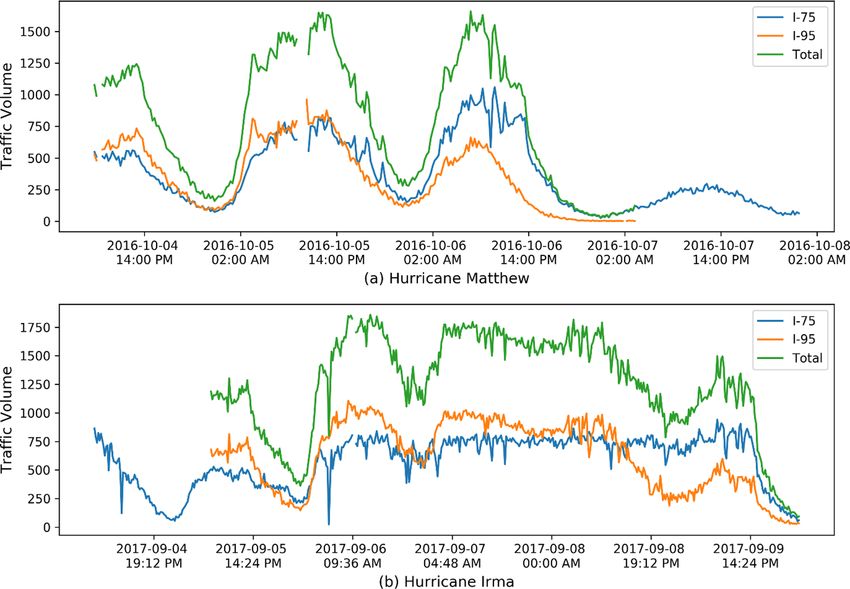
K.C. Roy et al. Transportation Research Part C 131 (2021) 103339
Twitter. The data were purchased using keywords such as hurricane, matthew, hurricanematthew, huracan, huracanmatthew, hur
acan, storm, evacuation, evacuations, and FEMA. Matthew data contains 11.5 million tweets collected between September 25, 2016 to
October 24, 2016. We collected hurricane Irma data using Twitter streaming API for a selected bounding box covering Florida,
Georgia, North Carolina, and South Carolina. For hurricane Irma, we collected around 1.8 million geotagged tweets from September 5,
2017 to September 14, 2017.
4. Data preparation
Interstate highways I-75 and I-95 are the most popular routes during evacuations from Florida. We take the sum of the traffic
volume of I-75 and I-95 to capture the overall traffic demand during evacuation from the associated regions. Fig. 2 shows the traffic
volume generated during hurricanes Matthew and Irma. During hurricane Matthew, I-95 traffic was higher than I-75 traffic because
Matthew was expected to hit on the east coast. On the other hand, during hurricane Irma, at first traffic on I-95 was higher than I-75;
but later (after September 8, 2017) it was the opposite. This is reasonable as the projected path of hurricane Irma changed overnight on
September 8, 2017. Initially Irma was expected to hit from the east coast, but later it changed its path and was predicted to hit from the
west coast. Hurricane Matthew Twitter data are filtered for geotagged tweets within the study region bounded by the coordinates
(25.072, − 82.963; 29.352, − 79.232). Similarly, hurricane Irma data are also filtered by the tweets coming from our study area. We
also filter both data sets by evacuation related tweets having words such as ’evacuation’, ’evac’, ’sheltering’, ’evacuating’, ’evacuate’
etc. We aggregated the tweets based on 15 min interval to be consistent with the traffic volume data. The traffic data have some gaps;
since the missing data cover for a very small period, we linearly interpolate the missing data.
Hurricane Irma Twitter data have also some missing data, which we have recovered by collecting historical data, using REST API,
for the active users found in the streaming data during hurricane evacuation. We standardize the data before fitting the model. Fig. 3
shows the created features: tweet count, unique user count, evacuation tweet count at 15 min interval for both hurricanes Matthew
Fig. 3. Twitter Features (a) for hurricane Matthew (b) for hurricane Irma.
5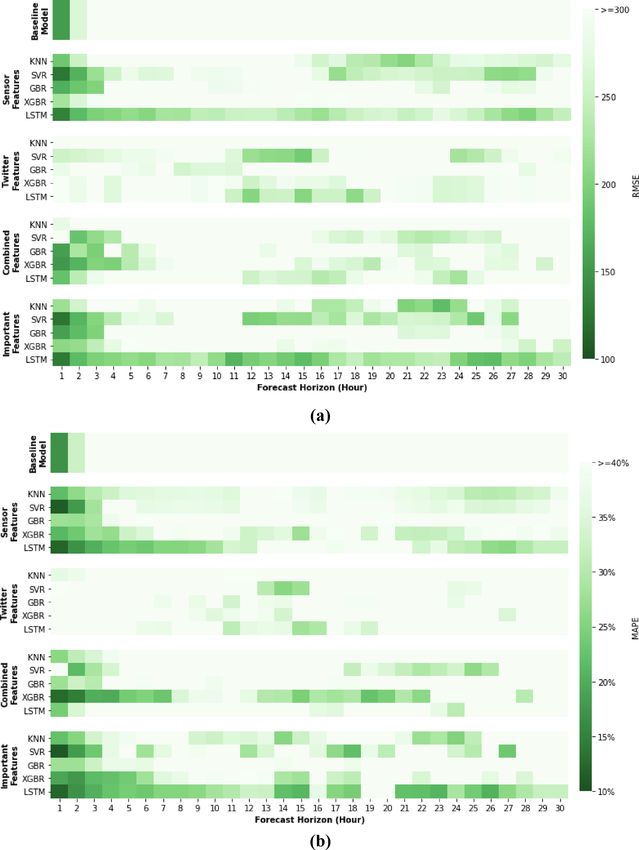
K.C. Roy et al. Transportation Research Part C 131 (2021) 103339
(Fig. 3a) and Irma (Fig. 3b). We have also created the following features: time difference (in hours) from landfall, hour of the day,
number of counties ordering mandatory evacuation, number of counties ordering voluntary evacuation, total number of populations
under voluntary order, total number of populations under mandatory order. We have used 2018 population data collected from
https://www.florida-demographics.com/counties_by_population. We collect the issuance time of an evacuation order for a county
from the official emergency management Twitter accounts of the corresponding county. Note that hurricane Matthew made its landfall
on October 8, 2016 and hurricane Irma made landfall on September 10, 2017. In total, we retrieve 716 hourly observations, 263 are
from Matthew and 453 are from Irma.
5. Modeling approach
To predict traffic demand during a hurricane evacuation, we have developed a neural network approach. In particular, we use a
long short-term memory neural network (LSTM-NN) architecture which is a special type of recurrent neural network (RNN). In ma
chine learning, recurrent neural networks (RNN) are used for learning sequential trends. It has been used to solve many problems such
as speech recognition (Graves et al., 2013), language modeling, image captioning etc. Unlike traditional neural networks, a recurrent
neural network has loops in them (Fig. 4(a) left) which allow to pass message to a successor. Fig. 4(a) (right) shows a one neuron RNN
unrolled over time. This chain-like nature reveals its potential to learn sequence both from current inputs and previous relevant
information.
Although standard RNN performs well in general time series forecasting, it performs less in learning long-term dependencies due to
vanishing/exploding gradient problem during backpropagation (Allen-Zhu et al., 2019; Gers et al., 1999; Hochreiter and Urgen
Schmidhuber, 1997). LSTM, introduced by Hochreiter and Schmidhuber, resolves this problem by remembering information for long
period of time (Hochreiter and Urgen Schmidhuber, 1997). Like RNN, LSTM also has the form of a chain of repeating modules of neural
network. Unlike RNN’s simple (e.g., a simple tanh layer) module, LSTM has four layers interacting in a very special way.
1
Fig. 4(b) shows an LSTM cell with different components in it. Here σ represents a sigmoid function σ (x) = 1+exp(− x) and tanh rep
resents a hyperbolic tangent function tanh(x) = exp(x)− exp(−
exp(x)+exp(− x) .
x)
The key difference between LSTM and RNN is the cell state (Ct ) shown as a
horizontal line in Fig. 4(b). It runs through the entire chain with some minor linear interaction. Thus, it helps to keep track of long-term
dependencies. It is also known as long-term state. LSTM allows to add or remove information to the cell state by some structures called
Fig. 4. Architecture of RNN (a) a single neuron RNN unrolled trough time (b) a standard LSTM cell.
6
K.C. Roy et al. Transportation Research Part C 131 (2021) 103339
gates. Gates are composed of a sigmoid neural net and a pointwise multiplication operation (see Fig. 4(b)). An LSTM has three such
gates: forget gate, input gate and output gate. Sigmoid layer gives output numbers between zero to one where zero means nothing and
one means everything. LSTM also uses the previous short-term state (ht− 1 ) and current input (Xt ) and feed this into the above discussed
layers. The first step is to decide what information to forget. For this, the forget gate (ft ) takes ht− 1 and Xt and outputs numbers between
0 and 1 for each element in the cell state. Mathematically, the operation is shown below in equation (1).
( )
ft = σ Wf .[ht− 1 , xt ] + bf (1)
where Wf , bf are the weight matrices and bias for the corresponding forget gate neural network. The next step decides what new
information to store in the cell states. It is performed in two parts: an input gate layer (it ) that decides which values to update through
its sigmoid layer and a tanh layer that converts the values into a vector (gt ) by its activation function. These two operations are shown
below in Eqs. (2) and (3).
it = σ(Wi .[ht− 1 , xt ] + bi ) (2)
where, Wi , bi are the weight matrices and bias for the corresponding input gate neural network.
( )
gt = tanh Wg .[ht− 1 , xt ] + bg (3)
where, Wg , bg are the weight matrices and bias for the corresponding tanh layer.
The next step is to update the old cell state (Ct− 1 ) into new state (Ct ). The new cell state will be the combined result after forget gate
and input gate operations. Eq. (4) shows the updated cell state:
Ct = f t *Ct− 1 + it *gt (4)
The last step is to predict the outputs from the current LSTM. The output is a filtered version of the current cell state (Ct ). The
previous state (ht− 1 ) and input (Xt ) go through a sigmoid layer and the cell state go through a tanh layer (to push the values to be
between − 1 and 1). Then multiplication of this two gives the output which is the decided part of the cell state. The operations are
shown in Eqs. (5) and (6):
ot = σ(Wo .[ht− 1 , xt ] + bo ) (5)
where, Wo andbo are the weight matrices and bias for the corresponding sigmoid layer.
ht = ot *tanh(Ct ) = Yt (6)
where, Yt is the output at time t.
6. Model development
The objective of this study is to predict traffic volume during hurricane evacuation for a longer time horizon. We define the
prediction problem as: given the traffic or Twitter data or both (Xt ) at time t, what is the traffic volume after h time intervals Y(t+h) , where h
represents the forecast horizon.
We have used traffic sensor data and Twitter data as inputs to the proposed LSTM-NN model. We use the LSTM model because of its
well-known performance in time series prediction. Previous studies found that LSTM model (Ma et al., 2015) or hybrid or fusion of
LSTM model (Bogaerts et al., 2020; Gu et al., 2019; Lee and Lin, 2020; Rahman and Hasan, 2021) outperformed other machine learning
models in traffic state prediction. Moreover, LSTM provides more flexibilities (with respect to the number of parameters and regu
larization) than other models and the training of a model (underfit or overfit) makes a difference in its performance (Beam, 2017).
Studies suggest that with appropriate training mechanisms, a deep learning model may be trained with 100 – 1000 samples (Beam,
2017; Pasupa and Sunhem, 2016; Zhang and Ling, 2018). Although these studies are based on classification tasks, the overall findings
should be applicable to a regression problem as well because of the marginal difference in the output layer and loss functions between a
classification and a regression task within the deep learning framework. In this study, we have selected the epoch size (number of
complete – both forward and backward – passes) depending on the forecast horizon and features so that the model is trained optimally.
Moreover, we have used dropout as a regularizer to prevent overfitting.
The LSTM-NN input data (X) needs to be provided with specific dimensions of array where dimension of X indicates [samples,
timesteps,features]. Our features are multivariate as we are using 10 features (traffic volume, time difference from landfall, hour of the
day, tweet count in the study area, evacuation related tweet count in the study area, unique user count, number of counties ordered
mandatory evacuation, number of counties ordered voluntary evacuation, number of people under voluntary evacuation, number of
people under mandatory evacuation) for a single time period. However, these features are used in different combinations—only sensor
data, only Twitter data, combination of both—to test how the model performs under different conditions of data availability. The time
step dimension indicates how many time instances we are using to predict the output. For example, [Xt− 1 , Xt ] can be used to make
prediction of Yt+h .
In our experiments, we find that a single layer LSTM with 50 neurons for all the models performs reasonably well. Batch size is a
parameter which represents the number of training example to be considered in one forward or backward pass. Studies show that
larger batch size degrades the quality of the model (Keskar et al., 2016). We find that batch size = 4 performs well on our data for all the
forecast horizons. Since we are interested in long-term forecasts, we choose 1 h as the lowest forecast horizon and gradually increase
7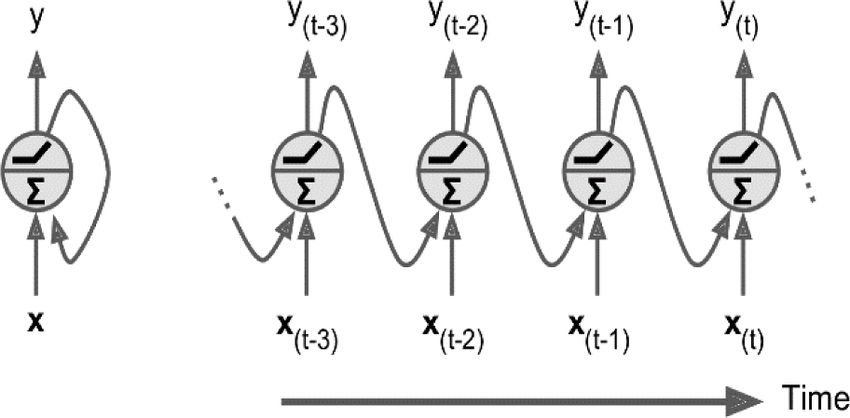
K.C. Roy et al.                                                                                                   Transportation Research Part C 131 (2021) 103339

the forecast horizon by an hour. We believe that increasing the forecast horizon at an hourly interval is reasonable for practical
implementation and computationally less expensive. To determine the forecast horizons for which the model performs well, we
iteratively run the model for forecast horizons from 1 h to 30 h. For each forecast horizon, we run the model 5 times with different
initializations. Along the run, we find the best epoch size (one forward and one backward pass on all training samples) to ensure that
the model does not overfit.
    Table 1 presents the summary of the estimated parameters in our study. We implemented all the models in Python programing
language. Unless otherwise specified in Table 1, we have used the default parameters of Keras (Chollet, et al., 2015) for LSTM and the
default parameters of Scikit-learn (Pedregosa et al., 2011) for the other models.
    We compare prediction accuracy of the proposed LSTM-NN model with traditional machine learning algorithms such as K-nearest
neighbor regression (KNN regression), support vector regression (SVR), gradient boosting regression (GBR), and XGBoost regression
(XGBR) models. We did not add ARIMA model since previous studies (Rahman and Hasan, 2018) found that, compared to other
machine learning models, an ARIMA model does not perform well for evacuation traffic prediction. We iteratively select the best
parameters for these algorithms using a grid search approach (Pedregosa et al., 2011). Generally, for the KNN algorithm, a large
number of neighbors underfits the model and a small number of neighbors overfits it. SVR tends to overfit with the increase in
polynomial degree. For GBR and XGBR, model complexity increases (or overfit) with the increase of parameter value of max depth and
the number of estimators. More details of these parameters and implementation can be found here (Chollet, et al., 2015; Geron, 2019;
Pedregosa et al., 2011). We report the average performance over 10-fold cross validation trials.
    To evaluate model performance, we have also created a baseline forecast. In this baseline forecast, the traffic volume in the next
time interval is simply predicted as equal to the current traffic volume. With forecast horizon h, at a given time (t), if the current traffic
volume is Yt , traffic prediction for (t +h) is equal to Yt (i.e., Yt+h = Yt ).
    Unlike other regression problems, in time series forecasting, the order of the observation is important to learn the sequence. Thus,
keeping the order of the sequence, we have used 80% of the data as training set and the rest as validation dataset. To evaluate the
performance of the implemented models, we have used Root Mean Squared Error (RMSE), Mean Absolute Percentage Error (MAPE) as
performance measures. We choose the best model considering the performance over all forecast horizons (i.e., the model that shows
overall stable performance). The equations for performance measures are given below:
                 √̅̅̅̅̅̅̅̅̅̅̅̅̅̅̅̅̅̅̅̅̅̅̅̅̅̅̅̅̅̅̅̅̅̅̅̅̅
                 √n (                            )2
                 √∑
                 √
                 √t=1 Yt+h − ̂y t+h
        RMSE =                                                                                                                            (7)
                                   n

                    ∑n
                        |Yt+h − ̂y t+h |
          MAPE =                         × 100%                                                                                                                (8)
                    t=1
                             Yt+h

   where, Yt+h is the actual traffic volume and ̂
                                                y t+h is the predicted traffic volume for forecast horizon h and nis the number of test
observations.

Table 1
Summary of the model parameters.
  Model      Parameter setup                                                  Summary of the best parameters for forecast
             (range of parameter values tried to find the best performance)   horizon 1 to 30
                                                                              (min, max, avg.) for numeric values
                                                                              {Frequency Distribution} for other type of parameters

                                                                              Sensor                 Twitter              Combined             Important

  KNN        Number of Neighbors (1, 15)                                      (3, 14, 12.5)          (1, 14, 11.33)       (2, 14, 11.66)       (2, 14, 10.06)
             p (1, 2)                                                         {1: 20,                {1: 26               {2: 17,              {1: 19,
                                                                              2: 10}                 2: 4}                1: 13}               2: 11}
  SVR        C (1, 1000)                                                      (201, 901, 757.66)     501 901 854.33       101 901 544.33       101 901 627.66
             Degree (1, 4)                                                    {3: 13,                {2: 17,              {1: 16,              {1: 12,
                                                                              2:10,                  3: 13}               2: 9,                2: 11,
                                                                              1: 7}                                       3:5}                 3: 7}
  GBR        Max Depth (2, 10)                                                (2, 9, 6.33)           (2, 9, 5.53)         (2, 9, 6.46)         (2, 9, 6.1)
             Number of Estimator (5, 15)                                      (7, 14, 12.7)          (9, 14, 13.06)       (9, 14, 13.43)       (8, 14, 13.43)
             Sub Sample (0.1, 1)                                              (0.2, 1.0, 0.54        (0.2, 0.8, 0.34)     (0.2, 1.0, 0.47)     (0.2, 1.0, 0.50)
  XGBR       Learning Rate (0.03, 0.08)                                       (0.03, 0.07, 0.06)     (0.03, 0.07, 0.05)   (0.03, 0.07, 0.05)   (0.03, 0.07, 0.05)
             Max Depth (5, 8)                                                 {5: 19,                {5: 18,              {6: 11,              {5: 14,
                                                                              6: 6,                  7: 7,                5: 11,               7: 9,
                                                                              7: 5}                  6: 5}                7: 8}                6: 7}
             Number of Estimator (5, 500)                                     (50, 500, 260)         (30, 500, 183.66)    (50, 500, 455)       (50, 500, 380)
  LSTM       Batch Size                                                       4
             Epoch Size (1, 3000)                                             (121, 2288, 952.17)    (4, 2993, 930.51)    (2, 2354, 347.52)    (5, 2999, 720.27)
             Number of LSTM cells                                             50
             Dropout                                                          0.50
             Optimizer                                                        ‘adam’
             Learning Rate                                                    0.0001

                                                                                 8
K.C. Roy et al. Transportation Research Part C 131 (2021) 103339
Next, we implement an approach to estimate the confidence interval of the predicted traffic volume. We assume that for a forecast
horizon h, the predicted traffic volume (̂ y t+h ) follows a normal distribution, where the parameters, mean (μt+h ) and standard
deviation(σ t+h ), depend on the input variables(X) at time t. Here,
( )
μt+h = f (Xt ) = predictedtrafficvolume ̂y t+h bythebestmodel (9)
To compute the standard deviation, we estimate separate models where the input is the same as the model for traffic volume
prediction, and the output is the absolute error (|Yt+h − ̂
y t+h |) for the estimated best model for traffic volume prediction.
σt+h = predictedstandarddeviationbythebesterrorpredictionmodel (10)
Finally, we compute the confidence interval at 90% confidence level by the following:
y t+h = μt+h − 1.65*σ t+h
Lowerboundof ̂
y t+h = μt+h + 1.65*σ t+h
Upperboundof ̂
7. Results
We implement the LSTM-NN model for different forecasting horizons ranging from 1 h to 30 h. Also, we run the model separately
considering 4 scenarios where only traffic sensor data, only Twitter data, combination of both, and only the top 4 important features
are used. We consider two features (time difference from landfall and hour of the day) available for all four scenarios.
We calculate the feature importance using permutation importance (Altmann et al., 2010). We calculate the importance of a feature
based on RMSE score. For each feature column, we shuffle the corresponding feature and compute the importance by checking how
much RMSE has increased. Feature importance values for all the available features are shown in Fig. 5 for different forecast horizons. It
shows that for a small forecast horizon (1 to 5 h), traffic volume has the highest importance. As the forecast horizon increases (7 to 30
h), importance value of time difference from landfall feature increases. This implies that in predicting traffic during evacuation for
longer forecasting horizon time difference from the forecasted landfall time plays a very critical role. Interestingly, Twitter features
have almost no importance for forecast horizon between (1–10 h), but the importance value increases from forecast horizon 11–15 h.
This matches the intuition that people tweet well before the actual evacuation. For example, these tweets–“Preparing to evacuate
knowing full well that I could come back to nothing is kinda terrifying. #HurricaneIrma”, “Bags packed ready to evacuate if needed #Hur
acanIrma”–indicate user intent to evacuate before their actual evacuation. In addition, we are considering Twitter activities in the
entire study region; but traffic is measured on two specific points (see Fig. 1). It takes time to travel to the exit point from the other
Fig. 5. Feature Importance for Different Forecast Horizons.
9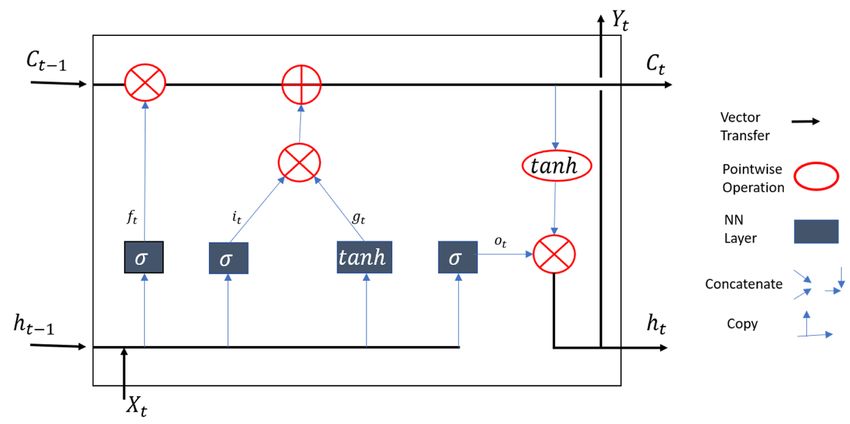
K.C. Roy et al.                                                                                       Transportation Research Part C 131 (2021) 103339

Fig. 6. Validation (a) RMSE (b) MAPE for different Forecast Horizons on Test Data. X-axis represents the forecast horizons, Y-axis shows the model
names. The color within a cell represents the model performance in terms of RMSE in (a) and MAPE in (b). The greener the color the better is the
performance.

                                                                       10
K.C. Roy et al. Transportation Research Part C 131 (2021) 103339
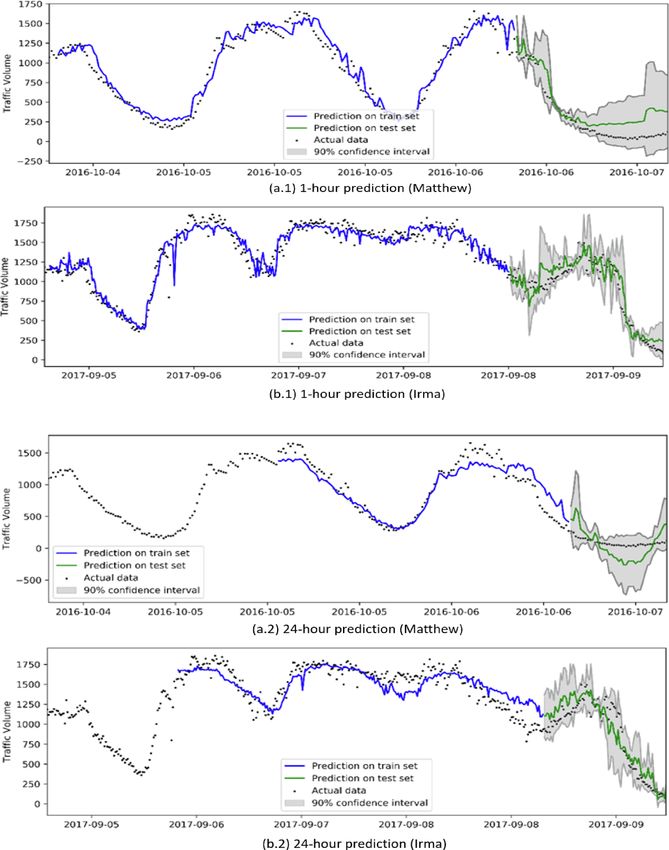
Fig. 7. Prediction with 90% confidence interval on training and test data when test data contains only hurricane Irma data. Here (a.1) and (b.1)
show 1-hr forecast for Matthew and Irma, respectively and (a.2) and (b.2) show 24-hour prediction for Matthew and Irma, respectively.
11K.C. Roy et al. Transportation Research Part C 131 (2021) 103339
points within the study area. Nonetheless, it means that the Twitter features are very important in predicting traffic volume around
11–15 h ahead.
The test RMSE and test MAPE for of the models are shown in Fig. 6. We run the models for different forecast horizons with different
combination of features. Except for the Twitter only features, in all the combinations, 1-hour forecast horizon has the lowest RMSE and
MAPE values. This is expected since we have the most recent information in this case for our prediction purpose. As the forecast
horizon increases, RMSE and MAPE increase with some exceptions.
For forecast horizons 1 h to 12 h, the model trained with only sensor data has performed better than the models trained with only
Twitter features or combined features. This is consistent with the results related to feature importance where we found that traffic
Fig. 8. Prediction with 90% Confidence Interval on training and test data when test data contains both Matthew and Irma data. Here (a.1) and (b.1)
show 1-hr forecast for Matthew and Irma respectively, and (a.2) and (b.2) show 24-hour prediction for Matthew and Irma respectively.
12K.C. Roy et al. Transportation Research Part C 131 (2021) 103339
volume has higher importance for shorter forecast horizons. Models trained with only Twitter features perform well for forecast
horizons 10 h to 19 h (see Fig. 6), which is also consistent with the feature importance analysis. This is probably due to the fact that
people post about their hurricane awareness or evacuation intent prior to the actual action. Also, the distances between the sensor
locations and the location of Twitter users are not same for all the areas within the study region. Thus, it may take some time to realize
the traffic impacts of those users stating evacuation intent in Twitter. The result indicates that, when traffic sensor data is not available,
Twitter data can be used to predict traffic demand during evacuation from 10 h to 20 h forecast horizons. However, models trained on
combined features, containing all the available features, do not perform well (see Fig. 6). Adding unnecessary features degrades model
performance in this case. For all the models, performances are better for the important features among the four (sensor, Twitter,
combined, important features) feature types. Using only important features, models are performing consistently better than the sensor
features for forecast horizons 11 h to 23 h.
The performances of all models are compared against a baseline forecast. For 1-hour and 2-hour forecasting horizons, all models
trained with only Twitter data failed to outperform the baseline results and for the other feature combinations only the LSTM models
and SVR models outperform baseline forecast. We can see that overall LSTM-NN models perform better than the baseline and other
models for all feature types (see Fig. 6). The performances of the LSTM-NN models are more consistent across all forecast horizons
compared to the other models. This shows the advantage of an LSTM-NN modeling framework to capture both short-term and long-
term dependencies in predicting traffic during evacuation.
The LSTM-NN model performs best (RMSE = 110, MAPE = 13%) for 1-hour forecast horizon when trained with important features
or only sensor features. LSTM-NN model trained with only Twitter data has the best result (RMSE = 203, MAPE = 28%) for 15-hour
forecasting horizon, which is better compared to the performance found for the models trained with combined features and only sensor
features for the same forecast horizon. This indicates that when traffic sensor data are unavailable, Twitter data can be used to obtain
reasonable prediction on future evacuation demand. Using top 4 important features (adding Twitter features with the sensor data)
lowers the RMSE value to 160 and MAPE value to 25% for a 15-hour forecast horizon for the LSTM-NN model.
To further evaluate the prediction performance and the robustness of the models across hurricanes, we run two types of experi
ments. In the first experiment (Fig. 7), we train models for different forecast horizons using full hurricane Matthew and part of Irma as
training data and test the models using the remaining part of Irma data. In the second experiment (Fig. 8), we train models for different
forecast horizons using part of hurricane Matthew and part of Irma data as training data and the remaining parts of Matthew and Irma
data as test data. In all these experiments, we use the LSTM models trained on important features only, derived previously. We report
here only the results for 1-hour and 24-hour forecast horizons. In Figs. 7 and 8, (a) and (b) represent Matthew and Irma data and (1)
and (2) represent 1-hour and 24-hour predictions, respectively. For a 24-hour forecast horizon, there is no prediction on the first 24 h of
data, because training data are not available for 24 h before a given period.
Fig. 7a.1 and 7b.1 together show the results of the LSTM model that has been trained over full hurricane Matthew data and a
portion of hurricane Irma data and tested over the rest of the hurricane Irma data, for a 1-hour forecast horizon. Similarly, Fig. 7a.2 and
b.2 together show the results of the LSTM model that has been trained over full hurricane Matthew data and a portion of hurricane Irma
data and tested over the rest of the hurricane Irma data, for a 24-hour forecast horizon. Fig. 7a.1 and a.2 do not show any result for test
set for hurricane Matthew, because in this experiment, we considered all data from hurricane Matthew as training data.
Fig. 8a.1 and b.1 together show the results of the LSTM model that has been trained using part of hurricane Matthew and part of
Irma data as training data and tested over the remaining parts of Matthew and Irma data for 1-hour forecast horizon. Similarly,
Fig. 8a.2 and 8b.2 together show the results of LSTM model that has been trained over a part of hurricane Matthew and part of Irma
data and tested over the remaining parts of Matthew and Irma data for 24-hour forecast horizon.
Prediction on training data fits well for both hurricanes Matthew and Irma for 1-hour and 24-hour forecast horizons. As expected,
model performance on training data is comparatively better than on test data. For example, Fig. 7(a.1) shows model prediction over the
training data, which is already known to the model, whereas Fig. 8 (a.1) shows model prediction on unknown test data. Thus, it is
expected that model prediction performance will slightly deteriorate in Fig. 8 (a.1). On the other hand, prediction on the test data show
that, prediction for 1-hour forecast horizon fits better than the prediction for 24-hour horizon, capturing the trend well enough. We
also find that the model is predicting better for hurricane Irma test data than hurricane Matthew test data. This is because we have
more training data available for hurricane Irma than hurricane Matthew. As such the results can be further improved by recording the
trends of traffic volume over time for multiple hurricanes. Although prediction accuracy decreases with longer forecast horizon, the
implemented model learns the overall trend (increasing or decreasing evacuation traffic) well enough.
We have also shown the 90% confidence interval of the prediction on test set for 1-hour and 24-hour forecast horizons. We found
that k-nearest neighbors (neighbors = 3) perform best in predicting the absolute error. Predicted value by the best model (LSTM-NN) is
always in between the predicted confidence interval. Moreover, the interval is greater when the demand prediction error is greater,
and the interval is almost equal to zero when the LSTM-NN model make perfect traffic demand prediction (see Figs. 7 and 8). Thus, the
confidence interval prediction is working well in capturing the uncertainty in prediction by the LSTM-NN model. Evacuation demand
prediction with its associated confidence interval will help interpret the prediction results more reliably.
8. Limitations and future research directions
Our study has some limitations. We have used traffic demand collected from traffic detectors and there are detectors at only two
highways (I75 and I95) at the downstream boundary of the study area. We have simplified the problem by adding the traffic from I to
75 and I-95 to determine the total traffic demand during evacuation. Although most evacuees during evacuations use one of these two
highways, this assumption may not hold in some areas. However, our approach can be generalized for any number of highways (any
13K.C. Roy et al. Transportation Research Part C 131 (2021) 103339
size of study area) given the availability of the data. In addition, traffic sensor data suffer from missing information. Machine learning
techniques (Alemazkoor et al., 2018) can be used to fill the information gaps in traffic sensors. We have used evacuation related tweets
based on the presence of certain pre-selected keywords. Natural language processing models (Verma et al., 2011) can be developed to
infer evacuation intent from social media posts. Furthermore, Twitter data suffer from demographic biases; population from certain
areas may post more evacuation related tweets compared to other areas. Such biases should be corrected to rigorously predict
evacuation traffic from tweets. Thus, further research addressing sensor selection and bias correction for Twitter data may improve our
prediction accuracy in future.
Every hurricane is different from each other in many aspects, such as severity, hurricane path, and intensity. Thus, the generated
evacuation traffic can be different from one hurricane to other. For example, evacuation traffic during hurricane Matthew and Irma
shows different pattern (see Fig. 2). Our approach presented in this study capture these two different patterns by adopting some real-
time features (sensors, social media posts etc.). Considering the unpredictable behavior of the hurricanes, hurricane specific model
might perform better in predicting traffic during hurricane. While conducting our study, we find that many traffic sensors suffer
disruptions during hurricane that makes it difficult to collect enough traffic sample to train separate models for each hurricane.
Adopting domain adaption or transfer learning approach (Pan and Yang, 2009) to train models on historical hurricane data set and
calibrate the model as new hurricane data is available should be explored in future research.
We have summed up the volumes of two major highways at the downstream cut-off points to get the total traffic volume at any
given time irrespective of destination. Thus, evacuation destination choice (outside the study area) is less likely to have any effect on
the traffic demand generated from the region. Our approach has missed the internal evacuation within the study area. However,
because hurricane Irma was projected to affect a wide area (from East coast to West coast of Florida), such internal evacuation would
be limited. Future study may adopt a spatially aware (Ghafoorian et al., 2017) deep learning technique considering relative location of
the tweets and traffic sensors. A hybrid approach by combining a location aware Convolutional Neural Network (Ghafoorian et al.,
2017) with an LSTM model (to capture the temporal effect) might be explored in future studies.
9. Conclusions
Traditional approaches for predicting hurricane evacuation demand use survey-based data and they work well upon a fixed set of
assumptions, which may not be suitable for real-time traffic prediction. Information from real time data sources can make evacuation
traffic management more dynamic, flexible, and proactive. In this study, we have used traffic sensor and Twitter data to predict traffic
demand during evacuation for longer term forecasting horizons. We have applied a machine learning model known as LSTM neural
networks to predict traffic demand during evacuation for different forecast horizons ranging from 1 h to 30 h. We have applied the
model for different combination of features (only traffic sensor data, only Twitter data, both sensor and Twitter data, only important
features). Among the modeling approaches, LSTM-NN outperforms other models in terms of accuracy. Social media features show its
best predictive power for 15 h forecast horizon. Model trained on social media data can help make reasonable predictions of traffic
during evacuation when sensor data are not available. We also implement a method to predict the confidence interval of the demand
prediction made by the model. These approaches allow us to measure the reliability of the predicted traffic demand during evacuation.
With increasing population and the number of hurricanes in the coastal regions, efficient and demand responsive evacuation traffic
management is warranted. Our study integrates data from multiple sources which are readily available to predict traffic demand
during hurricanes. While more studies are needed to predict evacuation traffic at a network-wide level, this study serves as a key step
towards building a pro-active and demand responsive evacuation traffic management system.
CRediT authorship contribution statement
Kamol Chandra Roy: Conceptualization, Formal analysis, Methodology, Visualization, Writing - original draft. Samiul Hasan:
Conceptualization, Funding acquisition, Methodology, Project administration, Supervision, Writing - review & editing. Aron Culotta:
Methodology, Writing - review & editing. Naveen Eluru: Methodology, Writing - review & editing.
Declaration of Competing Interest
The authors declare that they have no known competing financial interests or personal relationships that could have appeared to
influence the work reported in this paper.
Acknowledgment
The authors are grateful to the U.S. National Science Foundation for the grant CMMI-1832578 and CMMI-1917019 to support the
research presented in this paper. However, the authors are solely responsible for the findings presented in this paper. We also
acknowledge Rezaur Rahman of University of Central Florida who assisted us in the final revision of this article.
References
Alemazkoor, N., Wang, S., Meidani, H., 2018. A Recursive Data-driven Model for Traffic Flow Predictions for Locations with Faulty Sensors. In: 2018 21st
International Conference on Intelligent Transportation Systems (ITSC), pp. 1646–1651.
14K.C. Roy et al. Transportation Research Part C 131 (2021) 103339
Allen-Zhu, Z., Li, Y., Song, Z., 2019. On the convergence rate of training recurrent neural networks. Advances in Neural Information Processing Systems. 1310–1318.
Altmann, A., Toloşi, L., Sander, O., Lengauer, T., 2010. Permutation importance: a corrected feature importance measure. Bioinformatics 26, 1340–1347.
Anderson, J.W., 1968. Cultural adaptation to threatened disaster. Hum. Organ. 27, 298–307.
Arlikatti, S., Lindell, M.K., Prater, C.S., Zhang, Y., 2006. Risk area accuracy and hurricane evacuation expectations of coastal residents. Environ. Behav. 38, 226–247.
Baker, E.J., 1979. Predicting response to hurricane warnings-reanalysis of data from 4 Studies. Mass emergencies 4, 9–24.
Beam, A.L., 2017. You can probably use deep learning even if your data isn’t that big [WWW Document]. URL https://beamandrew.github.io/deeplearning/2017/06/
04/deep_learning_works.html.
Blanton, B., Dresback, K., Colle, B., Kolar, R., Vergara, H., Hong, Y., Leonardo, N., Davidson, R., Nozick, L., Wachtendorf, T., 2020. An Integrated Scenario Ensemble-
Based Framework for Hurricane Evacuation Modeling: Part 2—Hazard Modeling. Risk Anal. 40, 117–133.
Bogaerts, T., Masegosa, A.D., Angarita-Zapata, J.S., Onieva, E., Hellinckx, P., 2020. A graph CNN-LSTM neural network for short and long-term traffic forecasting
based on trajectory data. Transp. Res. Part C Emerg. Technol. 112, 62–77. https://doi.org/10.1016/j.trc.2020.01.010.
Chollet, F., others, 2015. Keras. https://keras.io.
Davidson, R.A., Nozick, L.K., Wachtendorf, T., Blanton, B., Colle, B., Kolar, R.L., DeYoung, S., Dresback, K.M., Yi, W., Yang, K., et al., 2020. An Integrated Scenario
Ensemble-Based Framework for Hurricane Evacuation Modeling: Part 1—Decision Support System. Risk Anal. 40, 97–116.
Fothergill, A., 1996. Gender, risk, and disaster. Int. J. Mass Emerg. Disasters 14, 33–56.
Fry, J., Binner, J.M., 2015. Elementary modelling and behavioural analysis for emergency evacuations using social media. Eur. J. Oper. Res. 249, 1014–1023.
Garg, M., Kumar, M., 2016. Review on event detection techniques in social multimedia. Online Inf. Rev. 40, 347–361.
Geron, A., 2019. Hands-on machine learning with Scikit-Learn, Keras. and TensorFlow: Concepts, tools, and techniques to build intelligent systems. O’Reilly Media.
Gers, F.A., Schmidhuber, J., Cummins, F., 1999. Learning to forget: Continual prediction with LSTM, in: 9th International Conference on Artificial Neural Networks:
ICANN ’99. IET.
Ghafoorian, M., Karssemeijer, N., Heskes, T., van Uden, I.W.M., Sanchez, C.I., Litjens, G., de Leeuw, F.-E., van Ginneken, B., Marchiori, E., Platel, B., 2017. Location
sensitive deep convolutional neural networks for segmentation of white matter hyperintensities. Sci. Rep. 7, 1–12.
Golshani, N., Shabanpour, R., Mohammadian, A., Auld, J., Ley, H., 2020. Modeling evacuation demand during no-notice emergency events: Tour formation behavior.
Transp. Res. Part C Emerg. Technol. 118, 102713. https://doi.org/10.1016/j.trc.2020.102713.
Golshani, N., Shabanpour, R., Mohammadian, A., Auld, J., Ley, H., 2019. Evacuation decision behavior for no-notice emergency events. Transp. Res. Part D Transp.
Environ. 77, 364–377. https://doi.org/10.1016/j.trd.2019.01.025.
Graves, A., Mohamed, A., Hinton, G., 2013. Speech recognition with deep recurrent neural networks, in: Acoustics, Speech and Signal Processing (Icassp), 2013 Ieee
International Conference On. pp. 6645–6649.
Gu, Y., Lu, W., Qin, L., Li, M., Shao, Z., 2019. Short-term prediction of lane-level traffic speeds: A fusion deep learning model. Transp. Res. part C Emerg. Technol. 106,
1–16.
Gu, Y., Qian, Z.S., Chen, F., 2016. From Twitter to detector: Real-time traffic incident detection using social media data. Transp. Res. part C Emerg. Technol. 67,
321–342.
Guan, X., Chen, C., 2014. Using social media data to understand and assess disasters. Nat. hazards 74, 837–850.
Gudishala, R., Wilmot, C., 2013. Predictive Quality of a Time-Dependent Sequential Logit Evacuation Demand Model. Transp. Res. Rec. J. Transp. Res. Board 2376
(1), 38–44. https://doi.org/10.3141/2376-05.
Gudishala, R., Wilmot, C., 2012. Comparison of Time-Dependent Sequential Logit and Nested Logit for Modeling Hurricane Evacuation Demand. Transp. Res. Rec.
2312 (1), 134–140. https://doi.org/10.3141/2312-14.
Hasan, S., Mesa-Arango, R., Ukkusuri, S., 2013. A random-parameter hazard-based model to understand household evacuation timing behavior. Transp. Res. Part C
Emerg. Technol. 27, 108–116.
Hasan, S., Ukkusuri, S., Gladwin, H., Murray-Tuite, P., 2011. Behavioral Model to Understand Household-Level Hurricane Evacuation Decision Making. J. Transp.
Eng. 137, 341–348.
He, J., Shen, W., Divakaruni, P., Wynter, L., Lawrence, R., 2013. Improving traffic prediction with tweet semantics. IJCAI Int. Jt. Conf. Artif. Intell. 1387–1393.
Hochreiter, S., Schmidhuber, J., 1997. Long Short-Term Memory. Neural Comput. 9 (8), 1735–1780. https://doi.org/10.1162/neco.1997.9.8.1735.
Huang, S.-K., Lindell, M.K., Prater, C.S., 2016. Who leaves and who stays? A review and statistical meta-analysis of hurricane evacuation studies. Environ. Behav. 48,
991–1029.
Keskar, N.S., Mudigere, D., Nocedal, J., Smelyanskiy, M., Tang, P.T.P., 2016. On large-batch training for deep learning: Generalization gap and sharp minima. arXiv
Prepr. arXiv1609.04836.
Kryvasheyeu Y, Chen H, Moro E, Van Hentenryck P, C.M., 2015. Performance of Social Network Sensors During Hurricane Sandy. PLoS one 10.2 e0117288. 10.
Kubisch, Susanne, Guth, Johanna, Keller, Sina, Bull, María T., Keller, Lars, Braun, Andreas Ch., 2020. The contribution of tsunami evacuation analysis to evacuation
planning in Chile: Applying a multi-perspective research design. Int. J. Disaster Risk Reduct. 45, 101462. https://doi.org/10.1016/j.ijdrr.2019.101462.
Kurkcu, A., Morgul, E.F., Ozbay, K., 2015. Extended implementation method for virtual sensors: web-based real-time transportation data collection and analysis for
incident management. Transp. Res. Rec. J. Transp. Res. Board 27–37.
Latonero, M., Shklovski, I., 2013. Emergency Management, Twitter, and Social Media Evangelism. Using Soc. Inf. Technol. Disaster Cris. Manag. 3, 196–212.
Lee, M.-C., Lin, J.-C., 2020. DALC: Distributed Automatic LSTM Customization for Fine-Grained Traffic Speed Prediction. In: Barolli, L., Amato, F., Moscato, F.,
Enokido, T., Takizawa, M. (Eds.), Advanced Information Networking and Applications. Springer International Publishing, Cham, pp. 164–175.
Lindell, Michael K, Arlikatti, S., Huang, S.-K., 2019a. Immediate behavioral response to the June 17, 2013 flash floods in Uttarakhand, North India. Int. J. disaster risk
Reduct. 34, 129–146.
Lindell, Michael K., Murray-Tuite, P., Wolshon, B., Baker, E.J., 2019b. Large-Scale Evacuation: The Analysis, Modeling, and Management of Emergency Relocation
from Harzardous Areas. CRC Press.
Litman, T., 2006. Lessons from Katrina and Rita: What major disasters can teach transportation planners. J. Transp. Eng. 132, 11–18. https://doi.org/10.1061/(ASCE)
0733-947X(2006)132:1(11).
Lv, Y., Chen, Y., Zhang, X., Duan, Y., Li, N., 2017. Social Media based Transportation Research : the State of the Work and the Networking 4, 19–26.
Ma, X., Tao, Z., Wang, Yinhai, Yu, H., Wang, Yunpeng, 2015. Long short-term memory neural network for traffic speed prediction using remote microwave sensor
data. Transp. Res. Part C Emerg. Technol. 54, 187–197. https://doi.org/10.1016/j.trc.2015.03.014.
Meng, Meng, Shao, Chun-fu, Wong, Yiik-diew, Wang, Bo-bin, Li, Hui-xuan, 2015. A two-stage short-term traffic flow prediction method based on AVL and AKNN
techniques. J. Cent. South Univ. 22 (2), 779–786. https://doi.org/10.1007/s11771-015-2582-y.
Mesa-arango, R., Hasan, S., Ukkusuri, S.V., Asce, A.M., Murray-tuite, P., 2013. Household-Level Model for Hurricane Evacuation Destination Type Choice Using
Hurricane Ivan Data. Nat. Hazards Rev. 14, 11–20.
Mosher, D., 2017. The crucial reason Houston officials didn’t order evacuations before Harvey made landfall. [WWW Document]. URL https://www.mysanantonio.
com/technology/businessinsider/article/Why-evacuating-major-cities-before-a-hurricane-12073727.php.
Murray-Tuite, P., Ge, Y.G., Zobel, C., Nateghi, R., Wang, H., 2019. Critical time, space, and decision-making agent considerations in human-centered interdisciplinary
hurricane-related research. Risk Anal. https://doi.org/10.1111/risa.13380.
Murray-Tuite, Pamela, Ge, Y. Gurt, Zobel, Christopher, Nateghi, Roshanak, Wang, Haizhong, 2021. Critical Time, Space, and Decision-Making Agent Considerations in
Human-Centered Interdisciplinary Hurricane-Related Research. Risk Anal 41 (7), 1218–1226. https://doi.org/10.1111/risa:v41.710.1111/risa:13380.
Murray-Tuite, P., Wolshon, B., 2013. Evacuation transportation modeling: An overview of research, development, and practice. Transp. Res. Part C Emerg. Technol.
27, 25–45.
Ni, M., He, Q., Gao, J., 2017. Forecasting the Subway Passenger Flow under Event Occurrences with Social Media. IEEE Trans. Intell. Transp. Syst. 18, 1623–1632.
https://doi.org/10.1109/TITS.2016.2611644.
15You can also read