NORTH YONGE STREET CORRIDOR PUBLIC TRANSIT AND ASSOCIATED ROAD IMPROVEMENTS TRANSIT CLASS ENVIRONMENTAL ASSESSMENT - York Region Rapid Transit ...
←
→
Page content transcription
If your browser does not render page correctly, please read the page content below
York Region Rapid Transit Corporation

NORTH YONGE STREET CORRIDOR PUBLIC TRANSIT AND
ASSOCIATED ROAD IMPROVEMENTS TRANSIT CLASS
ENVIRONMENTAL ASSESSMENT

TRANSPORTATION ASSESSMENT
AUGUST 2008
IBI GROUP TRANSPORTATION ASSESSMENT

TABLE OF CONTENTS

              1.    INTRODUCTION ......................................................................................................................1

              1.1   Study Area and Rapid Transit Corridor............................................................................................... 1

              1.2   Approach................................................................................................................................................ 1

              1.3   Relationship to Other Studies .............................................................................................................. 4
                    1 . 3 .1 D a vi s D ri v e C l as s E A - Yo n g e St re et t o H ig h w a y 4 0 4. . . . . . . . . . . . . . . . . . . . . . . . . . . . . . . . . . . . . 4
                    1 . 3 .2 South Yonge St reet Corridor Public T r a n s i t I m p ro v e m e n t s R e p o rt . . . . . . . . . . . . . . . . . 4

              1.4   Organization of Report ......................................................................................................................... 4

              2.    EXISTING CONDITIONS .........................................................................................................6

              2.1   Transportation Network........................................................................................................................ 6
                    2 . 1 .1 R o ad N et w o r k . . . . . . . . . . . . . . . . . . . . . . . . . . . . . . . . . . . . . . . . . . . . . . . . . . . . . . . . . . . . . . . . . . . . . . . . . . . . . . . . . . . . . . . . . . . . . 6
                    2 . 1 .2 T r ans it N et w o r k . . . . . . . . . . . . . . . . . . . . . . . . . . . . . . . . . . . . . . . . . . . . . . . . . . . . . . . . . . . . . . . . . . . . . . . . . . . . . . . . . . . . . . . . . . 7
                    2 . 1 .3 G O T ra n s it T e rmi n a l s . . . . . . . . . . . . . . . . . . . . . . . . . . . . . . . . . . . . . . . . . . . . . . . . . . . . . . . . . . . . . . . . . . . . . . . . . . . . . . . . . . 9
                    2 . 1 .4 P a r k an d R id e L o t s . . . . . . . . . . . . . . . . . . . . . . . . . . . . . . . . . . . . . . . . . . . . . . . . . . . . . . . . . . . . . . . . . . . . . . . . . . . . . . . . . . . . . 9
                    2 . 1 .5 P e d e st r ian and C y cl ing N et w o r k . . . . . . . . . . . . . . . . . . . . . . . . . . . . . . . . . . . . . . . . . . . . . . . . . . . . . . . . . . . . . . . . . 1 0

              2.2   Traffic Volumes and Travel Patterns ................................................................................................. 13
                    2 . 2 .1 E x i st in g T raff i c P at t e rn s . . . . . . . . . . . . . . . . . . . . . . . . . . . . . . . . . . . . . . . . . . . . . . . . . . . . . . . . . . . . . . . . . . . . . . . . . . . . 1 3
                    2 . 2 .2 E x i st in g T raff i c Vo lum e s a n d R e l at i o n sh ip t o C ap a cit y . . . . . . . . . . . . . . . . . . . . . . . . . . . . . . . . 1 5

              2.3   Existing Intersection Operations ....................................................................................................... 19

              2.4   Existing Transit Volumes and Performance Levels ......................................................................... 24
                    2 . 4 .1 E x i st in g T ran s it Vo lum es . . . . . . . . . . . . . . . . . . . . . . . . . . . . . . . . . . . . . . . . . . . . . . . . . . . . . . . . . . . . . . . . . . . . . . . . . . . 2 4
                    2 . 4 .2 E x i st in g T ran s it P e rfo rm a n ce . . . . . . . . . . . . . . . . . . . . . . . . . . . . . . . . . . . . . . . . . . . . . . . . . . . . . . . . . . . . . . . . . . . . . 2 4

              3.    FUTURE BASE CASE TRANSPORTATION CONDITIONS.................................................26

              3.1   Future Land Use Projections.............................................................................................................. 26

              3.2   Future Road Improvements................................................................................................................ 32

              3.3   Future Transit Improvements............................................................................................................. 34

              3.4   Future Travel Demand Projections .................................................................................................... 34
                    3 . 4 .1 F u t u r e B as e C as e In t e r se c t ion O p e ra t i o n s . . . . . . . . . . . . . . . . . . . . . . . . . . . . . . . . . . . . . . . . . . . . . . . . . . 3 6

August 2008                                                                                                                                                                                                                       Page i.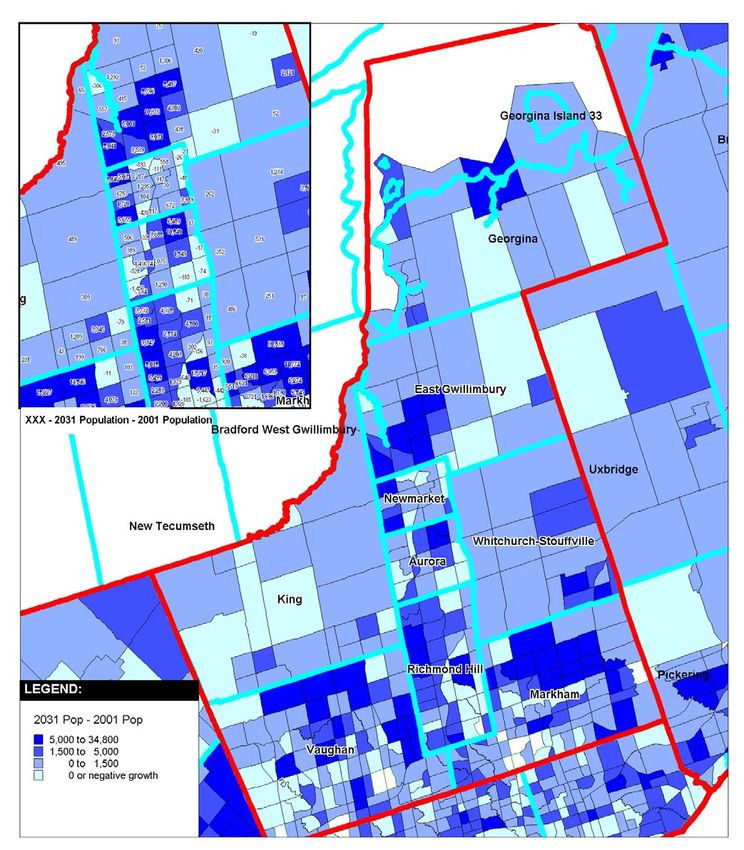
IBI GROUP TRANSPORTATION ASSESSMENT

TABLE OF CONTENTS (CONT’D)

              4.    TRANSPORTATION ASSESSMENT OF RAPID TRANSIT ALTERANTIVES.....................37

              4.1   Routing Alternatives ........................................................................................................................... 37
                    4 . 1 .1 T r av e l T im e A lo n g E ach R o u t e . . . . . . . . . . . . . . . . . . . . . . . . . . . . . . . . . . . . . . . . . . . . . . . . . . . . . . . . . . . . . . . . . . . . 3 8
                    4 . 1 .2 T r ans it Pa s se n g er Vo lum e s . . . . . . . . . . . . . . . . . . . . . . . . . . . . . . . . . . . . . . . . . . . . . . . . . . . . . . . . . . . . . . . . . . . . . . . . 3 9
                    4 . 1 .3 T r ans it B o a rd in g s . . . . . . . . . . . . . . . . . . . . . . . . . . . . . . . . . . . . . . . . . . . . . . . . . . . . . . . . . . . . . . . . . . . . . . . . . . . . . . . . . . . . . . 4 0
                    4 . 1 .4 P r o x im it y t o R es id en t s and Job s . . . . . . . . . . . . . . . . . . . . . . . . . . . . . . . . . . . . . . . . . . . . . . . . . . . . . . . . . . . . . . . . 4 1
                    4 . 1 .5 S u m m a ry . . . . . . . . . . . . . . . . . . . . . . . . . . . . . . . . . . . . . . . . . . . . . . . . . . . . . . . . . . . . . . . . . . . . . . . . . . . . . . . . . . . . . . . . . . . . . . . . . . . 4 4

              4.2   Physical Infrastructure Alternatives .................................................................................................. 44
                    4 . 2 .1 Y o n g e S t r e et – Mu loc k t o D av i s D ri ve . . . . . . . . . . . . . . . . . . . . . . . . . . . . . . . . . . . . . . . . . . . . . . . . . . . . . . . . . 4 4
                    4 . 2 .2 Y o n g e S t r e et – D a v is D r iv e t o G r een L an e . . . . . . . . . . . . . . . . . . . . . . . . . . . . . . . . . . . . . . . . . . . . . . . . . . . . 4 6
                    4 . 2 .3 Y o n g e S t r e et - A u ro r a H e i g h t s D r i ve t o S a va g e R o ad S o u t h . . . . . . . . . . . . . . . . . . . . . . . . . . 4 8
                    4 . 2 .4 D a vi s D ri v e – Yon g e St re e t t o H ig h w a y 40 4 . . . . . . . . . . . . . . . . . . . . . . . . . . . . . . . . . . . . . . . . . . . . . . . . . 5 0

              4.3   Detailed Alignment Options for Davis Drive ..................................................................................... 53
                    4 . 3 .1 U p p e r C an ad a M al l O p t io n s . . . . . . . . . . . . . . . . . . . . . . . . . . . . . . . . . . . . . . . . . . . . . . . . . . . . . . . . . . . . . . . . . . . . . . . . 5 3
                    4 . 3 .2 S i t in g o f St at ion s o n D a vi s D r iv e . . . . . . . . . . . . . . . . . . . . . . . . . . . . . . . . . . . . . . . . . . . . . . . . . . . . . . . . . . . . . . . . 5 6
                    4 . 3 .3 I m p act o f E xt en d ing Se rv i c e t o H ig h w ay 40 4 . . . . . . . . . . . . . . . . . . . . . . . . . . . . . . . . . . . . . . . . . . . . . . . 5 7

              4.4   Requirement for Exclusive Turn Lanes............................................................................................. 58

              4.5   Transition Areas .................................................................................................................................. 58

              5.    ASSESSMENT OF PREFERRED RAPID TRANSIT ALTERNATIVE AND
                    MITIGATION MEASURES .....................................................................................................60

              5.1   Description of Preferred Rapid Transit Alternative.......................................................................... 60

              5.2   Future Traffic Operations ................................................................................................................... 61

              5.3   Assessment of Effects of Preferred Design and Proposed Mitigation Measures ......................... 66

              Appendix A:                  Inventory of Count Data
              Appendix B:                  Existing Signalized Intersection Operations
              Appendix C:                  Future Base Case Signalized Intersection Operations
              Appendix D:                  Storage Length Analysis
              Appendix E:                  Future Signalized Intersection Operations for Preferred Design

August 2008                                                                                                                                                                                                                             Page ii.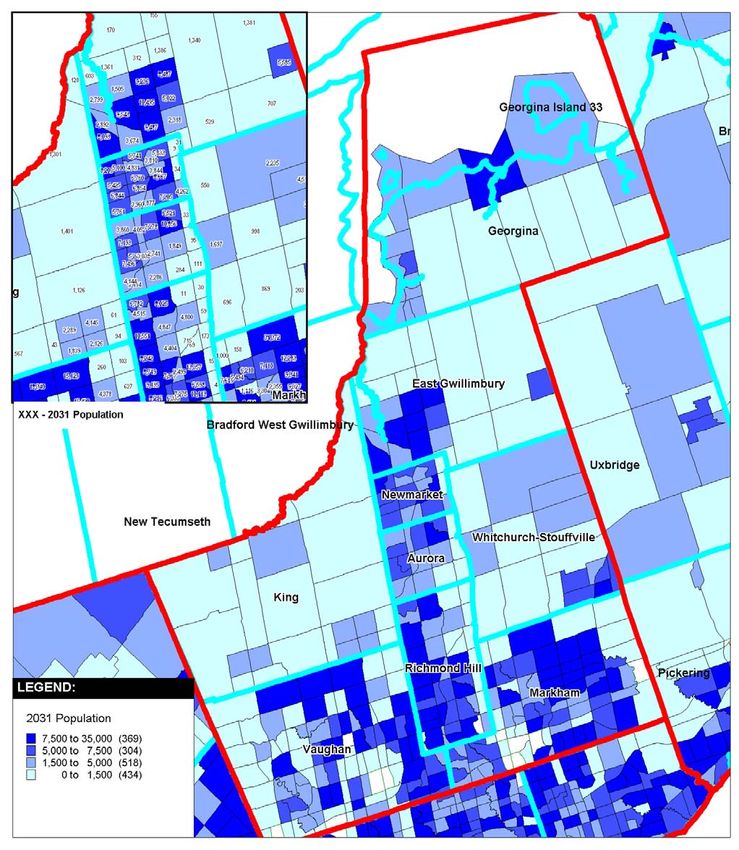
IBI GROUP TRANSPORTATION ASSESSMENT
TABLE OF CONTENTS (CONT’D)
List of Exhibits
Exhibit 1.1: Primary Study Area and Recommended Route...............................................................2
Exhibit 1.2: Short-listed Transit Routing Alternatives..........................................................................3
Exhibit 2.1: Existing Transit Network ..................................................................................................8
Exhibit 2.2 – High Pedestrian Areas .................................................................................................11
Exhibit 2.3 Sidewalk Provisions ........................................................................................................12
Exhibit 2.4- Cycling Routes in the Study Corridor.............................................................................13
Exhibit 2.5: Select Link Analysis for Trips Using Yonge Street (Green Lane-Mulock) .....................14
Exhibit 2.6: Select Link Analysis for Trips Using Davis Drive (Yonge Street to Leslie Street) .........15
Exhibit 2.7: Profile of Typical Weekday Traffic Volumes on Yonge Street and Davis Drive.............16
Exhibit 2.8: Existing Weekday Peak Directional Volume to Capacity Ratios....................................17
Exhibit 2.9- Existing Saturday Peak Hour Volume to Capacity Ratios on Yonge Street ..................18
Exhibit 2.10: Existing Intersection Operations ..................................................................................21
Exhibit 2.11: Existing (2008) Viva Blue Southbound AM Peak Hour Ridership Patterns .................24
Exhibit 2.12: Average Speed for Existing VIVA Blue Service ...........................................................25
Exhibit 3.1: Population Projections by Municipality * ........................................................................27
Exhibit 3.2: Employment Projections by Municipality * .....................................................................27
Exhibit 3.3: 2031 Population Forecasts by Traffic Zone (Current Forecasts)...................................28
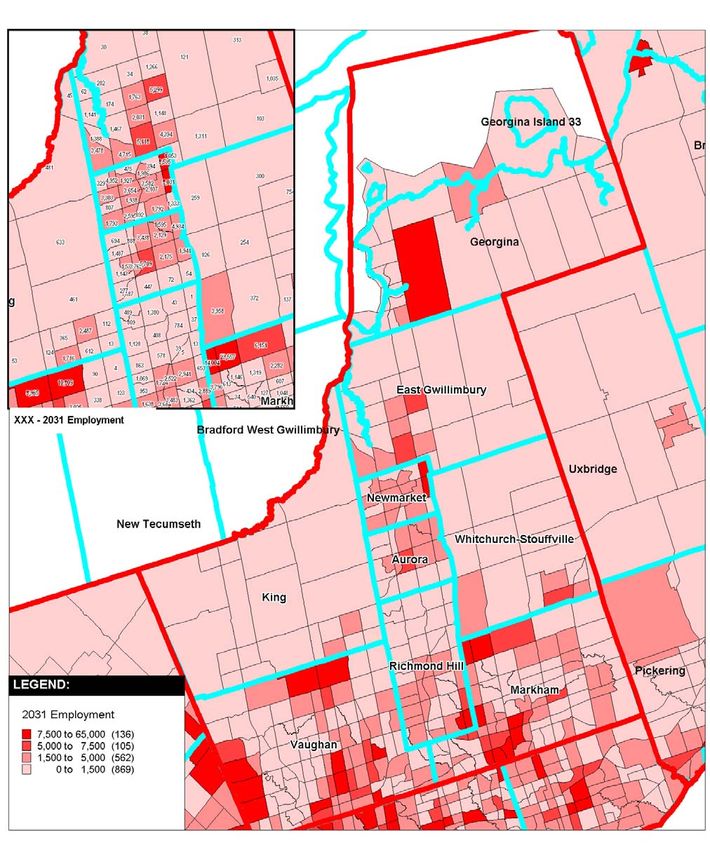
Exhibit 3.4: 2031 Employment Forecasts by Traffic Zone (Current Forecasts)................................29
Exhibit 3.5: Population Growth (2001 – 2031) ..................................................................................30
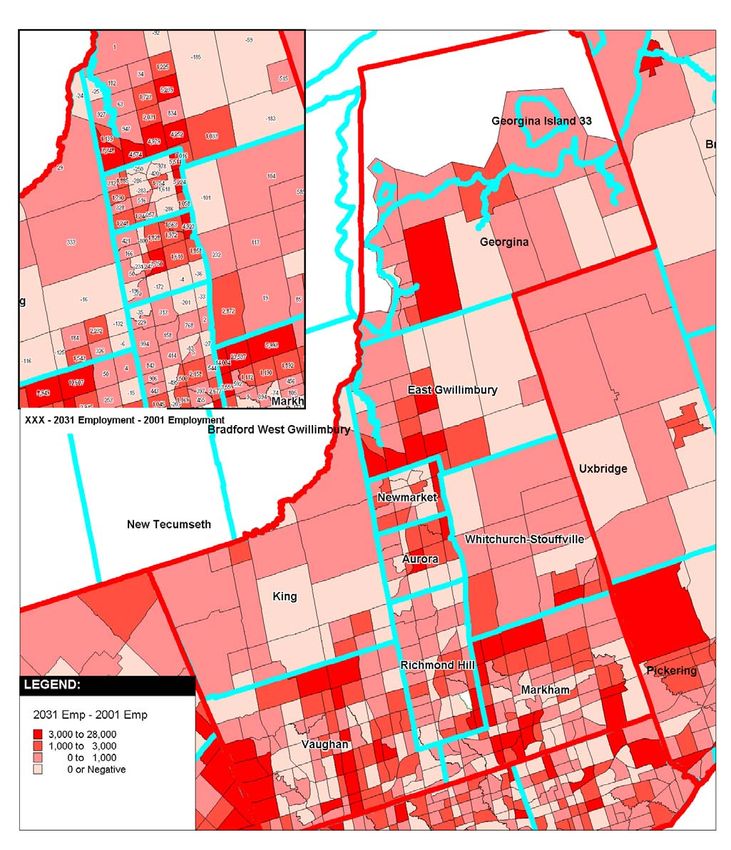
Exhibit 3.6: Employment Growth (2001 – 2031) ...............................................................................31
Exhibit 3.7: York Region 2008 - 10 Year Roads Construction Program...........................................33
Exhibit 4.1: Travel Time Input Assumptions......................................................................................38
Exhibit 4.2: Estimated Travel Time by Route Alternative..................................................................39
Exhibit 4.3: AM Peak Hour Southbound Transit Volumes in 2031 ...................................................40
Exhibit 4.4: AM Peak Period Two-way Transit Boardings in 2031....................................................41
Exhibit 4.5: Residents within 500 m of Rapid Transit Stations .........................................................42
Exhibit 4.6: Jobs within 500 m of Rapid Transit Stations..................................................................43
Exhibit 4.7: Intersection Capacity Analysis of Design Alternatives (PM Peak Hour) for Mulock
Drive to Davis Drive......................................................................................................44
Exhibit 4.8: Intersection Capacity Analysis of Design Alternatives (PM Peak Hour) ........................46
Exhibit 4.9: Existing Land Uses – Yonge Street between Aurora Heights and Savage ...................49
Exhibit 4.10 Projected Future Volumes and Capacity - Yonge Street between Aurora Heights
and Savage...................................................................................................................50
Exhibit 4.12: Summary of Total Transit + Auto Capacity for Davis Drive Alternatives .....................53
Exhibit 4.13: Orientation of Trips to Upper Canada Mall Area..........................................................55
Exhibit 4.14: Projected Volume for Davis Drive Stations ..................................................................56
Exhibit 4.14: Ridership Impacts for Alternative Davis Drive Station locations ..................................57
Exhibit 5.2: Comparison of 2021 Auto Volume Forecasts for Yonge Street – AM Peak Hour .........62
Exhibit 5.3: Comparison of 2021 Auto Volume Forecasts for Yonge Street – PM Peak Hour .........63
Exhibit 5.4: Comparison of 2021 Auto Volume Forecasts for Yonge Street – Saturday Peak
Hour ..............................................................................................................................64
Exhibit 5.5: Comparison of 2021 Auto Volume Forecasts for Davis Drive– AM Peak Hour.............65
Exhibit 5.6: Assessment of Transportation Service Effects and Mitigation Measures for the
Preferred Design ..........................................................................................................67
August 2008 Page iii.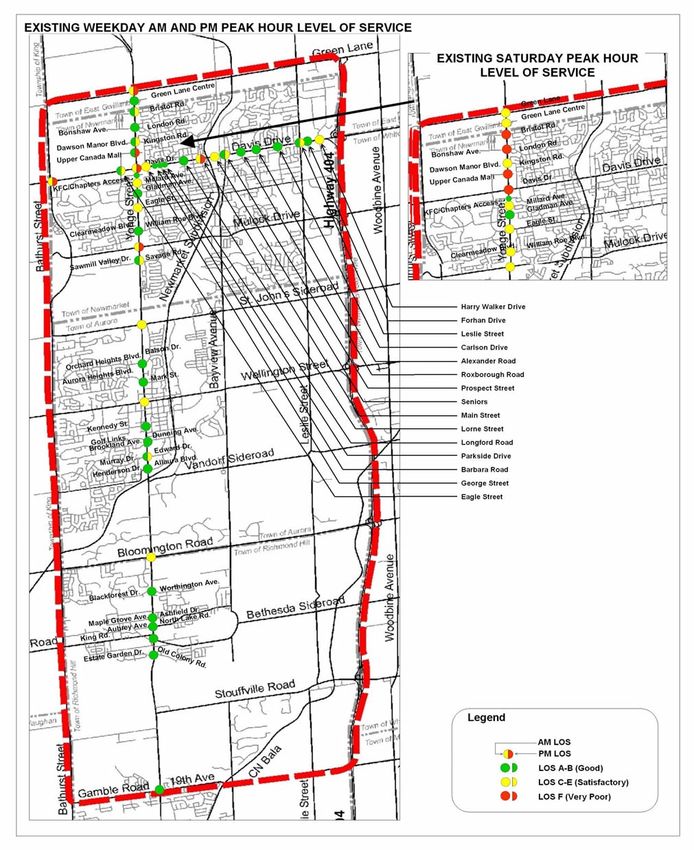
IBI GROUP TRANSPORTATION ASSESSMENT

                                                                             York Region Rapid Transit Corporation
      NORTH YONGE STREET CORRIDOR PUBLIC TRANSIT AND ASSOCIATED ROAD IMPROVEMENTS TRANSIT CLASS ENVIRONMENTAL
                                                                                                   ASSESSMENT

              1.    INTRODUCTION
              On August 8, 2005, the Regional Municipality of York (Region), the Proponent of the York Region
              Rapid Transit Plan (YRTP), obtained approval of the Terms of Reference (ToR) for an
              Environmental Assessment (EA) of the proposed Public Transit and associated road improvements
              in the North Yonge Street Corridor, the primary north-south corridor of the Plan. In accordance with
              Clause 6.2 of the Ontario Environmental Assessment Act, the Region initiated the EA to fulfil its
              obligations under Clause 3 of the Act.

              The purpose of this report is to describe the transportation analyses undertaken to support the
              development of the preferred transportation solution for the corridor, and to document the effects of
              the preferred design. This report was developed through an iterative process where various
              roadway and transit alternatives were examined in conjunction with other components of the overall
              Environmental Assessment.

              This Transportation Assessment Report is intended to be read in conjunction with the
              comprehensive Environmental Study Report, which contains a fuller description of the preferred
              transportation solution and the assessment of alternatives.

              1.1 Study Area and Rapid Transit Corridor
              As shown on Exhibit 1-1 the study area for the North Yonge Corridor is generally centred along the
              Yonge Street Corridor and bounded by Bathurst Street to the west, and Highway 404 to the east.
              The southern limit of the study area is 19th Avenue/Gamble Road across the Town of Richmond Hill
              while the northern limit is Green Lane in the Town of East Gwillimbury. For the purpose of this
              Transportation Assessment, the Study Area includes all road sections, intersections and adjacent
              neighbourhood roadway networks that may be directly impacted by any transit system or road
              network changes within the North Yonge Street corridor.

              As discussed in more detail in Section 5.1, the preferred rapid transit routing is continuous along
              Yonge Street to Newmarket, at which point the service splits into two branches, one following Davis
              Drive and the other continuing along Yonge Street to Green Lane and then eastward to the East
              Gwillimbury GO station. A discussion of the selection of this preferred routing, and the evaluation of
              alternatives, is provided in Section 4.1. Exhibit 1-2 illustrates the alternative routes investigated as
              part of this EA.

              1.2 Approach
              The transportation assessment process for the North Yonge Street Corridor EA was developed to
              be consistent with the processes utilized for the other York Region Rapid Transit transportation
              assessments conducted for South Yonge, Highway 7 and the Markham North-South Link. This
              process recognizes that:

              •     The Rapid Transit System will have immediate physical and operational effects on the
                    Yonge Street/Davis Drive/Green Lane corridors due to major changes in roadway
                    cross-sections, access provisions and intersection operations; and

              •     The preferred alternative will need to account, as best as possible, the aggressive
                    development aspirations throughout the study area, which will place additional
                    demands along the subject route and intersecting arterial roadway facilities.

August 2008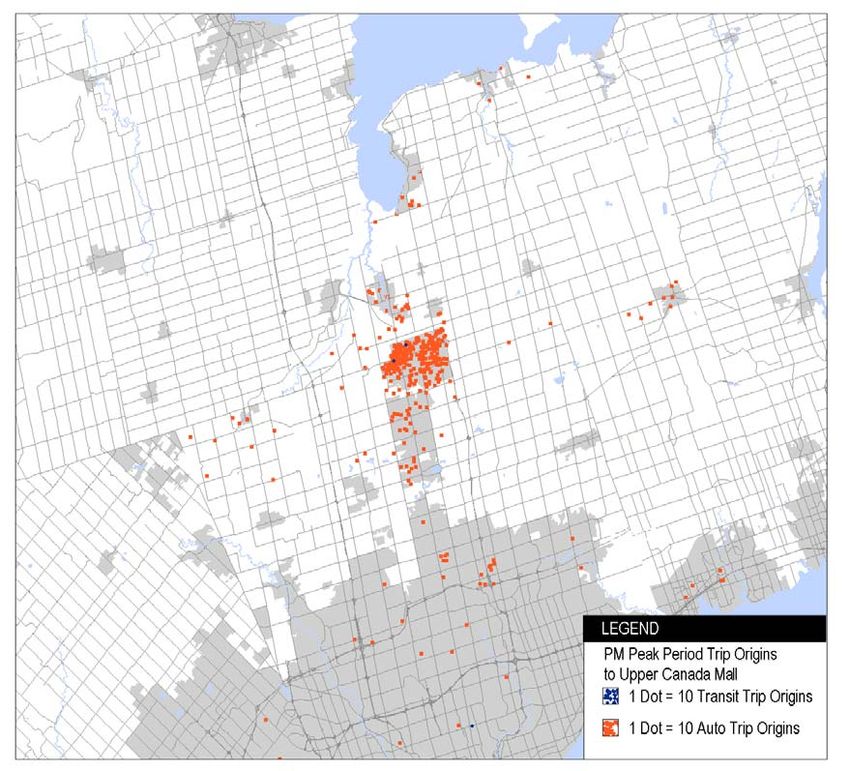
IBI GROUP TRANSPORTATION ASSESSMENT

                                                                            York Region Rapid Transit Corporation
      NORTH YONGE STREET CORRIDOR PUBLIC TRANSIT AND ASSOCIATED ROAD IMPROVEMENTS TRANSIT CLASS ENVIRONMENTAL
                                                                                                   ASSESSMENT

              Our approach has been structured to best identify the effects of the preferred alternative on
              roadway capacity and transit service operations, while recognizing that in some locations (i.e.
              Newmarket Centre), the future land use and transportation conditions will be significantly different
              than the current situation. Accordingly, any transportation performance measures presented
              in this report should be considered to be approximate, and for the purposes of relative
              comparisons only.

              Exhibit 1.1: Primary Study Area and Recommended Route

August 2008                                                                                                   Page 2
IBI GROUP TRANSPORTATION ASSESSMENT

                                                                       York Region Rapid Transit Corporation
      NORTH YONGE STREET CORRIDOR PUBLIC TRANSIT AND ASSOCIATED ROAD IMPROVEMENTS TRANSIT CLASS ENVIRONMENTAL
                                                                                                   ASSESSMENT

                                 Exhibit 1.2: Short-listed Transit Routing Alternatives

                            Short-listed Routes – Newmarket/East Gwillimbury

         Short-listed Routes – Richmond Hill                       Short-listed Routes – Aurora

August 2008                                                                                             Page 3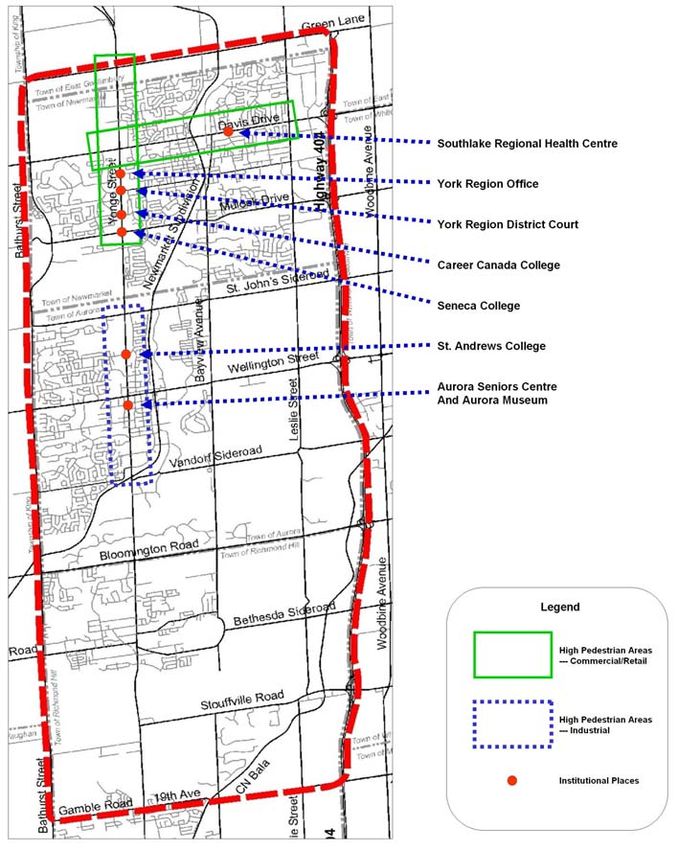
IBI GROUP TRANSPORTATION ASSESSMENT

                                                                                             York Region Rapid Transit Corporation
      NORTH YONGE STREET CORRIDOR PUBLIC TRANSIT AND ASSOCIATED ROAD IMPROVEMENTS TRANSIT CLASS ENVIRONMENTAL
                                                                                                   ASSESSMENT

              1.3 Relationship to Other Studies
              1 . 3 . 1 D A V I S D R I V E C L A S S EA - Y O N G E S T R EE T T O H I G H W A Y 4 0 4

              In parallel with the North Yonge Street Corridor Public Transit and Associated Road Improvements
              EA, a separate EA was initiated for Davis Drive between Yonge Street and Highway 404. The
              purpose of this EA was to identify the need for operation and safety improvements within the
              corridor. As part of this EA, National Capital Engineering (NCE) prepared a comprehensive Traffic
              Operations Review to assess the need for transportation improvements within the Davis Drive
              corridor. The scope of this review was primarily related to minor road improvements that could be
              made within the existing Right-of-Way in the near term.

              Since the initiation of the Davis Drive EA, the two EAs have been proceeding in parallel. Ultimately,
              one preferred undertaking will be presented to the public, though suggested roadway improvements
              identified in the NCE report may be implemented as short term improvements.

              While every effort has been made to coordinate assumptions between the Davis Drive Class
              EA and the North Yonge EA, it is noted that there may be differences in the transportation
              analysis and results presented in each report due to the differences in the focus of each
              study. Specifically, the North Yonge EA has focused on the longer term solution involving
              public transit improvements.

              1 . 3 . 2 S O U T H Y O N G E S T R E E T C O R R I D O R PU B L I C T R A N S I T I M P R O V EM E N T S R E PO R T

              In 2007, The Regional Municipality of York completed the Yonge Street Corridor Public Transit
              Improvements Environmental Assessment (EA) which addresses public transit improvements in the
              south Yonge Street Corridor extending from Steeles Avenue to 19th Avenue. The preferred
              alternative consists of a 12.5 km two-lane, median rapidway in the Yonge Street Corridor between
              Steeles Avenue and 19th Avenue approved for both BRT and LRT vehicle technologies. A one
              kilometre section of transit operation in mixed traffic is proposed for the Richmond Hill Central
              Business District.

              The North Yonge Street Corridor EA assumes that rapid transit will operate in a seamless fashion in
              the Yonge Street corridor between the City of Toronto and Newmarket.

              1.4 Organization of Report
              Following this introduction, this report is organized into six chapters as follows:

              •       Chapter 2 provides an assessment of existing transportation conditions including traffic
                      operations, transit service operations and pedestrian and cycling conditions.

              •       Chapter 3 provides an assessment of the future Base Case transportation operations
                      corresponding to the scenario involving current travel behaviour and committed
                      transportation improvements. Chapter 3 also documents land use assumptions for the
                      base case.

              •       Chapter 4 summarizes the analysis of rapid transit alternatives including alternative
                      routing options and physical infrastructure alternatives.

August 2008                                                                                                                          Page 4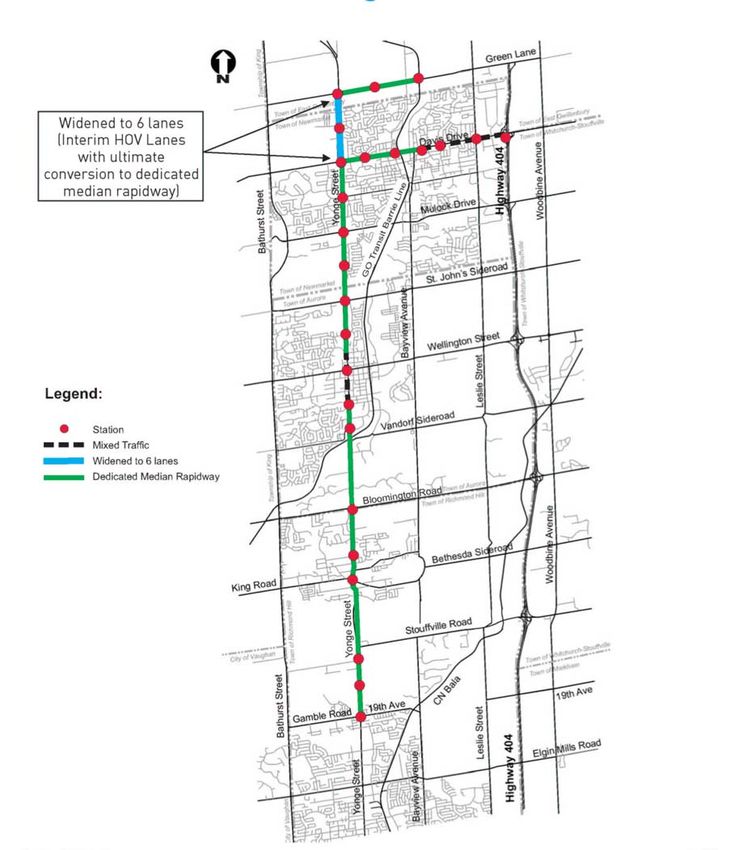
IBI GROUP TRANSPORTATION ASSESSMENT

                                                                          York Region Rapid Transit Corporation
      NORTH YONGE STREET CORRIDOR PUBLIC TRANSIT AND ASSOCIATED ROAD IMPROVEMENTS TRANSIT CLASS ENVIRONMENTAL
                                                                                                   ASSESSMENT

              •    Chapter 5 presents the results of the transportation assessment for the preferred
                   design, and its effects. This chapter also outlines various mitigation options to address
                   residual transportation effects.

August 2008                                                                                                    Page 5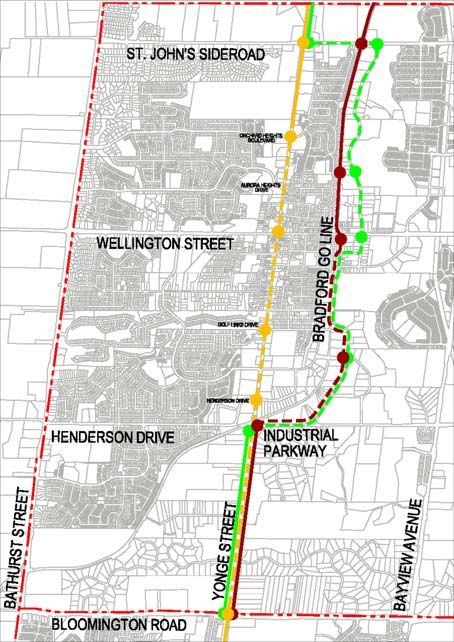
IBI GROUP TRANSPORTATION ASSESSMENT

                                                                            York Region Rapid Transit Corporation
      NORTH YONGE STREET CORRIDOR PUBLIC TRANSIT AND ASSOCIATED ROAD IMPROVEMENTS TRANSIT CLASS ENVIRONMENTAL
                                                                                                   ASSESSMENT

              2.      EXISTING CONDITIONS

              2.1 Transportation Network
              2 . 1 . 1 R O A D N E T WO R K

              Within the North Yonge Street Corridor study area, Yonge Street is an arterial roadway operated
              under the jurisdiction of the Regional Municipality of York. Throughout the majority of the Study
              Area, Yonge Street consists of four general purpose lanes with a centre left turn lane. In the area
              between Aurora Heights Drive and Gold Links Drive in the Town of Aurora, Yonge Street is
              narrower and does not have a centre left turn lane. Yonge Street has a posted speed limit of 60
              km/hr in most areas, with the exception of the downtown areas of Richmond Hill and Aurora.

              Davis Drive (formerly known as Highway 9) is an east/west arterial roadway under the jurisdiction of
              York Region. The section of Davis Drive under review lies entirely within the Town of Newmarket
              and extends from Eagle Street to west of Highway 404, a distance of approximately 5.1 km. Davis
              Drive generally consists of four lanes, with left turn lanes provided at some major intersections.
              Davis Drive has a posted speed of 50 km/hr.

              Green Lane is a four lane arterial roadway in the Town of East Gwillimbury, operated under the
              jurisdiction of the York Region. Green lane currently functions as a major by-pass route connecting
              Highway 404 and Yonge Street.

              Arterial and major collector east-west roadways on Yonge Street and within the study area include
              from north to south:

              •    Green Lane;                                   •    Wellington Street;
              •    Green Lane Centre;                            •     Kennedy Street;
              •    Aspenwood Drive/ Bristol Road;                •    St. John’s Sideroad;
              •    Bonshaw Avenue/ London Road;                  •    Batson Drive/ Orchard Heights Boulevard;
              •    Dawson Manor Boulevard/ Kingston Road;        •    Golf Links Drive/ Dunning Avenue;
              •    Upper Canada Mall Driveway;                   •    Brookland Avenue;
              •    Davis Drive;                                  •    Henderson Drive/ Allaura Boulevard;
              •    Chapters Access/ KFC Access;                  •    Industrial Parkway South;
              •    Millard Avenue;                               •    Bloomington Road;
              •    Administration Centre Access/ Gladman         •    Blackforest Drive/ Worthington Avenue;
                   Avenue;                                       •    Maple Grove Avenue/ Ashfield Drive;
              •    Eagle Street;                                 •    Aubrey Avenue/ North Lake Road;
              •    Cleanmeadow Boulevard/ William Roe            •    King Road;
                   Boulevard;                                    •    Estate Garden Drive/ Old Colony Road;
              •    Mulock Drive;                                 •    Stouffville Road;
              •    Sawmill Valley Drive/ Savage Road;            •    Jefferson Sideroad;
              •    Joe Persechini Drive/ Savage Road;            •
                                                                                        th
                                                                      Gamble Road/19 Avenue
              •    Aurora Heights Drive/ Mark Street;

              Arterial and major collector north-south roadways on Davis Drive and within the study area include
              from west to east:

              •    Eagle Street;                                 •    Main Street;
              •    Yonge Street;                                 •    Charles Street;

August 2008                                                                                                   Page 6
IBI GROUP TRANSPORTATION ASSESSMENT
York Region Rapid Transit Corporation
NORTH YONGE STREET CORRIDOR PUBLIC TRANSIT AND ASSOCIATED ROAD IMPROVEMENTS TRANSIT CLASS ENVIRONMENTAL
ASSESSMENT
• George Street; • Prospect Street;
• Wilstead Drive; • Patterson Street/Roxborough Road;
• Barbara Road; • Huron Heights Drive/Alexander Road;
• Parkside Drive; • Ashton Road/Carlson Drive;
• Longford Road; • Leslie Street;
• Lorne Street; • Forhan Drive;
• Vincent Street/Niagara Street; • Harry Walker Drive
2.1.2 TRANSIT NETWORK
York Region Transit (YRT) provides a network of local bus service through a large portion of the
study area. Exhibit 2.1 provides a map of the YRT local routes serving the study area. Key routes
operating within the study area are as follows:
• YRT Route 22 - operates from the Maple Community Centre to the Seneca King
Campus. As part of this route, the buses travel on Yonge Street from south of King
Road (Bond Crescent) to Bloomington Road.
• YRT Route 44 - operates from the Newmarket Terminal to the Newmarket GO Station.
As part of this route, the buses with full service travel on Yonge Street from Upper
Canada Mall Driveway to Bristol Road. During weekday AM peak hour, the buses
travel on Yonge Street from Davis Drive to Bristol Road.
• YRT Route 52 - operates from the Newmarket Terminal to the intersection of Yonge
Street and Queensville Sideroad. As part of this route, the buses with full service
travel on Yonge Street from Upper Canada Mall Driveway to Green Lane. During the
weekday AM peak hour, the buses travel on Yonge Street from Davis Drive to Green
Lane.
• YRT Route 98 - operates between the Upper Yonge Place to the intersection of Yonge
Street and Green Lane. As part of this route, the buses travel on Yonge Street from
Gamble Road to Green Lane.
• YRT Route 520 – serves as a community transit route in the Town of Newmarket. The
buses start and end at the Upper Canada Mall on every run. As part of this route, the
buses travel on Yonge Street from Davis Drive to South of Green Lane.
• YRT Route 521 - serves as a community transit route in the Town of Newmarket. The
buses start and end at the Upper Canada Mall on every run. As part of this route, the
buses travel on Yonge Street from Davis Drive to South of Green Lane.
• YRT Route 55 - operates from Newmarket GO Bus Terminal to 404 Town Centre. As
part of this route, the buses will full service travel on Davis Drive from Eagle Street to
Leslie Street.
In addition to these YRT services, York Region has been operating Rapid Transit services along
Yonge Street since 2005. The Viva Blue route travels along Yonge Street from Finch Station in the
City of Toronto northward to the Newmarket Terminal at Eagle Street and Davis Drive. Along
Yonge Street, there are ten stops within the study area. The headway of the Viva Blue route within
the study area is 10 minutes during the weekday a.m. and p.m. peak periods and 15 minutes in the
off-peak periods.
August 2008 Page 7IBI GROUP TRANSPORTATION ASSESSMENT
York Region Rapid Transit Corporation
NORTH YONGE STREET CORRIDOR PUBLIC TRANSIT AND ASSOCIATED ROAD IMPROVEMENTS TRANSIT CLASS ENVIRONMENTAL
ASSESSMENT
Exhibit 2.1: Existing Transit Network
August 2008 Page 8IBI GROUP TRANSPORTATION ASSESSMENT
York Region Rapid Transit Corporation
NORTH YONGE STREET CORRIDOR PUBLIC TRANSIT AND ASSOCIATED ROAD IMPROVEMENTS TRANSIT CLASS ENVIRONMENTAL
ASSESSMENT
In addition to YRT/VIVA bus services, GO Transit operates the Newmarket ‘B’, Newmarket ‘B’
Express, and Newmarket-York University bus routes along Yonge Street within the study area. The
frequency of the Newmarket ‘B’ bus service has been reduced significantly with the introduction of
the Viva service in the Fall of 2005.
All existing bus routes operate in mixed traffic on Yonge Street within the study area. Currently,
there are no Toronto Transit Commission routes operating on Yonge Street within the study area.
An express bus service on Highway 404 introduced by GO Transit was discontinued in 2006.
2.1.3 GO TRANSIT TERMINALS
There are three GO Transit Terminals in proximity to Yonge Street and Davis Drive within the study
area:
• Newmarket GO Bus Terminal - Located on Davis Drive, west of Yonge Street in
Newmarket. This terminal serves the GO bus services on Bradford Line throughout
the day. This is a shared terminal with the York Region Transit.
• Newmarket GO Train Terminal - Located on Main Street, which is north of Davis Street
and east of Yonge Street. This terminal serves the train services on Barrie Line
(formerly Bradford GO Line). Go Trains operates on 30 minute headways during the
weekday AM and PM peak periods. There is no off-peak train service to this station
but GO Bus Service to the station throughout the day.
• Aurora GO Train Terminal - Located on Wellington Street, which is east of the
intersection of Yonge Street and Wellington Street in Aurora. This terminal serves the
train services on Barrie Line. Go Trains operates on 30 minute headways during the
weekday AM and PM peak periods. There is no off-peak train service to this station.
There is GO Bus Service to the terminal throughout the day.
• East Gwillimbury GO Rail Station on Green Lane – Located on Green Lane at Main
Street. This terminal also serves the train services on Barrie Line. Go Trains operates
on 30 minute headways during the weekday AM and PM peak periods. There is no
off-peak train service to this station. There is GO Bus Service to the terminal
throughout the day.
2.1.4 PARK AND RIDE LOTS
The park and ride lots within the subject sections of Yonge Street and Davis Drive are located
sporadically throughout the study area. All of the lots offer free parking to transit patrons. The
following park and ride lots and their location are summarized as follows:
• Aurora Community Centre - Aurora Heights Dr., one block north of Wellington Street
• Aurora GO Station – Located at Wellington Street and Yonge Street, provides 570
parking spaces;
• Newmarket GO Bus Terminal – Located at Davis Drive and Main Street at the Tannery
Mall, with 331 parking spaces;
August 2008 Page 9IBI GROUP TRANSPORTATION ASSESSMENT
York Region Rapid Transit Corporation
NORTH YONGE STREET CORRIDOR PUBLIC TRANSIT AND ASSOCIATED ROAD IMPROVEMENTS TRANSIT CLASS ENVIRONMENTAL
ASSESSMENT
• Newmarket GO Station – Located at Davis Drive and Main Street, accommodates 265
parking spaces;
• Newmarket GO Agency – Located at Davis Drive and Eagle Street, with 331 parking
spaces, and
• East Gwillimbury GO Station – Located at Green Lane and Main Street, with 637
parking spaces.
There is also a carpool lot located on Davis Drive at Highway 404.
2.1.5 PEDESTRIAN AND CYCLING NETWORK
The functioning of the transit system is contingent on a well-developed pedestrian and cycling
network. Exhibit 2.2 illustrates the high pedestrian areas on Yonge Street and Davis Drive
according to commercial/retail, institutional and industrial land uses. Several sections of the Yonge
Street corridor (e.g. north of Bloomington Road) are not developed and therefore do not generate
pedestrian or cycling traffic. Other areas north of St. John’s Sideroad and north and south of
Stouffville Road are also currently undeveloped.
August 2008 Page 10IBI GROUP TRANSPORTATION ASSESSMENT
York Region Rapid Transit Corporation
NORTH YONGE STREET CORRIDOR PUBLIC TRANSIT AND ASSOCIATED ROAD IMPROVEMENTS TRANSIT CLASS ENVIRONMENTAL
ASSESSMENT
Exhibit 2.2 – High Pedestrian Areas
August 2008 Page 11IBI GROUP TRANSPORTATION ASSESSMENT
York Region Rapid Transit Corporation
NORTH YONGE STREET CORRIDOR PUBLIC TRANSIT AND ASSOCIATED ROAD IMPROVEMENTS TRANSIT CLASS ENVIRONMENTAL
ASSESSMENT
Sidewalk exists for a majority of the Yonge Street North corridor on one or both sides of the street.
Exhibit 2.3 summarizes where sidewalks are provided and not provided along the Yonge Street
North corridor.
Exhibit 2.3 Sidewalk Provisions
Yonge Street Sidewalk Provisions
From (north) To (south)
Green Lane Aspenwood Dr/Bristol Road Both sides
Aspenwood Dr/Bristol Road Upper Canada Mall Both sides
Upper Canada Mall South of Davis Drive Both sides
South of Davis Drive Mulock Drive Both sides
Mulock Drive Savage Road Both sides
Savage Road St. John’s Sideroad None
St. John’s Sideroad North of Orchard Heights West side
North of Orchard Heights Bloomington Road None
Bloomington Road Coon’s Road Both sides
Coon’s Road North Lake Road Both sides
North Lake Road Old Colony Road Both sides
Old Colony Road Gamble None – proposed new
pedestrian route
Davis Drive Sidewalk Provisions
From (west) To (east)
Eagle Street Yonge Street South side
Yonge Street George Street Both sides
George Street Barbara Road Both sides
Barbara Road Parkside Drive Both sides
Parkside Drive Longford Road Both sides
Longford Road Lindsay Avenue Both sides
Lindsay Avenue Lorne Street Both sides
Lorne Street Main Street Both sides
Main Street CNR Line Both sides
CNR Line Seniors Both sides
Seniors Prospect Street Both sides
Prospect Street Roxborough Road Both sides
Roxborough Road Alexander Road Both sides
Alexander Road Carlson Drive Both sides
Carlson Drive Leslie Street Both sides
Leslie Street Forhan Drive Both sides
Forhan Drive Harry Walker Drive Both sides
The Region of York has recently completed a pedestrian and cycling master plan study in which
Yonge Street had been identified as a candidate cycling route within the road right-of-way. The
proposed new pedestrian routes shown in the above exhibit are also indicated in the study. The
August 2008 Page 12IBI GROUP TRANSPORTATION ASSESSMENT
York Region Rapid Transit Corporation
NORTH YONGE STREET CORRIDOR PUBLIC TRANSIT AND ASSOCIATED ROAD IMPROVEMENTS TRANSIT CLASS ENVIRONMENTAL
ASSESSMENT
following candidate cycling routes, existing and previously proposed cycling routes are illustrated in
Exhibit 2.4 have been identified for the various municipalities.
Exhibit 2.4- Cycling Routes in the Study Corridor
Municipality Candidate Cycling Routes Existing and Previously Proposed
Cycling Routes
Town of East Gwillimbury Green Lane (east of Yonge St)
Town of Newmarket Davis Drive Bonshaw Avenue/London Road
Mulock Drive Milliard Avenue
Ontario Hydro Corridor Mulock Drive
(north of Mulock Drive) Savage Road
Town of Aurora Wellington Street Orchard Heights Blvd/Batson Drive
Aurora Heights Drive/Mark St
Kennedy Street
Dunning Avenue/Golf Links Road
Edward Street
Allaura Boulevard/Henderson Dr
Industrial Parkway (Trail)
Hunters Glen Road/Elderberry Trail
Town of Richmond Hill Bloomington Road Coon’s Road
King Road Blackforest/Worthington
Sunset Beach Road Maple Grove Ave/Ashfield Drive
Stouffville Road North lake Road/Aubrey Avenue
Gamble Road Estate Garden/Old Colony Road
Tower Hill Road
2.2 Traffic Volumes and Travel Patterns
This section presents an assessment of the existing conditions for the primary corridors in the study
area consisting of Yonge Street and Davis Drive. It is noted that some of the preliminary routing
options included roads such as Industrial Parkway and Main Street and Eagle Street. While the
intersections of these routes with the primary corridors were assessed, traffic conditions on these
alternative routes were evaluated in less detail. Generally, traffic volumes are lighter on these
alternative routes.
2.2.1 EXISTING TRAFFIC PATTERNS
Exhibits 2.5 and 2.6 illustrate the general orientation of traffic using Yonge Street (between Mulock
Drive and Green Lane) and Davis Drive, the two sections where several alternatives for future rapid
transit were analysed. For the northern portion of Yonge Street, a large portion of the traffic is local
in nature, due to the high concentration of employment in this area. Similarly, much of the traffic on
Davis Drive is contained within the Bathurst to Leslie Street segments, though there are significant
volumes of trips on Davis Drive that have origins or destinations in the west and south. Both Yonge
Street and Davis Drive could be considered to have a “regional” transportation function.
August 2008 Page 13IBI GROUP TRANSPORTATION ASSESSMENT
York Region Rapid Transit Corporation
NORTH YONGE STREET CORRIDOR PUBLIC TRANSIT AND ASSOCIATED ROAD IMPROVEMENTS TRANSIT CLASS ENVIRONMENTAL
ASSESSMENT
Exhibit 2.5: Select Link Analysis for Trips Using Yonge Street (Green Lane-Mulock)
Note: Based on assignment of AM Peak Period auto volumes using EMME/2 Model
August 2008 Page 14IBI GROUP TRANSPORTATION ASSESSMENT
York Region Rapid Transit Corporation
NORTH YONGE STREET CORRIDOR PUBLIC TRANSIT AND ASSOCIATED ROAD IMPROVEMENTS TRANSIT CLASS ENVIRONMENTAL
ASSESSMENT
Exhibit 2.6: Select Link Analysis for Trips Using Davis Drive (Yonge Street to Leslie Street)
Note: Based on assignment of AM Peak Period auto volumes using EMME/2 Model
2.2.2 EXISTING TRAFFIC VOLUMES AND RELATIONSHIP TO CAPACITY
Traffic volumes and corresponding operations were examined for three primary time periods,
Weekday AM Peak Hour, Weekday PM Peak Hour and a Saturday Peak Hour. In some locations
(e.g. Yonge Street in Newmarket), the Saturday peak hour volumes are higher than weekday
volumes and were therefore included in the analysis. For the majority of the corridor, however, the
PM peak period represents the worst case conditions, as shown on Exhibit 2.7. There are a few
movements where the mid-day weekday volumes are higher than the peak hour volumes (e.g.
Yonge Street southbound, south of Davis Drive), but in most cases the total intersection volumes
are highest in the peak hours.
August 2008 Page 15IBI GROUP TRANSPORTATION ASSESSMENT
York Region Rapid Transit Corporation
NORTH YONGE STREET CORRIDOR PUBLIC TRANSIT AND ASSOCIATED ROAD IMPROVEMENTS TRANSIT CLASS ENVIRONMENTAL
ASSESSMENT
Exhibit 2.7: Profile of Typical Weekday Traffic Volumes on Yonge Street and Davis Drive
3000
2500
Two-way Volume (Typical Weekday)
2000
1500
1000
500
0
1 2 3 4 5 6 7 8 9 10 11 12 13 14 15 16 17 18 19 20 21 22 23 24
Hour Ending
Yonge Street at St. Johns Sideroad Davis Drive East of Main Street
Exhibit 2.8 summarizes the existing weekday peak directional traffic volumes along with an
indication of the theoretical volume to capacity ratio (based on nominal road capacities). These
volumes represent existing conditions based on traffic counts taken mostly between 2004 and
2006, though counts for some intersections in low growth areas are based on counts taken in 2003.
Appendix A provides an index of when counts for each intersection/segment were taken.
August 2008 Page 16IBI GROUP TRANSPORTATION ASSESSMENT
York Region Rapid Transit Corporation
NORTH YONGE STREET CORRIDOR PUBLIC TRANSIT AND ASSOCIATED ROAD IMPROVEMENTS TRANSIT CLASS ENVIRONMENTAL
ASSESSMENT
Exhibit 2.8: Existing Weekday Peak Directional Volume to Capacity Ratios
Northbound (PM) Southbound (AM)
Yonge Street Hourly Capacity v/c Ratio Hourly Capacity v/c Ratio
Volume Volume
North of Green Lane 2,324 1,800 1.29 2,041 1,800 1.13
South of Green Lane 1,558 1,800 0.87 1,299 1,800 0.72
North of 1,987 1,800 1.10 1,415 1,800 0.79
Bristol/Aspenwood
North of Bonshaw/London 1,970 1,800 1.09 1,425 1,800 0.79
North of Dawson 1,853 1,800 1.02 1,555 1,800 0.86
Manor/Kingston
North of Upper Canada 1,680 1,800 1.02 1,446 1,800 0.80
North of Davis Drive 1,540 1,800 0.91 1,355 1,800 0.75
North of Millard Ave 1,530 1,800 0.94 1,274 1,800 0.71
North of Eagle Street 1,777 1,800 0.96 1,127 1,800 0.63
North of Mulock Drive 2,014 1,800 1.12 1,471 1,800 0.82
North of St. John’s 1,472 1,800 0.82 1,275 1,800 0.71
Sideroad
North of Wellington Street 874 1,800 0.49 918 1,800 0.51
North of Industrial 1,193 1,800 0.66 1,135 1,800 0.63
Parkway
North of Bloomington Rd 1,172 1,800 0.65 1,262 1,800 0.70
North of North Lake Road 1,258 1,800 0.70 1,266 1,800 0.70
North of Stouffville Road 1,348 1,800 0.75 1,472 1,800 0.82
South of Jefferson 1,029 1,800 0.57 1,229 1,800 0.68
Sideroad
North of Gamble Road 1,116 1,800 0.62 1150 1,800 0.64
Eastbound (PM) Westbound (PM)
Davis Drive Hourly Capacity v/c Ratio Hourly Capacity v/c Ratio
Volume Volume
West of Eagle Street W 1,108 1,600 0.69 1,318 1,600 0.82
West of Yonge Street 1,072 1,600 0.67 1,045 1,600 0.65
East of Yonge Street 768 1,600 0.48 1,283 1,600 0.80
West of Prospect Street 1,127 1,600 0.70 1,299 1,600 0.81
West of Leslie 1,074 1,600 0.67 1,115 1,600 0.70
East of Leslie 1,323 1,600 0.83 1,040 1,600 0.65
Note: Capacity of one lane is assumed as 900 vehicles per hour per lane for Yonge Street
Capacity of one lane is assumed as 800 vehicles per hour per lane for Davis Drive
August 2008 Page 17IBI GROUP TRANSPORTATION ASSESSMENT
York Region Rapid Transit Corporation
NORTH YONGE STREET CORRIDOR PUBLIC TRANSIT AND ASSOCIATED ROAD IMPROVEMENTS TRANSIT CLASS ENVIRONMENTAL
ASSESSMENT
From the above table, the following weekday peak direction operating conditions are noted:
• It is evident that Yonge Street operates at capacity and in some cases beyond the
existing capacity vehicles per hour per lane mainly during the PM peak hour in the
northbound direction between Dawson Manor and Green Lane;
• North of Green Lane, Yonge Street operates above capacity in both peak directions at
hourly traffic volumes exceeding 2,000 vehicles;
• Volumes to capacity ratios (v/c ratios) of 0.85 and higher are evident during the PM
peak northbound direction from Mulock Drive northwards. South of Mulock Drive the
traffic volume decreases significantly during the PM peak hour to volumes less than
1,600 vehicles; and
• In the southbound direction during the AM peak hour, Yonge Street south of Green
Lane operates below capacity at v/c ratios averaging 0.72.
• In the eastbound and westbound directions during the PM peak hour, Davis Drive
within the study area operates below capacity at v/c ratios averaging 0.63.
The Saturday peak hour volume to capacity ratios are summarized in Exhibit 2.9 similar to the
above exhibit.
Exhibit 2.9- Existing Saturday Peak Hour Volume to Capacity Ratios on Yonge Street
Northbound Southbound
Location
Volume Capacity v/c Ratio Volume Capacity v/c Ratio
North of Green Lane 1,570 1,800 0.87 1,654 1,800 0.92
South of Green Lane 1,571 1,800 0.87 1,335 1,800 0.74
North of 2,377 1,800 1.32 1,946 1,800 1.08
Bristol/Aspenwood
North of Bonshaw/London 2,308 1,800 1.28 2,014 1,800 1.12
North of Dawson 2,024 1,800 1.12 2,057 1,800 1.14
Manor/Kingston
North of Upper Canada 2,299 1,800 1.28 2,091 1,800 1.16
North of Davis Drive 1,521 1,800 0.84 1,621 1,800 0.90
North of Millard Drive 1,529 1,800 0.85 1,541 1,800 0.86
North of Eagle Street 1,413 1,800 0.78 1,342 1,800 0.75
North of Mulock Drive 1,494 1,800 0.83 1,539 1,800 0.83
Note: Capacity of one lane is assumed as 900 vehicles per hour per lane
Operating conditions between Millard Drive and Green Lane show capacity constraints between
Upper Canada and Bristol Road/Aspenwood Drive in both the northbound and southbound
August 2008 Page 18IBI GROUP TRANSPORTATION ASSESSMENT
York Region Rapid Transit Corporation
NORTH YONGE STREET CORRIDOR PUBLIC TRANSIT AND ASSOCIATED ROAD IMPROVEMENTS TRANSIT CLASS ENVIRONMENTAL
ASSESSMENT
directions. This is a direct result of the high traffic volumes generated by Upper Canada Mall and
other shopping centres along Yonge Street.
2.3 Existing Intersection Operations
Intersection capacity analysis was undertaken using the Highway Capacity Manual (HCM)
methodology and in particular, the Synchro 6.0 software package. Synchro 6 can analyze both
signalized and unsignalized intersections in a road corridor or network taking into account the
spacing, interaction, queues and operations between intersections.
The signalized intersection analysis considers two separate measures of performance:
• the capacity of the intersection movements, which is based on a volume to capacity ratio; and
• the level of service which is based on the control delay per vehicle for the various movements
through the intersection and overall.
The unsignalized intersection analysis considers two separate measures of performance:
• the capacity of the critical intersection movements, which is based on a volume to capacity ratio;
and
• the level of service for the critical movements which is based on the average control delay per
vehicle for the various critical movements within the intersection.
The analysis reflects the existing base traffic counts, current signal timings, and existing lane
configurations. Exhibit 2.10 provides an illustration of the existing intersection operations in
graphical form for the AM peak hour, PM peak hour and Saturday peak (Mulock to Green Lane).
More detailed summaries of delay and level of service by intersection, and an indication of critical
movements, is provided in Appendix B. For the purpose of the detailed summaries, critical
movements are defined as turning movements approaching a v/c of 1.0 and/or Level of Service “E”
or “F” (LOS).
Based on a review of the above analysis during the AM, PM and Saturday peak hours, the following
capacity constraints/critical movements were noted:
Green Lane/Yonge Street
The intersection at Green Lane/Yonge Street operates close to capacity during the AM peak hours.
During the PM and Saturday peak hours, the intersection is operating at capacity.
During the AM peak hour, the single westbound left turn lane operates very close to capacity at a
v/c of 0.99. The dual southbound left turn movement accommodates approximately 750 vehicles
during the morning peak hour and requires a significant amount of green time from the 120 second
cycle timing plan.
During the PM peak hour, the westbound left turn and right turn movements are operating at
capacity. The westbound right turn movement operates at capacity carrying approximately 880
vehicles during the PM peak hour. The northbound through and eastbound left turn movement are
operating close to capacity. During this peak period, this intersection operates at a cycle length of
140 seconds.
During the Saturday peak hour, both the north and south through movements operate at capacity
with v/c ratios of 1.05 and 1.02, respectively. The westbound left turn lane operates above capacity
with volumes of 350 vehicles per hour. The southbound and eastbound left turn movements are
approaching capacity at v/c ratios of 0.95.
August 2008 Page 19IBI GROUP TRANSPORTATION ASSESSMENT
York Region Rapid Transit Corporation
NORTH YONGE STREET CORRIDOR PUBLIC TRANSIT AND ASSOCIATED ROAD IMPROVEMENTS TRANSIT CLASS ENVIRONMENTAL
ASSESSMENT
Green Lane Centre/Yonge Street
This intersection provides signalized access to the retail developments on both sides of Yonge
Street. During the Saturday peak hour, the northbound left turn and eastbound right turn
movements are operating over capacity.
Aspenwood Drive/Bristol Road/Yonge Street
In addition to this intersection serving the commercial areas adjacent to Yonge Street, it also
provides access to the residential areas of Woodland Hill (west) and a large residential area on the
east side.
During the PM and Saturday peak hour this intersection operates at capacity. The northbound
through lanes and the eastbound left turn lane operate at v/c ratios of more than 1.10 and 1.07,
respectively, during the PM peak hour. The 1,900 vehicles exceed the capacity of the northbound
lanes and the lack of an eastbound advance phase results in capacity constraints for the eastbound
left turn movement.
During Saturday conditions, several movements operate at capacity including the northbound left
turn, northbound through, southbound through, eastbound left turn, and westbound left turn
movements. The southbound left is approaching capacity.
August 2008 Page 20IBI GROUP TRANSPORTATION ASSESSMENT
York Region Rapid Transit Corporation
NORTH YONGE STREET CORRIDOR PUBLIC TRANSIT AND ASSOCIATED ROAD IMPROVEMENTS TRANSIT CLASS ENVIRONMENTAL
ASSESSMENT
Exhibit 2.10: Existing Intersection Operations
August 2008 Page 21IBI GROUP TRANSPORTATION ASSESSMENT
York Region Rapid Transit Corporation
NORTH YONGE STREET CORRIDOR PUBLIC TRANSIT AND ASSOCIATED ROAD IMPROVEMENTS TRANSIT CLASS ENVIRONMENTAL
ASSESSMENT
Bonshaw Avenue/Bristol Road/Yonge Street
The commercial development fronting Yonge Street on the west side of the road continues to
generate a significant amount of vehicles via Bonshaw Avenue and Aspenwood Drive.
This intersection operates at capacity during the Saturday peak hour conditions. The northbound
left turn movement which service both residential and commercial land uses, operate at capacity.
The southbound through movement is also operating at capacity. The eastbound left turn
movement is operating close to capacity at a v/c ratio of 0.99.
Dawson Manor Blvd/Kingston Road/Yonge Street
This intersection operates at capacity only during the Saturday peak hour with capacity constraints
in the northbound, southbound and westbound directions. The northbound left turn, southbound left
turn, southbound through, and westbound left turn movements are all operating at capacity. The
northbound left turn movement is approaching capacity at a v/c ratio of 0.9.
Upper Canada Mall/Yonge Street
The eastbound dual left exiting the Upper Canada Mall operates at capacity during both the PM and
Saturday peak hours. During the PM peak hour this movement carries approximately 490 vehicles
per hour and doubles to 880 vehicles per hour on a typical Saturday peak hour.
This signalized access provides the only access to/from the Upper Canada Mall on Yonge Street. A
secondary full moves signalized access is provided on Davis Drive.
Davis Drive/Yonge Street
This intersection operates at capacity during all of the peak hour conditions as a result of the heavy
north to south and east to west volumes. The left turn movements operate as protected and
permitted.
During the AM peak hour, the westbound left turn operates at capacity with a v/c ratio of 1.08 and
the eastbound left is operating close to capacity.
During the PM peak hour, the northbound through, southbound left turn, eastbound left turn, and
westbound left turn movements are operating at capacity whereas the northbound left turn,
eastbound through, and westbound through movements are operating close to capacity.
Lastly, during the Saturday peak hour, the northbound left, southbound left, southbound through,
eastbound left, and westbound left are operating at capacity. The northbound through and
westbound through are operating close to capacity.
Millard Avenue/Yonge Street
During the PM peak hour, the southbound left turn movement operates at capacity due to the heavy
opposing volumes. On a typical Saturday peak hour, the southbound through movement operates
close to capacity.
Eagle Street/Yonge Street
August 2008 Page 22IBI GROUP TRANSPORTATION ASSESSMENT
York Region Rapid Transit Corporation
NORTH YONGE STREET CORRIDOR PUBLIC TRANSIT AND ASSOCIATED ROAD IMPROVEMENTS TRANSIT CLASS ENVIRONMENTAL
ASSESSMENT
During the PM peak hour the northbound left turn movement operates at capacity. The northbound
through and westbound left turn movements operate close to capacity. During the Saturday peak
hour, the southbound through movement is close to approaching capacity.
Mulock Drive/Yonge Street
The AM and PM peak hour volumes on Mulock Drive range from 1150 to 1,300 vehicles per hour.
As a result, the westbound left turn movement operates close to capacity during the AM peak hour
and the eastbound left and westbound right turn movements operate at capacity during the PM
peak hour. In the north/south direction, the southbound left is operating close to capacity during the
AM peak hour. During the PM peak hour, the northbound through, southbound left movements are
operating at capacity and the westbound through is operating close to capacity. In addition, the
southbound left turn movement is approaching capacity during the Saturday peak hour.
Wellington Street/Yonge Street
The lane configurations on of a shared left-through lane and shared through-right lane are on all
approaches of this intersection. As a result of this and a heavy southbound left turn volume of 187
vehicles per hour, the southbound approach is operating close to capacity during the AM peak.
During the PM peak, the eastbound and northbound approaches are operating close to capacity.
Bloomington Road/Yonge Street
During the AM peak hour, the westbound through and eastbound left turn movements are operating
close to capacity.
King Road/Yonge Street
During the PM peak hour, the northbound left turn movement is operating close to capacity with a
v/c ratio of 0.91 and carrying approximately 440 vehicles per hour.
Davis Drive/Bathurst Street
The northbound left operates at capacity during the AM peak hour. During the PM peak hour, the
northbound left and eastbound left carries approximately 600 and 550 vehicles per hour per lane,
respectively. As a result these movements in addition to the westbound through movement operate
at capacity. The eastbound through and westbound left turn movements operate close to capacity.
Davis Drive/Prospect Street
During the PM peak hour, the westbound approach operates at capacity although an advanced left
turn phase is available.
Davis Drive/Leslie Street
During the PM peak hour, the southbound left turn, eastbound left turn, and westbound left turn
movements are approaching capacity.
August 2008 Page 23IBI GROUP TRANSPORTATION ASSESSMENT
York Region Rapid Transit Corporation
NORTH YONGE STREET CORRIDOR PUBLIC TRANSIT AND ASSOCIATED ROAD IMPROVEMENTS TRANSIT CLASS ENVIRONMENTAL
ASSESSMENT
2.4 Existing Transit Volumes and Performance Levels
2 . 4 . 1 E X I S T I N G T R A N S I T VO L U M E S
The Viva Blue route is a limited stop express type transit service and is primarily used by
commuters travelling south in the morning and north in the evening. As of Spring 2008, this route
carried an average of 2,000 passengers in the morning peak (3hr) period. As shown on Exhibit
2.11, ridership on this route is higher in the south part of the Region than the north part, with the
peak demand occurring between Highway 7 (where there are a large number of transfers from the
main east-west VIVA service) to the Finch subway station. Within the study area, the peak hour
southbound ridership at Wellington Street is approximately 142 passengers.
Exhibit 2.11: Existing (2008) Viva Blue Southbound AM Peak Hour Ridership Patterns
700
AM Peak Hour Boardings and Alightings
Boardings
600
Alightings
500 Load
400
300
200
100
0
Golf Links Drive
Mulock Drive
16th-Carrville
Clark Avenue
Henderson Drive
Crosby Avenue
Major MacKenzie Drive
Steeles Avenue
Royal Orchard Blvd.
Newmarket Terminal
Bloomington Road
King Road
19th-Gamble
Bernard
Finch Station
Elgin Mills Road
Richmond Hill Centre
Centre Street
Eagle Street
Bantry-Scott
Orchard Heights
Weldrick Road
Wellington Street
2 . 4 . 2 E X I S T I N G T R A N S I T P ER F O R M A N C E
Existing transit performance can be quantified by looking at transit speeds for the current VIVA
service which operates on Yonge Street. Exhibit 2.12 below plots the average AM Peak Period
speed by location along the VIVA Blue service (including dwell times at the upstream station).
Within the North Yonge study area, average speeds range from 20 km/hr to 50 km/hr. Speeds are
slowest through Aurora where Yonge Street is four lanes with no exclusive turning lanes.
August 2008 Page 24August 2008
Average Speed (km/hr)
0
10
20
30
40
50
60
Finch Station - Steeles Avenue
Steeles Avenue - Clark Avenue
Clark Avenue - Centre Street
Centre Street - Royal Orchard Blvd.
IBI GROUP TRANSPORTATION ASSESSMENT
Royal Orchard Blvd. - Richmond Hill Ctr
Northbound
Southbound
Richmond Hill Centre - Bantry-Scott
Bantry-Scott - 16th-Carrville
16th-Carrville - Weldrick Road
Weldrick Road - Major MacKenzie Drive
Major MacKenzie Drive - Crosby Avenue
Crosby Avenue - Elgin Mills Road
Elgin Mills Road - Bernard Avenue
Bernard Avenue - 19th-Gamble
19th-Gamble - King Road
King Road - Bloomington Road
Bloomington Road - Henderson Drive
Henderson Drive - Golf Links Drive
Exhibit 2.12: Average Speed for Existing VIVA Blue Service
Golf Links Drive - Wellington Street
Wellington Street - Orchard Heights
Orchard Heights - Mulock Drive
North Yonge EA Study Area
Mulock Drive - Eagle Street
Eagle Street - Newmarket Terminal
York Region Rapid Transit Corporation
ASSESSMENT
NORTH YONGE STREET CORRIDOR PUBLIC TRANSIT AND ASSOCIATED ROAD IMPROVEMENTS TRANSIT CLASS ENVIRONMENTAL
Page 25IBI GROUP TRANSPORTATION ASSESSMENT
York Region Rapid Transit Corporation
NORTH YONGE STREET CORRIDOR PUBLIC TRANSIT AND ASSOCIATED ROAD IMPROVEMENTS TRANSIT CLASS ENVIRONMENTAL
ASSESSMENT
3. FUTURE BASE CASE TRANSPORTATION CONDITIONS
3.1 Future Land Use Projections
Much of the initial travel demand modelling work for the North Yonge EA relied on land use
forecasts originally supplied by York Region in 2003 as part of the Travel Demand Forecasting
Model. An update to these forecasts was received in 2006 and included some adjustments at the
traffic zone level, but the control totals at the local municipality and region level remained the same.
These updated forecasts were used to develop the ridership estimates and are summarized on
Exhibit 3.1 and Exhibit 3.2. Exhibit 3.3 and Exhibit 3.4 illustrate how these forecasts are allocated
on a traffic zone basis while Exhibit 3.5 and Exhibit 3.6 highlight the growth portion only between
2006 and 2031.
These forecasts are consistent with the intent of the Places to Grow legislation, but may not reflect
the most recent updates provided by local municipalities. It is noted that, while the forecasts take
into account the impacts of Places to Grow, no modifications were made to concentrate future
development in nodes and corridors served by rapid transit, which typically occurs with the
introduction of new rapid transit facilities. This reflects a conservative assumption for the
development of YRTP ridership forecasts.
It is also noted that the employment forecasts for East Gwillimbury are lower than the most recent
projections, but this should not affect the peak direction (AM peak hour southbound) ridership
estimates significantly.
August 2008 Page 26You can also read