NATURE AND CLIMATE SOLUTIONS FOR MINNESOTA - solutions for minnesota 2021
←
→
Page content transcription
If your browser does not render page correctly, please read the page content below
NATURE AND CLIMATE
SOLUTIONS FOR MINNESOTA

2021 1
NATURE AND CLIMATE
 SOLUTIONS FOR MINNESOTA
Authors: Marissa Ahlering, Kristen Blann, Meredith Cornett, Sachiko Graber, Chris Lenhart, Mark White

2021

ACKNOWLEDGMENTS
The authors would like to thank the Cox Family Fund for Science and Research for their generous financial contribution to
this work.

________

 Contact: Sachiko Graber, sachiko.graber@tnc.org
 Sachi Graber is the Climate Policy lead for TNC in Minnesota, North Dakota and South Dakota. Her work
 focuses on scaling climate mitigation and adaptation strategies via policy, corporate support, and
 community engagement. Sachi’s commitment to climate policy stems from deep passion and experience
 in renewable energy and community development.

Cover © Jason Whalen/Fauna Creative
 2

CONTENTS

Executive Summary .......................................................................................................................................................................................... 4

Climate Change and Minnesota .................................................................................................................................................................... 6

Natural Climate Solutions ............................................................................................................................................................................... 9

Nature-Based Adaptation .............................................................................................................................................................................. 12

Climate Policy in Minnesota ..........................................................................................................................................................................14

Next Steps .......................................................................................................................................................................................................... 17

Appendix A. Natural Climate Solutions Practices Data Summary ....................................................................................................... 18

Appendix B. Sequestration Potential of Natural Climate Solution Practices .................................................................................... 20

Appendix C. Area Available for Natural Climate Solutions Implementation in Minnesota .......................................................... 28

 3

Improved forest management has significant climate mitigation potential in Minnesota. © John Gregor

EXECUTIVE SUMMARY

Minnesota’s climate is changing and will continue to do so enough. We failed to meet our 2015 target, and we’re not
long into the future. Minnesotans are already witnessing on track for 2025 either.
rising temperatures, warming water, and fewer days of ice.
Warming temperatures pose threats in a range of ways, Natural climate solutions can help to meet these state
from health to economic productivity to crime rates. It is climate targets. They offer an estimated mitigation
imperative that we act now to preserve our Minnesota; potential of 26 million metric tonnes per year—as much as
our land, our communities, and our ways of life are all at taking seven coal plants offline. Practical opportunities like
risk. Nature is one of the keys to climate action. reforestation and cover cropping can affordably help
 Minnesota reduce the severity of climate change (see
Minnesota is poised to take the lead when it comes to Figure ES-1). And, implementing just 25% of our NCS in
fighting climate change in the U.S.—one of the world’s top Minnesota could yield $97 million annual revenue through
three emitters of greenhouse gases. Minnesota is leading a carbon market.
the Midwest through state emissions reductions targets,
which include the reduction of greenhouse gas emissions In addition to mitigating a significant portion of
by 80% by 2050 compared to 2005 levels. The state has Minnesota’s greenhouse gas emissions, nature can make
already reduced emissions by more than 10%—but it’s not us more resilient to climate change. A range of nature-
 based adaptation opportunities are available in

 4

Minnesota—practices that can help our communities cope private sector climate responses, philanthropic support,
with the changing climate. Nature-based adaptation and individual action will all play a significant in achieving
strategies can protect our land against flooding, maintain our natural climate potential. Planning today will enable
our soil, and protect our cities against the urban heat Minnesotans to protect our communities and our wild
island effect. places like they deserve.

For natural climate solutions and nature-based adaptation
to reach their full potential, protecting our communities
and reducing the impact of climate change, we must
choose to act now. These opportunities require funding
and capacity to implement. State policy, agency action,

Figure ES-1. Natural climate solutions offer 26 million metric tonnes CO2e/year mitigation potential in Minnesota, with the largest opportunities within
the forestry and agriculture sectors.

This report is intended to share a high-level understanding of the natural climate solutions practices available in the state
of Minnesota. The authors emphasize that the numbers are not final but represent our best current estimate of the
opportunity. Research in the coming years will certainly refine our estimates and will need to be considered as they are
available.

 5

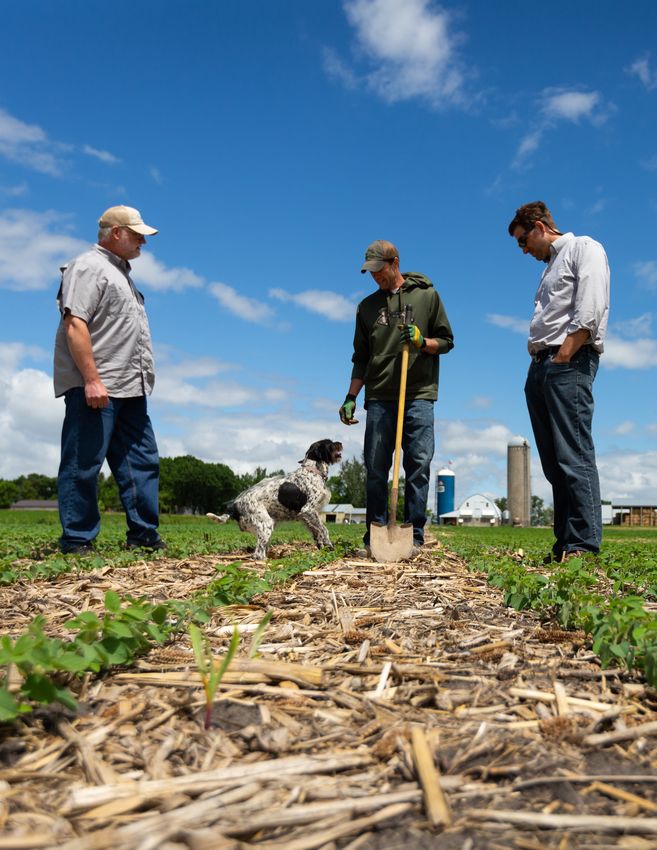
Widespread use of conservation practices in agriculture could help producers and store more carbon. © Bruce Leventhal

CLIMATE CHANGE AND MINNESOTA

Climate change i,1 is one of the greatest challenges
 BOX 1.
facing Minnesota. The effects of climate change are
already evident in many of our landscapes and
 MINNESOTA’S CHANGING CLIMATE,
communities. For instance, streams in the Twin Cities BY THE NUMBERS
metro area demonstrate increasing water temperatures.
Ice-in is delayed, while ice-out occurs earlier. 2 By 2018, 2.9: Average temperature increase, degrees
Minnesota rivers saw about 10 fewer days of ice than in Fahrenheit, over the last century
1930, and this dampened experiences ranging from
 3.4: Average increase in inches of annual
skating season to fishing rules. 3
 precipitation over the last century

 4.8: Average increase in Northern Minnesota winter
 lows in degrees Fahrenheit since 1895 4

i
 Climate change is caused by the accumulation of greenhouse gases in the become a politically polarizing issue in the last several decades, the
atmosphere, which lead to changing environmental conditions around the Intergovernmental Panel on Climate Change says scientific evidence for
world. Although atmospheric conditions are global, many of the causes and warming of the climate system is unequivocal.
solutions to climate change are local. And, although climate change has
 6

Projections for climate change in Minnesota indicate As Minnesota experiences these climatic changes,
significant impacts to our local ecosystems. Northern statewide economic activity and growth potential will
conifers like tamarack, spruces, fir and pines are already shift. Warmer winters could extend growing seasons, and
seeing insect damage; and climate amplified insect soybean yields could increase by up to 17% by 2050 due
populations will hasten the decline of boreal forest tree to warmer temperatures and greater carbon dioxide
species (additional forest impacts are further documented concentrations. However, the production of other crops,
in a recent Minnesota Forest Resources Council report). 5 like corn, will likely decrease; and livestock production
Loons will likely move north out of Minnesota due to may dip as animals’ body temperatures increase. 13 Labor
warming temperatures by the end of the century—while productivity is expected to decline, especially in sectors
other species, like the lynx and the moose, have already with high-risk work, such as construction, transportation,
started to move on. 6 and agriculture. 14 Residents of the greater Twin Cities
 region will spend less on heating in the winter but more on
Minnesota temperatures are rising faster than cooling in the summer, which will cause a total increase in
the global average, and both summer and winter electricity demand. 15 And, rising temperatures are linked
temperatures will likely rise more than six with greater crime. Minnesota may see up to a 6%
degrees Fahrenheit over pre-industrial levels in increase in crime by 2100 due to climate change. 16
the next 50 years.
 Climate change is caused by greenhouse gases; and in
Minnesota temperatures are rising faster than the global 2016, the state of Minnesota emitted 140 million
average, and both summer and winter temperatures will metric tonnes (MMT) of carbon dioxide equivalents
likely rise more than six degrees Fahrenheit over pre- (CO2e). 17 This puts Minnesota close to the national
industrial levels in the next 50 years. By that time, median of per capita emissions. 18 As a state, Minnesota
Minnesota summers will feel more like Kansas today. 7 has already reduced emissions by 12%; ii but we have more
Southern Minnesota may face 15–20 more 90 degree days work to do. Minnesota has set ambitious goals of 30%
than in the past. Rising temperatures will be most extreme emissions reduction by 2025 and 80% by 2050,
in the center of Minneapolis, where the urban heat island compared to 2005 levels. 19 This means we must reduce
effect will cause the city to feel four degrees warmer than annual emissions by an additional 30 MMT CO2e by
the rest of the state. 8 More than 110,000 Minnesotans are 2025. 20 In addition to reducing our emissions—
already vulnerable to extreme heat, and this number will mitigation—we must also adapt to enable society to cope
rise in tandem with temperatures. 9 with the already-present impacts of climate change (see
 Box 2 for more on adaptation, mitigation, and natural
Precipitation across the state is also likely to increase with solutions to both).
climate change. 10 Extreme rain events and floods will be
nearly 50% more common by 2050. These floods will As the impacts of climate change become more extreme,
augment the deleterious effects of pests like the emerald Minnesotans will experience greater threats to our
ash borer, and 1.7 billion gallons of additional water will livelihoods, communities, and ways of life. Solutions to
run off of unprotected landscapes—stimulating algal combat climate change exist, and now it is up to us to
blooms and other ecological challenges. 11 In addition to find the strategies that will work best for Minnesota.
affecting native wildlife, changing conditions on lakes and
rivers will impact coastal property values and trade. As
flooding and erosion increase, transportation on (and
near) the Mississippi River could experience stress due to
extreme heat and flooding. 12

ii
 Compared to 2005 levels

 7

BOX 2.
ADAPTATION AND MITIGATION

Now is the time for us to act. Minnesota has vast opportunities to mitigate and adapt to climate change immediately.

Mitigation refers to actions that reduce the severity of climate change by decreasing our greenhouse gas emissions. This
can be done through transitions away from fossil-based energy (coal, gasoline) or by storing more carbon (for example, in
biomass).

Adaptation refers to actions that improve the ability of people and nature to cope with climate change. We can adapt
through natural or technological means—for instance, by restoring floodplains to decrease the impact of floods on our
local communities, or by building stronger more storm-resistant buildings. Nature also needs to adapt to climate change,
because as many ecosystems warm and weather patterns change, plant and animal species may no longer find favorable
conditions in places they once thrived.

Many solutions contribute both to mitigation and adaptation efforts. For instance, reforestation can store carbon in trees
(reducing net carbon emissions) while also creating a more resilient natural system that can handle greater precipitation
and temperature variability. A transition to renewable energy can reduce carbon emissions from fossil fuel combustion
while also making our communities more resilient through decreased dependence on international supply chains that can
be interrupted by storms.

 Mitigation – reducing emissions Adaptation – reducing damage
• Natural Climate Solutions can mitigate 30% of • Natural systems can address climate hazards
 current emissions globally like flooding and erosion
• Land use practices are “the most cost-effective • 96% of the U.S. population lives in counties
 carbon sequestration method available 21 where weather-related disasters were federally
• Implementing 25% of our NCS in Minnesota declared in the last decade 22
 would yield $97 million annual revenue in a • Improved management and greater plant
 carbon market iii diversity can ensure future environmental,
 health, economic, and societal resilience while
 ensuring our natural climate solutions are
 sustainable over the long-term

iii
 Assuming $15/metric tonne CO2e/yr offset.

 8

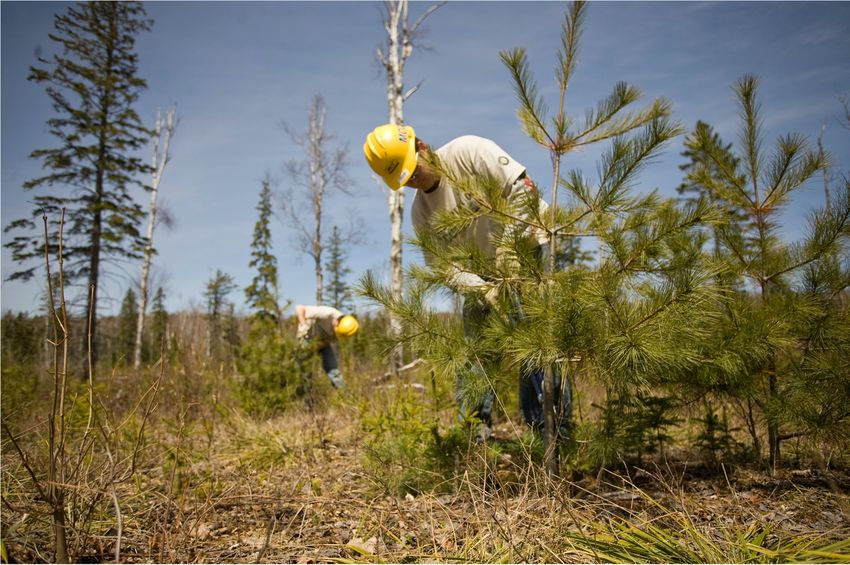
Reforestation is the natural climate solution with the greatest overall potential in Minnesota. © Jason Whalen/Fauna

NATURAL CLIMATE SOLUTIONS

Natural Climate Solutions (NCS) are conservation, Minnesota offers the eighth largest NCS opportunity of
restoration, and improved land management practices any U.S. state. iv23
that increase carbon storage or avoid greenhouse gas Natural climate solutions offer a 26 million
emissions in landscapes and wetlands across the globe. metric tonne CO2e annual mitigation potential in
NCS take advantage of natural mechanisms through which Minnesota. This is equal to taking seven coal
earth systems already process carbon and other harmful plants offline and represents an annual value of
gases. For instance, through photosynthesis, trees absorb $390 million.
carbon dioxide and turn it into solid biomass. Chemical
and microscopic processes convert carbon dioxide from NCS offer a 26 million metric tonne (MMT) CO2e annual
the air into solids that are stored as soil carbon. And mitigation potential in Minnesota—meaning that if
peatlands—one of Minnesota’s most unique ecological implemented to their full scale, they could offset
systems—store carbon from ancient plants and animals, emissions equal to 26 MMT each year. This is equal to the
preventing it from being released into the atmosphere. reductions we would see by taking seven coal power
 plants offline, 24 representing an annual value of about

iv
 The carbon stored by many products emerging from natural and
working land industries, including wood products, can contribute
significantly to climate impacts but is beyond the scope of this report.

 9

$390 million. v Further, 26 MMT represents 16% of • Reforestation (7.99 MMT CO2e/yr potential).
Minnesota’s total 2005 emissions, and more than half of Reforestation stores carbon in biomass above and
our commitment to reach 30% reduction by 2025. NCS below the ground, and targets historically forested
offer a crucial opportunity to supplement the ambitious areas. 25 Reforestation includes the replanting of trees
energy and transportation transitions already underway to on degraded, converted, agricultural, and urban
further mitigate climate change. landscapes. In Minnesota, the primary reforestation
 practice is to restore northern or mixed woods on over
This report summarizes 13 natural climate solutions 3 million acres. Tree-planting on agricultural lands (i.e.
practices available in Minnesota, which unlike many alley cropping) may be feasible on over 2 million acres;
proposed technological approaches to carbon capture, are and urban reforestation is likely possible on only 0.1
ready to implement today. The relevant potential of these million acres.
practices is illustrated in Figure 1, while Appendices A, B, • Cover cropping (6.41 MMT CO2e/yr potential). Cover
and C contain more detailed data. cropping provides “additional soil carbon sequestration
 gained by growing a cover crop in the fallow season
The NCS practices with the highest opportunity for carbon between main crops” and is mainly considered where it
storage in Minnesota include reforestation, cover can supplement major row crops like corn and
cropping, improved forest management, improved soybeans. 26
nutrient management, and no-till/low-till (reduced • Improved forest management (IFM) (3.29 MMT
tillage). These practices are defined below, and detail for CO2e/yr potential). Acknowledging the importance of
all 13 practices is provided in Appendix A. active forest management, IFM includes practices such

Figure 1. Natural climate solutions offer 26 million metric tonnes CO2e/year mitigation potential in Minnesota, with great opportunity in the agriculture
and forestry sectors.

v
 Assuming a conservative $15/metric tonne value of carbon. The value
to society would be much higher.

 10
as extended rotation, increased stocking, thinning, and storage. For instance, avoided forest conversion and
 multi-age management. In general, these practices avoided peatland conversion offer faster sequestration
 increase the amount of biomass in a forest by enabling rates (tonnes CO2e/acre/year) than any other practice—
 longer growth, greater diversity, and/or greater by nearly a factor of ten. This illustrates the fact that, while
 resilience. They also help increase the amount of the area available for these practices is relatively small,
 carbon stored in harvested forest products. the protection of at-risk ecosystems may be an important
• Improved nutrient management (2.25 MMT CO2e/yr first step.
 potential). Improved nutrient management reduces
 nitrous oxide (N2O) emissions that result from the Leadership within the land use sector is especially critical
 reaction of nitrogen-based fertilizers. Reduced nutrient for driving systemic climate action among all sectors.
 application rates, the transition from anhydrous While land use is the third leading source of emissions in
 ammonia to urea, improved timing of fertilizer Minnesota today, it also offers the greatest potential for
 application, or variable fertilizer application within the carbon storage. 29 There is great opportunity for direction
 field can all reduce the total base of nitrogen available from agricultural and forestry leaders. One such leader,
 for potential release to the atmosphere. 27 the Field to Market Alliance, has indicated that more than
• Low-till/no-till (1.83 MMT CO2e/yr potential). half of its members have already established public
 Reduced tillage practices, including low-till and no-till, climate commitments and measurable targets for
 reduce aeration of the soil. Since aeration of upper greenhouse gas emissions reduction. 30
 levels of the soil ordinarily accounts for greater
 decomposition rates and the release of greenhouse To reach scale, NCS require the support from a wide range
 gases, reduced aeration can result in slower of stakeholders. Individual efforts are required to build
 decomposition and thus greater stocks of carbon and awareness, acceptance, and demonstration of new
 other nutrients throughout the soil. Reduced tillage practices so that they can become more widely
 practices are noted to vary significantly across implemented. Nonprofit and philanthropic efforts will
 different soil types and measurement practices. 28 likely need to help bridge the gap to scalable, financially
 viable implementation—which will be implemented by
It is important to note that although these five practices corporate and private-sector businesses. Finally, policy
offer the greatest total magnitude of opportunity, they support is needed to incentivize and scale solutions to
may not be the most efficient mechanisms for carbon achieve our full NCS potential.

 11
Cover crops, reduced tillage, and improved nutrient management have enormous potential in Minnesota. © Jason Whalen/Fauna Creative

 12
Ensuring our lands are adapted to climate change will benefit both nature and people. © Richard Hamilton Smith

NATURE-BASED ADAPTATION

Nature-Based Adaptation (NBA) refers to the use of island effect to decrease the negative health impacts of
nature-based strategies to facilitate adaptation in rising temperatures. Increasing resilience and adaptability
natural systems for both biodiversity and for the people in our natural and working lands in Minnesota will improve
who rely on those systems. Although the focus of this livelihoods for farmers and ranchers across much of the
report is Natural Climate Solutions for mitigation, NBA is state, as well as outdoor recreation opportunities and
equally important when it comes to Minnesota’s response experiences for all Minnesotans.
to climate change and for making sure Natural Climate
Solutions can persist. NBA reflects many of the practices Leading institutions are beginning to consider NBA as a
required for community and ecosystems to continue climate response at every level of governance. The Army
thriving in the face of increasingly severe climate impacts. Corps of Engineers is implementing an Engineering with
In Minnesota, some of the most critical NBA practices are Nature initiative that focuses on the community co-
solutions to address flooding. These practices mimic or benefits realized through green infrastructure around
restore nature’s potential to reduce flooding and erosion water systems. 34 The Resiliency and Adaptation Team
through planning, zoning, regulations, and built projects. 31 recommendations to Minnesota’s climate change
Globally, wetlands provide adaptation and ecosystem subcabinet include a focus on incentivizing ecosystem-
services valued at $15 trillion. 32 Floodplains, flood based green infrastructure. And the City of Minneapolis
bypasses, waterfront parks, resettlement, and the Climate Action Plan highlights the need for Green Zones
preservation of open space can all increase the capacity of including green infrastructure as well as transportation
landscapes to absorb extreme precipitation events, systems that “promote and strengthen green
reducing damage to communities and ecosystems near infrastructure and natural systems that can build
rivers and streams. Urban tree planting, rain gardens, resilience, sequester or reduce emissions, and improve
green roofs, and floodwater retention are just some of the neighborhoods.” 35
solutions available to reduce urban stormwater flooding
and improve quality of life for city-dwellers. 33 Notably, As climate risks grow, Minnesotans are increasingly aware
many of these solutions will also enhance carbon of the need for better resiliency and adaptation efforts.
sequestration potential to provide mitigation, as well as Planning and implementation of adaptation at the state,
adaptation, benefits. county, and municipal levels must include NBA as part of a
 holistic, economy-wide, equitable package to support all
Other NBA solutions will protect our communities in other people and ecosystems as the climate changes.
ways. Urban tree-planting will reduce the urban heat

 13
Protecting and restoring nature will help protect Minnesota's quality of life and economy. © Paula Champagne

 14
Policy will play a critical role in advancing natural climate solutions in Minnesota. © iStock

CLIMATE POLICY IN MINNESOTA

The scale of action required to address climate change is access, but much more must still be done to identify and
staggering (see Box 3). Minnesota is poised to take the implement the right climate solutions for Minnesota. And,
lead when it comes to climate action, but our current among a host of mitigation policy options, we know that
efforts aren’t enough. Ongoing advances towards nature will play a role.
emissions reduction must be paired with greater carbon
sequestration—fueled by natural climate solutions. Global society has already hit the point at which “carbon
 drawdown is now essential and must be expanded
Minnesota is a leader in climate policy, as one of only rapidly.” 38 Minnesota missed the first intermediate goal of
thirteen states and the only Midwest state with a statutory the Next Generation Energy Act, which required 15%
greenhouse gas reduction requirement. vi,36 A state climate emissions reduction from 2005 levels by 2015. The state
change subcabinet was tasked in 2019 to “tackle climate is currently not on track to meet the next intermediate
change, create good-paying jobs, and pioneer the clean target of 30% reduction by 2025. 39
energy economy.” 37 Numerous pieces of legislation have
been developed to advance clean energy progress and

 Michigan has an executive greenhouse gas emissions reduction target,
vi

but not a statutory one.

 15
There are numerous opportunities for reducing net To meet our state targets as indicated in the
greenhouse gas emissions in Minnesota. Net emissions Next Generation Energy Act, we must do more
refers to the total impact of actual emissions compared to than gradually reduce emissions. Natural climate
any negative emissions realized through carbon storage solutions can help us meet our goals by “drawing
and sequestration. down” carbon from the atmosphere to increase
 carbon storage and sequestration. This
Four key opportunities exist to significantly reduce drawdown can complement emissions reduction
emissions in Minnesota: through a transition to clean electricity, clean
• Reduce electricity emissions. Minnesota has already transportation, and clean buildings.
 made significant progress reducing emissions
 associated with energy generation. The emissions of To meet our state targets as indicated in the Next
 electricity generated in-state have declined by 6 Generation Energy Act, 47 we must do more than gradually
 million tonnes, and overall electricity-associated reduce emissions. Natural climate solutions can help us
 emissions decreased by 29% between 2005-2016. 40 meet our goals by “drawing down” carbon from the
 Additional coal plant closures and renewable energy atmosphere to increase carbon storage and sequestration.
 build-out suggest that electricity-related emissions will This drawdown can complement emissions reduction
 continue to fall over the coming decades. through a transition to clean electricity, clean
• Reduce transportation emissions. Transportation- transportation, and clean buildings. Since our environment
 related emissions have decreased by 8% since 2005, requires more drastic changes than our economy will
 but they are now the leading source of greenhouses allow, carbon storage and sequestration will be critical to
 gases in the state. Advances in vehicle electrification sufficiently decreasing net emissions while we maintain a
 and the proposed Clean Cars Minnesota effort may robust state economy. To offset emissions:
 enable significant reduction in the future. 41 • Natural Climate Solutions enable carbon capture
• Reduce land-based emissions. Minnesota’s emissions through natural means—most commonly through
 from the agriculture, forestry, and land use sector have photosynthesis. Natural and working lands, including
 stayed approximately constant since 2005. 42 Slight ranches, farms, and working forests, can capture and
 fluctuations have increased and decreased emissions, store carbon in plant biomass and in the soil in a
 but there is no clear trend. manner that is compatible with economic production.
• Reduce industrial emissions. Industrial, residential, Natural climate solutions can offset 18% of
 and commercial emissions have all increased in the Minnesota’s 2016 emissions.
 state of Minnesota since 2005. 43 Reductions in these • Carbon capture and storage represents a few
 sectors through electrification (fuel-switching) and technical solutions that can be deployed to capture
 energy efficiency measures will be critical in the future. carbon at the source and store it, avoiding release into
 the atmosphere. Most carbon capture and storage
 (CCS) technologies are still being developed and have
 not been widely deployed to date. Generally, CCS
 Box 3.
 technologies are also significantly more expensive than
 THE SCALE OF CHANGE
 their natural counterparts, which can be a barrier to
 near-term implementation. 48
 Total emissions in 2016: 139.9 million metric
 tonnes are equivalent to:

 30 million passenger cars 44
 36 coal-fired plants 45
 15 million trees (or more) 46

 16
Now that we understand the severity of climate change, agricultural best management practices and incentivizing
we need to slow it down. Natural climate solutions offer soil health practices.
one of our best opportunities for storing vast quantities of
carbon. They are more affordable and more practical to As we work toward climate mitigation, we also need to
implement immediately than other sequestration help Minnesotan communities adapt to climate change.
techniques, since they rely on natural mechanisms that Nature has a role to play when it comes to adaptation, as
are already well-understood. But nature needs our help. well as mitigation. Nature-based adaptation includes
A combination of state and private efforts must accelerate proven strategies for helping communities become more
the widespread adoption of natural climate solutions in resilient to changing weather patterns and enhanced risk.
Minnesota. In particular, state agencies can lead the way They offer relatively well-understood solutions rooted in
by, for instance, expanding forestry programs, the land that can complement other infrastructure needs.
implementing improved forest management on state And, nature-based approaches to both mitigation and
lands, and protecting additional grasslands. State agencies adaptation are more cost-effective than other solutions,
can also support private implementation as well, such as while offering numerous co-benefits. 49
by ensuring financing mechanisms are available for

Farmers can play a leading role in helping Minnesota achieve its climate goals © John Gregor

 17
Ensuring Minnesota's Northwoods remain diverse and healthy is a key climate strategy © John Gregor

NEXT STEPS

The findings of this report demonstrate the size of the reforestation on private lands. Corporate leaders may also
opportunity for nature to help Minnesota address climate benefit, both by enhanced perception as environmental
change. By offering the potential to mitigate nearly 20% of and climate leaders and through the use of NCS to
state emissions while enhancing our adaptive capacity, mitigate Scope 3 emissions.
nature-based solutions simply cannot be ignored. To
enable our natural systems and the protection they offer Individual action offers a final opportunity to scale
against climate change, action is required from key nature-based climate solutions. Individual landowners, for
sectors: example, may be early adopters, demonstrating the
 concept of new NCS practices before they reach the
Policy action will be required to enable nature-based mainstream. Individual advocacy will also be critical in
adaptation and mitigation activities to reach scale. Policy driving local, county, and state governments to prioritize
can be a tool to set state targets for natural climate and plan for the implementation of NCS and NBA.
solutions, direct research and implementation, enable new
practices on public land, and provide funding and financing Academic and industry research is required to continue
opportunities for new equipment or other investments refining our understanding of the NCS opportunity,
required to scale NCS practices. Policy and planning highest-value intervention points, and to guide on-the-
mechanisms could also drive local action, such as city ground practices. The authors of this report have noted
adaptation planning that accounts for nature-based that many NCS numbers are still evolving. Scientists from
adaptation needs. To complement NCS, decision-makers The Nature Conservancy, the University of Minnesota
should also consider the carbon stored in durable products Institute on the Environment and Forest Resources
from natural and working lands—such as wood products— Department, the Natural Resources Research Institute,
as well as the practices discussed in this report. 50 Dovetail Partners, Inc., Resource Assessment at the
 Minnesota Department of Natural Resources, and other
Corporate and philanthropic leadership can drive the institutions are working to understand nature’s true
implementation of new practices. Funding and investment, capacity. We will update this report and other
for instance, may be essential to achieve significant documentation to ensure that we provide the best and

 18
most accurate information about the impact of natural
climate solutions in Minnesota.

Appendix A. Natural Climate Solutions Practices
Data Summary

Thirteen natural climate solutions (NCS) practices are relevant to Minnesota. An overview of the opportunity for these is
provided in Table A1, while they are further defined below.

Table A1. Summary of Minnesota’s 13 NCS practices and the magnitude of their respective sequestration rates, area of
relevance, and total carbon storage potential.

 Sequestration Rate Potential Scale (million Total Annual Sequestration
 Practice
 (Mt/acre/year)* acres) Potential (MMT/year)*
 Avoided Forest Conversion 12.49 0.05 0.62
 Avoided Grassland
 1.21 0.06 0.07
 Conversion
 Avoided Peatland
 10.25 0.01 0.10
 Conversion
 Avoided Wetland
 2.10 0.25 0.53
 Conversion
 Cover Cropping 0.47 13.63 6.41
 Grassland Restoration 2.53 0.17 0.43
 Improved Forest
 0.75 4.39 3.29
 Management
 Improved Nutrient
 0.17 13.63 2.25
 Management
 No-Till / Low-Till 0.33 5.63 1.83
 Peatland Restoration 0.70 0.50 0.35
 Reforestation 1.06** 5.58 7.99
 Riparian Forest Buffers 4.00 0.20 0.79
 Wetland Restoration 3.70 0.30 1.11

 Total 25.77

*Mt = Metric tonnes CO2 equivalents ; MMT = Million metric tonnes CO2 equivalents
**for 2.38 million acres of reforestation available on agricultural land, the sequestration rate is somewhat higher (see Appendix B).

 19
Practice Descriptions
Avoided Forest Conversion refers to the reduction of variable fertilizer application within the field can all reduce
persistent forest clearing, through which forest land is the total base of nitrogen available for potential release to
converted to another land use that stores less carbon in the atmosphere. 57
biomass and in the soil. 51
 No-Till/Low-Till practices, also referred to as reduced
Avoided Grassland Conversion maintains the significant tillage, reduce aeration of the soil. Since aeration of upper
carbon stocks available in native grasslands. Carbon is levels of the soil ordinarily accounts for greater
stored above- and below-ground in grassland ecosystems. decomposition rates and the release of greenhouse gases,
 reduced aeration can result in slower decomposition and thus
Avoided Peatland Conversion retains existing carbon
 greater carbon (and other nutrient) stocks throughout the
stocks and prevents their release into the atmosphere.
 soil. Reduced tillage practices are noted to vary significantly
Peatlands store large quantities of carbon due to the slow
 across different soil types and measurement practices. 58
decomposition of organic matter. The conversion of
peatland, via draining or other harvest, can result in the Peatland Restoration refers to the rewetting and restoration of
release of significant CO2 stores. 52 former peatlands that have been drained for agriculture or
 other purposes. The rewetting process slows continued
Avoided Wetland Conversion reduces the loss of carbon
 emissions from organic matter decomposition in the peat,
naturally stored in plant biomass, soil organic matter, and
 returning the land to its slow rate of decomposition.
other sediment buildup. 53
 Reforestation offers “carbon sequestration in above- and
Cover Cropping provides “additional soil carbon
 belowground biomass and soils by converting non-forest
sequestration gained by growing a cover crop in the fallow
 to forest in areas where forests are the native cover
season between main crops” and is mainly considered where
 type.” 59 Here, it includes the potential for carbon
it can supplement major row crops like corn and soy.54
 sequestration through tree-planting in all historically
Grassland Restoration enables additional carbon storage forested areas, including degraded, converted, agricultural,
in soil and plant biomass when land formerly converted for and urban lands. In particular, some studies refer to urban
other uses is returned to its original grassland state. 55 reforestation—additional carbon stored in above- and
Improved Forest Management acknowledges the below-ground biomass in urban settings—or alley
importance of active forest management and includes cropping, which stores carbon “by planting wide rows of
practices such as extended rotation, increased stocking, trees with a companion crop grown in the alley-ways
thinning, and multi-age management. These practices between the rows” and is assumed to be feasible on no
increase the amount of biomass in a forest by enabling more than 10% of row cropland. 60
longer growth, greater diversity, and/or greater Riparian Forest Buffers protect land adjacent to streams,
resilience—in addition to helping increase the amount of lakes, or other bodies of water by filtering runoff, reducing
carbon stored in harvested forest products. In particular, erosion, and creating habitat through the restoration of
older trees and the inclusion of multiple age cohorts within tree coverage. They offer climate adaptation benefits by
a single stand can store more carbon per acre. By protecting nearby land from floods, and climate mitigation
introducing greater age and species diversity, forests benefits by increasing carbon storage in plant biomass and
develop greater resilience and reduced susceptibility to soil carbon through increased vegetation and vegetative
disturbances. This resiliency enables better carbon diversity. 61
management due to improved overall health—as well as
 Wetland Restoration enables carbon lost from biomass,
by enabling greater tree density due to differential tree
 soil carbon, and sediment to be rebuilt. It is most common
size.56
 where wetlands have been drained or altered for
Improved Nutrient Management reduces N2O agricultural activity and the soil degraded. Wetland
emissions—a greenhouse gas—that result from the restoration offers a host of other benefits as well, including
reaction of nitrogen-based fertilizers. Reduced nutrient community and reduced flood risk, water retention, and
application rates, the transition from anhydrous ammonia biodiversity enhancement. 62
to urea, improved timing of fertilizer application, or
 20
Appendix B. Sequestration Potential of Natural
Climate Solution Practices

The sequestration potential of natural climate solution (NCS) practices calculated here result from an upper Great Plains
analysis across Minnesota, North Dakota, and South Dakota. They are used to represent Minnesota values in this report
because this regional analysis is more specific to Minnesota’s ecoregional NCS potential than other studies to date. High,
medium, and low sequestration rates are calculated to demonstrate the potential range of rates that may occur across the
landscape; however, unless noted otherwise, medium sequestration rate values were assumed for NCS potential
calculations throughout this report.

The sequestration rates noted throughout Appendix B reflect the best available understanding of Minnesotan NCS
practices. These rates will likely be refined as climate science is improved.

Avoided Conversion
Avoided Conversion practices are separated from the others, because the emissions avoided by preventing land
conversion are a one-time benefit sustained over a period of time (as opposed to a measurable annual benefit). That
timeframe differs by habitat type, as indicated in the gray box summarizing each practice. The sequestration rate
associated with each practice is assumed to be the average annual release of carbon upon conversion, assuming the total
carbon stored by the landcover type is released (i.e., the total storage capacity divided by the timeframe).

Avoided Forest Conversion
 Storage Capacity: 124.88 metric tonnes (Mt) carbon dioxide equivalents (CO2e) per acre
 Timeframe: 10 years
 Sequestration Rate: 12.49 Mt CO2e/acre/year

Methods: Values were derived from the Forest Inventory and Analysis (FIA) Program plot database for forests between
50-100 years old, accessed through the Evalidator tool 63 and GTR343. 64 GTR343 provides regional carbon estimates for
forest type group for the continental United States. Data were accessed directly through Evalidator. Minnesota has a large
area of forest and double the sampling density compared with requirements. Therefore, there are sufficient plots to
calculate estimates for individual cover types.

For Minnesota’s Northern Temperate-Southern Boreal Forests, the avoided conversion estimates for high, medium, and
low, respectively are as follows: Red pine-white pine, oak-hickory, and spruce-fir. Aspen-birch also fits in the medium
category.

Consistent with Fargione et al. (2018), avoided conversion estimates for forests exclude the soil carbon pool given
inconsistencies in the literature regarding soil carbon loss following forest conversion. 65 However, estimates do include
above- and below-ground biomass (live and dead trees, coarse woody debris, leaf litter and detritus, understory
vegetation).

 21
Avoided Grassland Conversion
 Storage Capacity: 60.54 metric tonnes (Mt) carbon dioxide equivalents (CO2e) per acre
 Timeframe: 50 years
 Sequestration Rate: 1.21 Mt CO2e/acre/year

Methods: The Climate Action Reserve Tool was used to calculate the total emissions per acre over a 50 year period and
down to a soil depth of 20 cm. 66 Following standard practice and including the baseline emissions from soil carbon
(including belowground biomass), baseline N2O, and project methane emissions from enteric fermentation from beef
cattle grazing yielded an average storage rate of 55.55 CO2e. The baseline scenario refers to the case where the site
would have been converted to row crop agriculture, while the project scenario reflects a site protected from conversion.

The Climate Action Reserve Tool’s Baseline Emission Factor tables, modeled for each Major Land Resource Area
(MLRA) 67 across the US using the DAYCENT mechanistic model, were used to identify the MLRAs for Minnesota, North
Dakota, and South Dakota. Soil carbon emissions were then averaged across the three modeled soil textures (fine,
medium, coarse) for each MLRA. The model results were used for grasslands that have existed as grasslands for at least
30 years, assuming many of the sites we will be interested in working on are remnants. The same process was conducted
for the N2O emissions for each MLRA in the region. Finally, soil carbon and N2O emissions were summed together to
provide the total baseline emissions.

For the project scenario, it was assumed that all sites would be grazed with beef cattle. Emissions related to enteric
fermentation were subtracted from baseline emissions. The Climate Action Reserve’s table for grazing values yielded
0.2521 kg CH4/head/day as the enteric fermentation emission factor for cattle. A stocking rate of 0.607 beef
cattle/acre/month was assumed--rounded up from stocking recommendations from South Dakota and North Dakota. 68
A season-long grazing practice of 2.56 months (May 15 – Sept 15) every year was also assumed. These inputs resulted in
1.558 beef cattle/acre for the 2.56 months and 0.3938 kgCH4/acre/yr or 19.64 kgCH4/acre/50yrs.

The Climate Action Reserve’s Global Warming Potential values of 25 for methane and 298 for N2O were assumed.
Final average CO2e storage rates were calculated of 65.53, 55.55, and 43.31 Mt/acre for high, medium, and low
sequestration based on MLRAs represented across the three states.

 22
Figure A1. High, medium, and low grassland carbon dioxide equivalent storage rates per acre over 50 years

Avoided Peatland Conversion
 Storage Capacity: 1024.5 metric tonnes (Mt) carbon dioxide equivalents (CO2e) per acre
 Timeframe: 100 years
 Sequestration Rate: 10.25 Mt CO2e/acre/year

Methods: Avoided peatland conversion mitigation benefits were estimated using values from published reports and
unpublished data. Minnesota peatlands store an estimated of 2,703 Mg CO2e per acre. 69 Conversion in peatlands usually
occurs when they are ditched and drained. The drying of the peat layers exposes the organic material to oxygen, and the
slow process of decomposition and generation of CO2 emissions ensues.

This study assumed that 50% of peat would be lost over a 100-year period because the depth of drainage ditches (six to
eight feet) is less than half the depth of the peat (often 10–20 feet). If the peat loss from conversion were spread out over
100 years, the loss rate would be 27.3 Mg CO2e/year. A better estimate would halve the peat loss to 13.65 Mg
CO2e/acre/year at the high end and use 50% of that at the lower end (6.8 Mg CO2e/acre/year).

For peatlands, avoided conversion makes up most of the overall benefit—or more—for a restoration project. This is
because the rate of organic matter accumulation is so low and the existing stock is so large. 70 (from Scott Bridgham
unpublished data, some of which was used in Fargione et al. 2018).

 23
Avoided Wetland Conversion
 Storage Capacity: 105 metric tonnes (Mt) carbon dioxide equivalents (CO2e) per acre
 Timeframe: 50 years
 Sequestration Rate: 2.10 Mt CO2e/acre/year

Methods: Avoided conversion mitigation benefits for non-peat wetlands were estimated using values from the literature.
The midpoint of the estimated carbon stock was taken to be 227–258 Mt carbon/acre for wetlands (or 242.5 Mt
C/acre). 7172 In the Midwest, carbon stocks for wetlands are reported as ranging from 75–200 Mg/ha. Mg/ha were
converted to Mt/acre by multiplying by 2.47 (acres per hectare) and 3.67 (CO2e/C), respectively.

A high storage value was derived by multiplying 242.5 Mt C/acre * 30–50% loss of soil carbon, the amount of organic
matter that wetland soils in the Midwest are assumed to have lost following drainage and agriculture. This quantity was
then multiplied by 3.67 to convert carbon to CO2e.

A medium storage value was estimated by multiplying the wetlands carbon sequestration rate (2.1 Mt CO2e/acre/year) 73
* 50 years of lost sequestration.

A low storage value was estimated by taking a low-end estimate for wetland carbon sequestration (0.7 Mt
CO2e/acre/year) * 50 years. This approach yielded the same result as starting with a lower-end estimate for wetland C
stocks of 81 Mg C / ha * 30% loss of soil carbon 74 * 3.67 CO2e/C * 1 ha/2.47 acres.

All Other Natural Climate Solutions Practices
Thirteen additional NCS practices are explored here. These practices represent practices available on the land, which
offer annual carbon sequestration benefits once implemented. Some of these are combined in the summary provided in
Table A1 and throughout this report.

Cover Cropping
 Sequestration Rate: 0.47 Mt CO2e/acre/year

Methods: A range of values for carbon sequestration through cover cropping were obtained from agency reports, online
tools and published literature.

High sequestration rate: A sequestration rate was adopted from the Minnesota Board of Water and Soil Resources, as
derived from Anderson et al. 75,76 (0.6 Mt CO2e/acre/year)

Medium sequestration rate: The US State Carbon Mapper tool on Nature4Climate was used to calculate annual
sequestration rates for the Cover Cropping practice (based on Fargione et al. 2018). 77 This straight-forward calculation
involved dividing the millions of Mt CO2e per year benefit by millions of acres available for the practice. This was
calculated at the state level with equivalent results for Minnesota, North Dakota, and South Dakota. (0.47 Mt
CO2e/acre/year)

Low sequestration rate: The sequestration rate from Biardeau et al. (2016) was adopted as a low-end estimate.78
(0.4 Mt CO2e /acre/year)

 24
Grassland Restoration
 Sequestration Rate: 2.53 Mt CO2e/acre/year

Methods: The US State Carbon Mapper tool on the Nature4Climatewebsite—based on Fargione et al. 2018—was used to
calculate annual sequestration rates for the Grassland Restoration practice in Minnesota, North Dakota, and South
Dakota. 79 This straight-forward calculation involved dividing the millions of Mt CO2e per year benefit by millions of acres
available for the practice. The sequestration rate is highest for Minnesota (2.53 Mt/acre/year) and lowest for South
Dakota. (2.06 Mt/acre/year)

Improved Forest Management (IFM)
 Sequestration Rate: 0.75 Mt CO2e/acre/year

Methods: Forest Vegetation Simulator results for temperate-southern boreal, extended rotation were used projecting
50–70 years beyond economic rotation age. 80 The same were assessed for multi-aged mixed-wood management based
on results from White and Manolis (2011). 81

For aspen forests, extended rotation is ~20 years beyond a normal rotation (usually 40 years). Multi-age values represent
the difference in CO2e uptake rates for the first 100 years of simulation. Additional CO2e uptake was calculated based on
the increase in carbon gained using multi-aged management above baseline values in business as usual forest
management. Because extended rotation yielded an approximate sequestration rate of 0.75 Mt CO2e/acre/year and
multi-age management a rate of 0.81 Mt CO2e/acre/year, the conservative rate of 0.75 Mt CO2e/acre/year is assumed
for all IFM implemented.

To determine total carbon stored for a given number of years above baseline sequestration rate, additional storage
capacity is added to the baseline value. For example, a calculation for extended rotation is provided below.

 ER = extended rotation rate
 , 1 − , 2
 = ℎ , 1 = 120 , 2= 61

 ER = (195-120)/50 = 1.51 MtCO2e/acre/yr

 Extended rotation of 40 years: Total C at age 110 = 120(C age 60) + (1.51 *40 years) = 180.4 Additional C = 40
 MtCO2e/acre

 25
Improved (Precision) Nutrient Management
 Sequestration Rate: 0.17 Mt CO2e/acre/year

Methods: A range of values were obtained from published literature and online tools.

High sequestration rate: Rate was adopted from Biardeau et al. 82 (0.2 Mt CO2e/acre/year)

Low sequestration rate: Figures from the US State Carbon Mapper tool on Nature4Climate (based on Fargione et al.
2018) were used to calculate annual sequestration rates for the Improved Nutrient Management practice. 83 This assumes
climate impacts accrue from avoided N2O emissions achieved through more efficient use of nitrogen fertilizers and
avoided upstream emissions from fertilizer manufacture. Nature4Climate considered four improved management
practices: 1) Reduced whole-field application rate; 2) switching from anhydrous ammonia to urea; 3) improved timing of
fertilizer application; 4) variable application rate within field.

The low sequestration rate figure was calculated using numbers for South Dakota, dividing millions of Mt CO2e per year
benefit by (2.41 Million Mt CO2e total) by millions of acres of cropland (19 million acres according to the USDA for SD).
(0.13 Mt CO2e/acre/year)

Medium sequestration rate: The medium value was taken as the midpoint between the high and low values identified
from the literature. (0.17 Mt CO2e/acre/year)

No-Till / Low-Till (Reduced Till)
 Sequestration Rate: 0.33 Mt CO2e/acre/year

Methods: Numbers were adopted from Biardeau et al. (2016) for high and low levels and a value for medium levels was
calculated between the two endpoints. 84

High sequestration rate: Numbers for no-till were used, which considers additional carbon stored as compared to
conventional agriculture practices. (0.45 Mt CO2e/acre/year)

Low sequestration rate: Numbers for reduced tillage were used, which considers additional carbon stored as compared
to conventional agriculture practices. (0.2 Mt CO2e/acre/year)

Medium sequestration rate: The medium value was taken as the midpoint between the high and low values identified
from the literature. (0.33 Mt CO2e/acre/year)

 26
Peatland Restoration (Rewetting)
 Sequestration Rate: 0.70 Mt CO2e/acre/year

Methods: Very few data are available on peatland restoration and carbon storage change in the U.S., though there has
been some assessment in Canada and northern Europe (Scotland and Ireland). Although some wetlands may be net
sources of carbon from past drainage and recent climate change, restoration through re-wetting will have a positive
benefit on the carbon balance, reducing the rate of loss to CO2 emissions.

High sequestration rate: The high number was derived from Bridgham et al. used to develop averages for Fargione et al.
(2018). 85 (1.4 Mt CO2e/acre/year)

Medium sequestration rate: This figure was obtained from Anderson et al., which provide a more conservative estimate
than Bridgham. 86 (0.7 Mt CO2e/acre/year)

Low sequestration rate: The low number is 0 and assumes a failed restoration.

Reforestation
 Sequestration Rate: 1.06 Mt CO2e/acre/year for general reforestation; 1.93 Mt Co2e/acre/year for reforestation on
 agricultural lands

Methods: Values were derived from the FIA plot database for forests between 50-100 years old for MN, ND and SD
accessed through the Evalidator tool 87 and GTR343. 88 GTR343 provides regional carbon estimates for forest type group
for the continental United States. Data were accessed directly through Evalidator as the regional estimates indicated
significantly higher rates for North and South Dakota than individual state data. The main issue with the North Dakota,
and South Dakota is the low sample size, with many cover types poorly represented. In contrast, Minnesota has a large
area of forest and double the sampling density compared with requirements. Therefore, there are sufficient plots to
calculate estimates for individual cover types.

For Minnesota’s Northern Temperate-Southern Boreal Forests, the Reforestation estimates for high, medium, and low,
respectively are as follows: Red pine-white pine, oak-hickory, and spruce-fir. Aspen-birch also fits in the medium category.

Within North and South Dakota, the estimates for high, medium, and low, respectively are as follows: oak-hickory (SD)
forest on timberland (ND) and ponderosa pine (SD).

The sequestration values represent the rate of carbon accumulated over a specified time period. For example, the rate for
red pine-white pine is calculated as follows:

 , 2 − , 2
 Rate: = , where , 1 = Carbon at year 120 and , 2 = Carbon at year 10

 55.27 ∗ (228.2 − 55.27) 2
 , 1 = 228.2 2 − , 2 = = 1.57 2 /
 (120 − 10)
 = 1.57 2 /

 E.g., To estimate total Carbon at year 41: = 55.27 + (1.57 *40) = 118.6 MtCO2e/acre/year.
 27
Alley Cropping Methods: For the purposes of NCS in Minnesota, North Dakota and South Dakota, we consider alley
cropping to be a subset of reforestation defined as carbon sequestration gained by planting wide rows of trees with a
companion crop grown in the alleys between the rows.

 High sequestration rate: The US State Carbon Mapper tool on Nature4Climate (based on Fargione et al. 2018)
 was used to calculate annual sequestration rates for the Alley Cropping practice. 89 This straight-forward
 calculation involved dividing the millions of Mt CO2e per year benefit by millions of acres identified in Fargione et
 al. (2018) as available for the practice. This was calculated at the state level with equivalent results for
 Minnesota, North Dakota, and South Dakota when rounded to the second decimal. (2.15 Mt CO2e/acre/year)

 Low sequestration rate: We adopted the sequestration rate from Biardeau et al. (2016). 90
 (1.7 Mt CO2e /acre/year)

 Medium sequestration rate: The medium value was taken as the midpoint between the high and low values
 identified from the literature. (1.93 Mt CO2e /acre/year)

Riparian Forest Buffers
 Sequestration Rate: 4.00 Mt CO2e/acre/year

Methods: A range of values for riparian forest buffers was obtained from agency reports, online tools and published
literature.

High sequestration rate: A sequestration rate was adopted from the Minnesota Board of Water and Soil Resources as
derived from Anderson et al. (2008). 91 (5.5 Mt CO2e/acre/year)

Low sequestration rate: The sequestration rate from Biardeau et al. (2016) was adopted. 92 (2.50 Mt CO2e /acre/year)

Medium sequestration rate: The medium value was taken as the midpoint between the high and low values identified
from the literature. (4.00 Mt CO2e /acre/year)

Wetland Restoration (non-peat)
 Sequestration Rate: 3.70 Mt CO2e/acre/year

Methods: Restoration is assumed to be implemented on land now in a drained, farmed condition. Values were derived
from the scientific literature, agency reports, and tools, converting to standard units of Mt CO2e/acre as required.

High sequestration rate: The high value was obtained directly from BWSR (2009) (as derived from Anderson et al.
2008), which is consistent with Euliss et al. 2006 (originally presented as 305 g C/m2). 93,94,95 (4.5 Mt CO2e/acre/year)

Low sequestration rate: The low value was adopted from Lennon (2008) (originally presented as 195 g/m2). 96
(2.9 Mt CO2e/acre/year)

Medium sequestration rate: The medium value was taken as the midpoint between the high and low values identified
from the literature. (3.70 Mt CO2e/acre/year)

 28
You can also read