Nature and the City Policies to enhance access to nature in cities William Nicolle Foreword by Tony Juniper CBE - Policy Exchange
←
→
Page content transcription
If your browser does not render page correctly, please read the page content below
Nature and the City Policies to enhance access to nature in cities William Nicolle Foreword by Tony Juniper CBE

Nature and the
City
Policies to enhance access to nature in
cities
William Nicolle
Foreword by Tony Juniper CBE

Policy Exchange is the UK’s leading think tank. We are an independent, non-partisan educational charity whose mission is to develop
and promote new policy ideas that will deliver better public services, a stronger society and a more dynamic economy.

Policy Exchange is committed to an evidence-based approach to policy development and retains copyright and full editorial control
over all its written research. We work in partnership with academics and other experts and commission major studies involving
thorough empirical research of alternative policy outcomes. We believe that the policy experience of other countries offers important
lessons for government in the UK. We also believe that government has much to learn from business and the voluntary sector.

Registered charity no: 1096300.

Trustees
Alexander Downer, Pamela Dow, Andrew Feldman, David Harding, Patricia Hodgson, Greta Jones, Andrew Law, Charlotte Metcalf,
David Ord, Roger Orf, Andrew Roberts, Robert Rosenkranz, William Salomon, Peter Wall, Simon Wolfson, Nigel Wright.
Nature and the City

                                About the Author

                                William Nicolle was a Research Fellow in the Energy and Environment
                                Unit between 2019 and 2021. Before joining Policy Exchange, William
                                worked as a Graduate Analyst for Centrica and at another London-based
                                think tank. He has a BA in Geography from the University of Oxford, and
                                he is working towards an MSc in Environmental Policy and Regulation
                                from the London School of Economics.

4   |   policyexchange.org.uk
Acknowledgements

Acknowledgements

Policy Exchange would like to thank Ben Goldsmith for his generous
support for this project.
   The author would like to thank the many companies and stakeholders
who provided input and views to this report, including Sam Hall, James
Cullimore, Benjamin Brown, and Theo Plowman, as well as those who
wished to remain anonymous. The author would also like to thank James
Allan for reviewing a draft of this report.
   This report was produced by Policy Exchange and the views and the
recommendations in the report are those of Policy Exchange.

© Policy Exchange 2021
Published by
Policy Exchange, 8 – 10 Great George Street, Westminster, London SW1P 3AE

www.policyexchange.org.uk

ISBN: 978-1-913459-78-9

                                                                            policyexchange.org.uk   |   5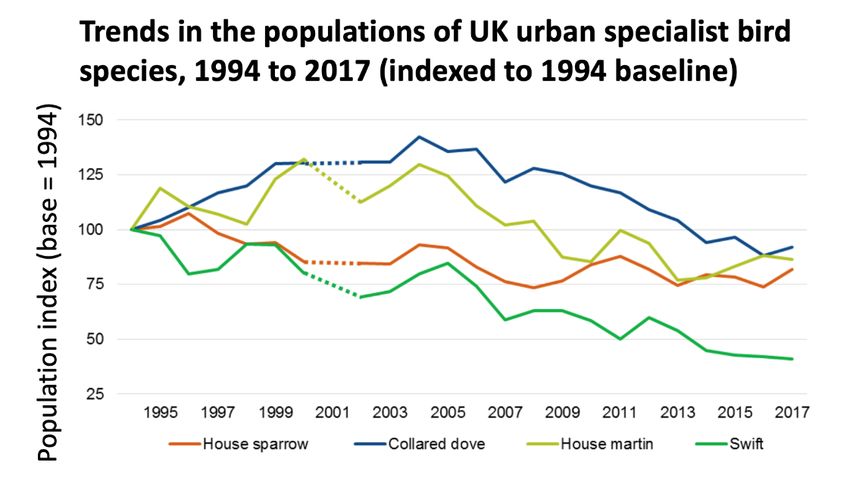
Nature and the City

                                About the Policy Exchange
                                Energy and Environment Unit

                                Policy Exchange’s award-winning Energy & Environment unit examines
                                the issues and challenges in achieving a sustainable economy whilst
                                promoting prosperity and democratic values. The unit’s recent work
                                includes:

                                   •   Beyond the Energy Crisis (December 2021), which argues for banking-
                                       style “stress tests” on energy suppliers and an increased focus on
                                       “smart electricity tariffs” to reduce energy bills and cut emissions.
                                   •   Unleashing Climate Capital (October 2021), the second edition of
                                       Policy Exchange’s energy and environment journal, Environmental
                                       Affairs.
                                   •   Crossed Wires: Maintaining public support for offshore wind farms (July 2021),
                                       which proposes measures to maintain public support for offshore
                                       wind farms, including enhanced coordination between projects to
                                       share infrastructure and compensation for affected communities.
                                   •   Beyond COP26: The UK’s Green USPs (June 2021), which argues that
                                       the UK must harness its ‘Green Unique Selling Points’ to boost
                                       jobs at home and environmental progress around the world.
                                   •   The Geopolitics of Climate Change (April 2021), the first edition of Policy
                                       Exchange’s new quarterly journal, Environmental Affairs.
                                   •   Capital Shift (March 2021), which argues that the UK should use its
                                       presidencies of COP26 and the G7 to green the financial system.
                                   •   Charging Up (February 2021), which sets out a new approach to
                                       ensure a comprehensive and high-quality national network of
                                       public chargepoints for electric vehicles.
                                   •   Powering Net Zero (December 2020), which proposes local electricity
                                       pricing as the key to delivering a Net Zero energy system.
                                   •   The Future of the North Sea (November 2020), which proposes a
                                       comprehensive strategy to maximise the contribution of the North
                                       Sea to Net Zero and Levelling Up.
                                   •   The Future of UK-EU Energy Cooperation (September 2020), which
                                       proposes policies to strengthen future UK-EU energy and climate
                                       cooperation in the Future Relationship.
                                   •   Route ’35 (July 2020), which argues for a California-style ‘ZEV
                                       mandate’ to deliver the phase-out of petrol and diesel cars.

6   |   policyexchange.org.uk
About the Policy Exchange Energy and Environment Unit
• Outbreaks and Spillovers (May 2020), exploring the origins of zoonotic
diseases such as COVID-19 in ecological disruption.
• Bigger, Better Forests (November 2019), on policies needed to increase
tree planting in the UK.
• Modernising the UK (August 2019), which proposes a series of
measures to update UK infrastructure and institutions.
• Fuelling the Future (September 2018), examining the options for a
hydrogen-based economy.
• The Future of Carbon Pricing (July 2018), setting out the need for an
economy-wide carbon price and border carbon adjustments.
• Small Modular Reactors (January 2018), exploring the potential role of
SMRs in the UK energy mix.
• Farming Tomorrow (August 2017), calling for a new post-Brexit
agricultural policy that places environmental services and
productivity at the heart of British farming.
policyexchange.org.uk | 7Nature and the City
The Unit has four specialists, actively supported by Policy Exchange’s team of
in-house economists and policy specialists, as well as a network of experts in
industry, government, academia and beyond.
Ed Birkett, Head of Energy and Environment
Ed leads Policy Exchange’s Energy and Environment Unit. Ed joined Policy
Exchange in 2020 after spending a year at Harvard as a Kennedy Scholar. For
the previous five years, he worked in the UK energy sector, most recently as a
developer of large-scale solar and energy storage projects. Ed has an MEng in
Engineering Science from the University of Oxford.
Josh Buckland, Senior Fellow, Energy & Environment
Josh is a Senior Fellow with Policy Exchange’s Energy & Environment unit. Josh
was previously Energy Advisor to the Secretary of State for Business, Energy and
Industrial Strategy. In this role he provided expert policy and strategic advice
to both Greg Clark and subsequently Andrea Leadsom on all major energy and
climate issues. Josh spent two months working as a senior advisor within the
COP26 Unit. Previously he held a number of other senior roles at the centre of
Government, including spending three years in the Prime Minister’s Policy Unit
in No10 Downing Street working on energy and environment issues. He was also
Head of the Energy Policy team in HM Treasury.
Dr Ben Caldecott, Senior Fellow, Energy & Environment
Ben is a Senior Fellow with Policy Exchange’s Energy & Environment unit. Ben
is the founding Director of the Oxford Sustainable Finance Programme at the
University of Oxford Smith School of Enterprise and the Environment. At the
University of Oxford, he is the inaugural Lombard Odier Associate Professor and
Senior Research Fellow of Sustainable Finance, the first ever endowed professorship
of sustainable finance, and a Supernumerary Fellow at Oriel College. Ben is also
the founding Director and Principal Investigator of the UK Centre for Greening
Finance & Investment (CGFI), established by UK Research and Innovation in
2021 as the national centre to accelerate the adoption and use of climate and
environmental data and analytics by financial institutions internationally. Ben
specialises in environment, energy, and sustainability issues and works at the
intersection between finance, public policy, and academe, having held senior
roles in each domain. Among his previous roles, he was Research Director for
Energy and Environment at Policy Exchange between 2008 and 2009.
Benedict McAleenan, Senior Fellow
Benedict McAleenan is a Senior Fellow in Policy Exchange’s Energy & Environment
Unit. Benedict is the Founder and Managing Partner of the strategy consultancy
Helmsley Partners. He is a public policy adviser with 14 years’ experience in
policy development, political risk and thought leadership in the Energy, FMCG,
Property, Manufacturing and Engineering sectors. Benedict has advised clients
including National Grid, Centrica Energy, the Renewable Energy Association,
Madison Square Garden Company, OVO Energy, Shell, Sainsbury’s and Balfour
Beatty.
8 | policyexchange.org.ukContents
Contents
About the Author 4
Acknowledgements 5
About the Policy Exchange Energy and Environment Unit 6
Foreword 11
Executive Summary 13
What is access to nature? 13
Current trends 16
Current window of opportunity 18
Policy recommendations 19
Introduction 21
1. Access to nature 23
What is access to nature? 23
Why is access to nature valuable? 24
2. Current trends 32
Quantity 32
Quality 35
Effects of the current pandemic 38
Why is access to nature falling in urban areas? 43
3. Current opportunity 46
4. Policy recommendations 49
5. Conclusion 74
policyexchange.org.uk | 9Nature and the City
Foreword
By Tony Juniper CBE
Ever since the first conservation pioneers set out to protect the natural
world more than a century ago, the emphasis in most efforts to halt the loss
of wildlife and wild spaces has been in rural areas, wilderness and those
places that had avoided the worst impacts of human pressures. During
the 1980s, however, some conservation leaders began to initiate urban
wildlife projects, blazing a trail that today brings us to a new realization
that steps to achieve Nature recovery must not only embrace work to
sustain the rare and remote, but also the familiar and nearby, including
where most of us live: in towns and cities.
The reasons for this are several-fold. One is the founding motivation for
conservation action, for Nature itself, and predicated on the fact that some
species are dependent on effective action in urban areas, such as House
Sparrows, Swifts and Hedgehogs, all of which have declined significantly,
and all of which need to do well in towns and cities to do well overall.
Another is for the benefits that accrue to people through access to wildlife-
rich natural areas. A vast body of evidence reveals how time outside in
green spaces is beneficial for both physical and psychological health, and
that this effect is disproportionately positive among socially disadvantaged
groups.
On top of this are other benefits that can be derived from more natural
areas in urban environments, including how design for sustainable
drainage, such as natural wetlands and lakes, can reduce flood risk and the
effect of trees in ameliorating the urban heat island effect, both of which
are being exacerbated by climate change. Blending this kind of green
and blue infrastructure into the urban fabric can bring wider economic
upsides too, for example encouraging inward investment and enhancing
property values.
Intelligent design can combine all three of these broad values – for
wildlife, public health and practical and economic benefit, so long as
integrated approaches are taken. And this is where the biggest challenge to
my mind lies, in finding the ways to combine new housing, infrastructure
and industrial capability with the recovery of Nature, while also doing
that in the existing built environments, for example through enhancing
green corridors by rivers and canals, creating wilder areas in parks, and
harnessing the vast area of urban gardens to grow and sustain wildlife
populations.
Fortunately, we have some potentially powerful avenues along which
to pursue this work. These include the goal in the Government’s 25
Year Environment Plan to establish a Nature Recovery Network, creating
10 | policyexchange.org.ukContents
habitats and connecting up wildlife-rich places. This will in turn in large
part be facilitated through the Local Nature Recovery Strategies, and a new
spatial planning framework mandated through the 2021 Environment
Act. It is to be hoped that any reforms to the planning system that follow
recent consultation will be firmly combined with these ambitions, to
the point where they are one and the same thing, with the recovery of
Nature being planned as part of wider future urban future, rather than an
afterthought, or worse still being seen as a ‘green issue’ that gets in the
way of development.
There is much to be gained if we can get this right: urban environments
that are healthy and resilient, attractive and diverse, great places to live
and work, the kind of places that people wish to spend time and bring
up families. Glimpses of what can be done can be seen across England,
Europe and the World, and now the task is to cement a vision and to
reflect that in policy and practice.
As we plan responses to the combined Nature and climate change
emergencies, I very much hope this Policy Exchange report will inspire
the kind of reflection and action fit for our times, leading to outcomes that
benefit both people and wildlife.
Tony Juniper CBE is the Chair of Natural England.
policyexchange.org.uk | 11Nature and the City
Executive Summary
As part of the 25 Year Environment Plan, the Government’s long-term
strategy for improving the environment in England, DEFRA is creating
a suite of 66 metrics to monitor progress against its goals. One of these
goals is focused on improving access to nature: “making sure that there
are high quality, accessible, natural spaces close to where people live and
work, particularly in urban areas”.1
Nearly four years on from the publication of the 25 Year Environment
Plan, DEFRA is yet to finalise all of its metrics for tracking access to nature.2
At the same time, a window of opportunity has opened for policy to
drive urban greening through the Government’s generational reforms to
England’s environmental and planning policy frameworks. This report
sets out the case for enhancing access to nature in and around urban
areas in England, presenting a series of credible policy ideas to reverse
the decline of greenspace in England’s towns and cities and realise the 25
Year Environment Plan’s ambitions to ensure everyone can engage with
nature near to where they live.
What is access to nature?
Access to nature is defined in a wide range of ways; some studies focus
on the subjective elements of interacting with nature, based on polling
data of people’s experiences, while others use one or a set of quantitative
metrics to measure access, such as the average walking distance to a park.
Broadly, there are two sides to the “access to nature” coin:
• Quantity, referring to how easily people can interact with nature.
This is typically expressed through several different quantitative
metrics focused on people’s contact with or exposure to nature.
The most common metric used is walking distance to green
1. HM Gov (2018). A Green Future: Our 25 Year
Plan to Improve the Environment. Page 28
space, which provides an idea of how easily people can access
(Link); see DEFRA (June 2021). Outcome greenspace. Another common metric is the number of people
Indicator Framework for the 25 Year Environ-
ment Plan: June 2021 Update: Enhancement of per area of green space in an area, providing an idea of the
Green/Blue Infrastructure: Readiness and links
to data. Pages 120 – 121 (Link, Link). demands on a local greenspace. Dense urban areas tend to perform
2. DEFRA recently published an interactive worse on these metrics, due to low levels of publicly accessible
Outcome Indicator Framework in October
2021 as part of the 25 Year Environment greenspace compared to the number of people accessing them.
Plan (Link). Some of the indicators are fi-
nalised, whereas others in “interim” or “in
A recent Friends of the Earth study defined access to nature based
development”. on a graded system of how long residents had to walk to access at
3. Friends of the Earth (2020). England’s green
space gap. Page 8 [note: this is the page of the
least two hectares (Ha) of open green space, which is the standard
PDF, as no page numbers are included in the recommended by Natural England.3
report] (Link); Note: Friends of the Earth ac-
knowledge in their report that their analysis
does not reflect the quality of green space
owing to data limitations.
12 | policyexchange.org.ukExecutive Summary
• Quality, referring to the value of people’s subjective enjoyment of
interacting with nature, defined by things like emotional connection
to nature and how nature contributes to a sense of place. Due to
its subjective nature, evidence for the quality of access tends to be
captured through surveys of the public’s self-reported interaction
with nature. Our research finds that high quality interactions with
nature depend on two things: the condition of greenspace, which
is a measure of how valuable existing greenspace is to residents,
and ecological quality. Metrics that track ecological quality tend
to use the general biological diversity and habitat quality of an
area as a proxy for the value of nature. Natural England’s “Monitor
of Engagement with the Natural Environment” is based on the concept of
‘nature connectedness’ which is comprised of five ‘pathways’
to nature: contact (e.g. visit frequency), emotion, compassion,
meaning and beauty.4
Enhancing access to nature is therefore about enhancing the quantity and
quality of natural infrastructure (Box 1) by making it easy for people to
interact with nature close to where they live and to maximise the value of
these interactions by ensuring urban natures meet people’s needs.
Box 1: What is ‘natural infrastructure’?
Natural infrastructure is an umbrella term that refers to planned networks of
green and blue features in urban areas that make up part of the urban fabric.
They tend to include a mixture of vegetation (green), water (blue), and manmade
materials like concrete. They are commonly described as ‘multifunctional’
because they are included in development projects for their multiple purposes,
such as providing recreational/cultural value as well as benefitting wildlife.
Other names for natural infrastructure include green/blue infrastructure,
nature-based solutions and natural capital.
Green natural infrastructure includes green roofs and walls, grassed areas
in parks, and street trees. Blue natural infrastructure can include ponds,
fountains, and drainage systems. Some natural infrastructure includes blue and
green elements, such as sustainable drainage systems (SuDS), which use green
vegetation to manage water quantity (flooding) and quality (pollution).
Natural infrastructure is included in projects because it provides a range of
benefits that non-natural infrastructure (e.g. buildings made out of concrete)
cannot provide. These are often referred to as ‘ecosystem services’, and the
value of these services is determined by the quantity and quality of natural
infrastructure. The services natural infrastructure provides are highest where
the specific benefits that a piece of natural infrastructure provides are matched
to demand. For instance, including high quality, biodiverse SuDS in flood-prone
urban areas maximises the benefits SuDS provides.
The value of enhancing access to nature can be usefully categorised
Natural England (2020). A summary report on
into benefits for society and benefits for nature (Table 1 and Table 2). 4.
nature connectedness among adults and chil-
Fundamentally, natural infrastructure in urban areas needs to meet the dren in England. Page 7 (Link); Ryan Lumber
et al (2017). Beyond knowing nature: Contact,
needs of residents to benefit society, because competition for land in emotion, compassion, meaning and beauty are
the pathways to nature connection. PloS One,
12(5) (Link).
policyexchange.org.uk | 13Nature and the City
urban areas is high. This means that natural infrastructure is not necessarily
just installed to benefit nature, unlike in rural areas where there is more
space and lower opportunity cost to make space for nature. Yet, there
are clear additional benefits for nature through including more natural
infrastructure in urban areas, primarily through creating more habitat in
urban areas where existing habitat baselines are low.
Table 1. The value of enhancing access to nature: Benefits for
society.
Benefit Description
Survey evidence suggests that mental health benefits significant
mental health benefits are gained after engaging with nature
Mental and
for at least 120 minutes. Interestingly, the results suggest it
physical health
does not matter how people interact with nature - either in one
improvements
120-minute block or sporadically throughout the week – or
what type of nature they interact with.
There is good evidence that well-managed communal gardens
Recreational, lead to measurably higher levels of neighbourliness and
social & cultural community awareness, at least in well-off areas.
Urban woodland makes up around 7.5% of all UK woodland,
absorbing 1.3 million tonnes of CO2 a year. A study based on four
neighbourhoods in Merseyside found that a neighbourhood with
Carbon storage
0.3% canopy cover stored around 0.5 tonnes of carbon dioxide
per hectare (t/CO2/Ha), but this rose to 17 t/CO2/Ha with just
over 10% canopy cover.
The number of people exposed to frequent flooding (1 flood
every 75 years) in urban areas throughout the UK is estimated
to rise from around 1.4 million today to between 2.3 – 3.1 million
Lowered flood by 2050. Sustainable Urban Drainage Systems (SuDS) can
risk reduce flood risk. In England, SuDS schemes are around 5% of
development area, and a recent study in London conservatively
estimated that for every £1 invested in SuDS on a borough level,
£3.80 worth of flooding-related benefits are created.
There is a small chance that some urban areas may experience
temperature extremes above 40oC by 2040. A study estimated
that in Manchester increasing the cover of green natural
infrastructure to 10% could result in temperature reductions
Heat mitigation
of 2.5oC under a high emissions scenario. The ONS estimates
that the benefits of green natural infrastructure across 11 city
regions in the UK leads to £300 million in benefits, stemming
from avoided productivity losses and reduced cooling costs.
Source: Policy Exchange analysis
14 | policyexchange.org.ukExecutive Summary
Table 2. The value of enhancing access to nature: Benefits for
nature.
Benefit Description
Natural infrastructure can create habitat in underutilised spaces,
such as on walls, roofs or roadsides. This uses urban space efficiently,
More
creating more space for nature without detracting from the amount
habitat
of urban space which society uses for itself for infrastructure, roads,
shops, houses and more.
Large parks are unlikely to be included in dense urban areas, given the
high competition for land, but pockets of publicly accessible greenspace
are commonly created as part of developments in dense urban areas
Bigger under Section 106 agreements, which are conditions local authorities
habitat attach to planning consents. These create bigger spaces for nature,
complementing smaller slices of natural infrastructure like green
walls which provide as much habitat for nature as possible without
detracting from urbanisation.
High densities of people and some economic activities create fluxes
of pollution, putting pressures on urban habitat quality and wildlife.
Better
Creating better spaces for nature involves managing existing natural
habitat
infrastructure sensitively, while ensuring it still delivers its function.
England’s natural environment is increasingly fragmented, which
can at the extremes reduce biodiversity levels by 75%. Connectivity
can be promoted in urban environments via coordinating natural
Joined up infrastructure. Recent ideas include lining streets with trees to create
habitat ‘green corridors’ and creating centralised databases of city-wide
natural infrastructure. The idea is to join existing habitats with new
ones, and allowing wildlife to move more easily throughout towns and
cities.
Source: Policy Exchange analysis
Current trends
Despite the benefits of having higher levels of access to natural
infrastructure, our research suggests that access to nature is deteriorating
in terms of quantity and quality.
In terms of quantity, the clearest analysis of trends in urban greenspace
over time was undertaken by environmental research consultancy ADAS
for the Climate Change Committee. They estimate that greenspace has
declined in England’s urban areas from 63% in 2001 to 55% in 2018.5
Most other analyses using measures that focus on the quantitative aspects
of access to nature are difficult to compare because they use different
methodologies. For example, different analyses may use unlike definitions
of what is urban and what counts as natural infrastructure. However, most
analyses tend to show a downward trend in access to nature over time.
The distribution of existing greenspace is also important to consider.
Natural infrastructure is most valuable when the most people benefit from
5. Charles Ffoulkes et al (2019). Research to
its services, which is why groups of analyses measure access to nature by update the evidence base for indicators of cli-
mate-related risks and actions in England, Page
looking at people’s proximity to greenspace. For instance, the average 13 (Link); Note: the authors also include the
walking distance to a public greenspace in London (400m) is at least results for an updated method for mapping
urban green space. This is excluded here
three times shorter than in the urban areas of the South West, the East of because it only includes data for 2016 and
2018, but the trends are likely to be the
same.
policyexchange.org.uk | 15Nature and the City
England and the East Midlands. London’s urban greenspaces on average
serve 40% more people than the urban greenspace in England, which
equates to around 7,000 more people per urban greenspace. Notably,
access to private gardens is also the lowest in London, with over double
the proportion of households in London lacking access to private gardens
than the average for Great Britain (25% vs. 12%).6
Indeed, proximity to greenspace is important because most people’s
engagements with nature occur locally: According to Natural England, in
2019, 44% of all engagements with nature in England happened within 2
miles of the home, with over two thirds of these trips occurring within 1
mile of the home.7
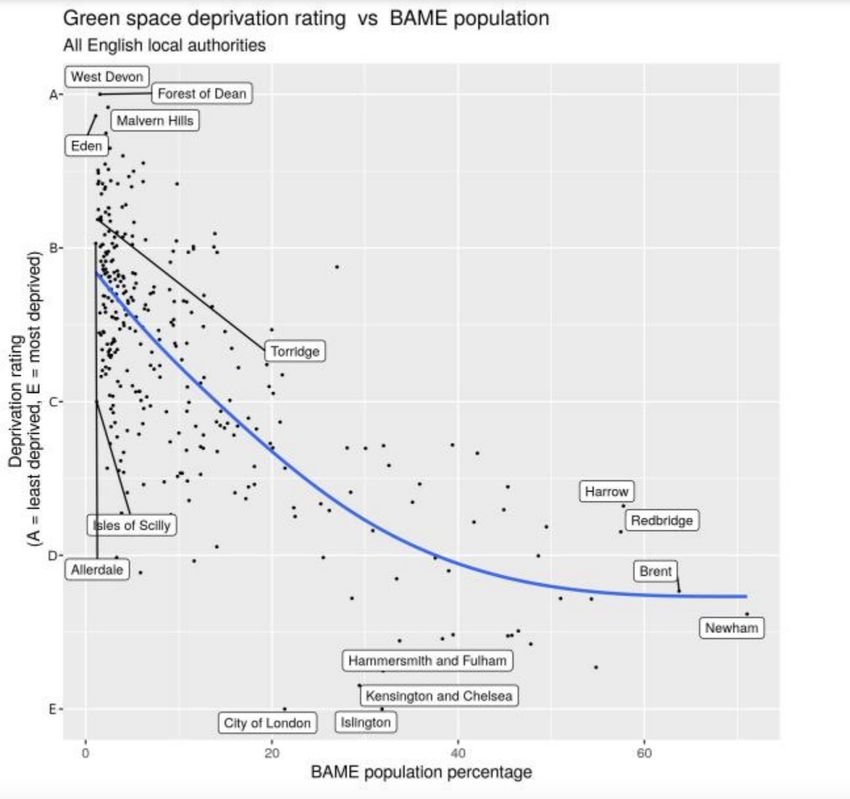
Access to nature has been shown by multiple studies to vary by measures
of deprivation, ethnicity and income. These differences are likely to be
driven by multiple factors. For instance, if ethnic minorities are likely to
be younger, and live in denser urban areas like inner London, as well as be
in lower socioeconomic groups, then the association above is clearly more
complicated than the two factors alone suggest.8
In terms of quality, higher levels of biodiversity and wildlife are
generally reported as increasing the quality of peoples’ interactions with
nature. For instance, in Natural England’s long-running survey, Monitor
of Engagement with the Natural Environment, ‘wildlife watching’ received the
most positive results out of all the interactions people had with nature,
including running, eating out and playing with children.9
However, existing evidence suggests that many urban species are
not thriving. For instance, urban specialists, which are species that do
particularly well in the built environment, are good indicators of general
urban biodiversity levels. Urban specialist birds are a particularly good
indicator here, because good quality and long-term datasets exist on
their populations and lots is known about their ecology and the pressures
facing them.10 Since 1994, a number of these species have experienced
declines in biodiversity of at least 15%.11 Swift populations have declined
by almost 60%.
Some iconic species are particularly useful for enhancing access to
6. ONS (2020). One in eight British households nature because people tend to value them more than other species. Many of
has no garden (Link); Note: The ONS’ data on
access to private gardens is not readily avail-
these ‘charismatic’ species are declining in urban areas, such as hedgehogs
able for only urban areas. and grey squirrels which have falls in their abundances of around 25% and
7. Natural England (2020). People’s engagement
with nature: summary storyboard: ‘on our door-
10% respectively since the early 2000s. Notably, other urban species are
step’ (Link). enjoying population growth, such as badgers and roe deer.
8. ONE (2020). Access to garden space: England
(Link) Insects are an important component of urban wildlife, helping to
9. Natural England (2019). Monitor of engage- sustain plant life and acting as a food source for other wildlife. There is
ment with the Natural Environment – The na-
tional survey on people and the natural environ- little evidence on the general trends in urban insect populations, although
ment: Headline report 2019. Page 14, Figure
15 (Link).
a government indicator of pollinator observations within in 1km grid
10. Environment Agency, Chief Scientist’s Group squares throughout the UK shows that pollinators were recorded in 30%
(2021). The state of the environment: the urban
environment. Page 10 – 11 (Link).
fewer grid squares times between 1980 and 2017.12
11. Environment Agency, Chief Scientist’s Group Improving the quality of river water in England is also a key way to
(2021). The state of the environment: the urban
environment. Page 11 (Link). improve access to nature, but progress has flatlined over the last decade. The
12. Joint Nature Conservation Committee levels of some pollutants have notably reduced; for instance, since 1995,
(2020). UK Biodiversity Indicators 2020: Indi-
cator D1c (Link).
16 | policyexchange.org.ukExecutive Summary
ammonia levels have fallen 70%, and health-harming metals like copper,
lead, cadmium and mercury have all been reduced, the last two by 50%
since 2008.13 However, only 16% of England’s rivers meet the EU’s Water
Framework Directive’s label of ‘good ecological status’, a test decided by
11 different descriptors. Indeed, pollution levels are rising according to
other metrics, notably for nitrogen (primarily from agricultural fertiliser
use) and sewerage spill incidents.14
As part of this report, we commissioned a poll of the UK public to
explore how people’s engagement with nature has changed over the
recent lockdowns, and their views on the future of urban greening.
Our polling found three main trends (Figure 1).
Figure 1. Main trends in our polling.
Source: Policy Exchange analysis of polling results.
Current window of opportunity
As we recover from COVID-19, there is a unique political and policy
opportunity to implement ambitious reforms to green England’s urban
areas.
Politically, the impact of COVID-19 has increased support for greening
urban areas. Our polling suggests this self-reported growth in support for
urban nature is driven by consecutive lockdowns, which deprived people
of regular interaction with nature, especially the 12% of households in
Britain that lack access to a garden.15
A unique policy opportunity is opening up to reverse the decline
in England’s urban greenspace through the Government’s reforms to
England’s planning and environmental frameworks. Urban greening sits 13. Sir James Bevan (2020). The state of our wa-
ters: the facts (Link).
between the planning and environmental policy: the planning system 14. DEFRA (2021). Latest water classifications
results published (Link); Rob England (2021).
drives how urban areas develop through plans, design guides and Water pollution causing ‘death by a thousand
consents, while environmental policies and regulations shape this process cuts’ for rivers’. BBC News (Link).
15. ONS (2020). One in eight British households
has no garden (Link).
policyexchange.org.uk | 17Nature and the City
to ensure it promotes greening via tools like protecting threatened species
and habitats. The confluence of major reforms in both areas - ongoing
planning reforms and the recently-passed Environment Act 2021 - creates
a rare opportunity to ensure future urbanisation promotes greater access
to nature.16
However, by themselves, both programs of reform are likely to have
limited impacts on access to nature in urban areas. Many of the Government’s
policies are incentive-based, such as grants for environmentally-beneficial
activities like tree planting. While these can be important as part of a
suite of policies for improving access to the environment, they tend to
lack certainty and act as substitutes for more concrete actions rooted
in regulation. In fairness, the Government is putting some policies on
a statutory footing, notably biodiversity net gain and Nature Recovery
Networks, but both these policies show limited potential for enhancing
biodiversity in urban areas themselves, instead incentivising improvements
outside of towns and cities where access to nature is naturally higher.
There is therefore a risk that urban areas fall through the cracks in the
Government’s reforms. Given the combination of strong public support
for urban greening and the confluence of reforms to England’s planning
and environmental frameworks, there is a clear window for plugging
these gaps during this Parliament.
Policy recommendations
Our recommendations are informed by the three principles (Figure 2),
which blend the Lawton Review’s emphasis on improving outcomes for
wildlife with the idea that urban natural infrastructure should be designed
around the needs of society.
Figure 2. Recommended policy principles for enhancing access to
nature.
16. On 10th November 2021 the Environment
Act became law (Link).
18 | policyexchange.org.ukExecutive Summary
Our recommendations fall into five themes:
Theme #1: Where access to nature is low, mandate Local Authorities
to improve it.
Recommendation 1.1: Where access to nature is low, mandate Local
Authorities to adopt Urban Greening Factors through the National
Planning Policy Framework.
Theme #2: Strengthen the role of nature in urban design:
Recommendation 2.1: The Government should strengthen the National
Model Design Code to strengthen the role of nature in Local Design Guides.
Recommendation 2.2: The Government should begin a blitz behavioural
campaign to encourage people in urban areas to green private property.
Theme #3: DEFRA should take an explicit lead driving Local
Authority-led urban greening:
Recommendation 3.1: Produce statutory guidance for Local Authorities
on how to manage public land to promote urban greening.
Recommendation 3.2: Establish a league table of Urban Greening and an
associated place-based accreditation scheme for Nature Recovery Cities.
Theme #4: Where appropriate, Local Authorities should provide
communities with more autonomy over local public land.
Recommendation 4.1: Where appropriate, Local Authorities should
provide communities with more autonomy over local public land.
Theme #5: Government should initiate quick wins now to ensure
that the post-COVID recovery is as green as possible:
Recommendation 5.1: Mandate swift and bee bricks in all suitable new
build residential homes in England.
Recommendation 5.2: All Local Authorities should introduce a ‘green flat
roof obligation’ in urban areas.
Recommendation 5.3: Mandate Local Authorities to adopt canopy cover
targets.
Recommendation 5.4: Ringfence 5% of Stamp Duty Land Tax (SLDT) for
investment in local urban greening.
Recommendation 5.5: Introduce ‘Wildbelts’ as a land use category.
Recommendation 5.6: Kick start rewilding in National Parks via
strengthened National Park Management Plans.
policyexchange.org.uk | 19Nature and the City
Introduction
“If we concentrate our attention solely upon the city, seeing in it the ultimate
symbol of “man’s” conquest of “nature”, we miss the extent to which the city’s
inhabitants continue to rely as much on the nonhuman world as they do on
each other”
Environmental historian William Cronon in Nature’s Metropolis:
Chicago and the Great West (1991)
Chicago is one of Midwestern America’s most expansive cities, covering
around a third of the built-up area of Greater London.17 As the historian
William Cronon traces, Chicago’s expansion from a small settler town in
the late 18th Century to its modern-day form was only possible thanks to its
relationship with nature. Its thriving grain, lumber and timber industries
and accessible geography allowed settlers to transform what Cronon
calls ‘first natures’ – the pristine, untouched environment, ranging from
primary forests to large wildlife – into economic growth, fuelling the
cities expansion.
Modern Chicago is becoming less visibly ‘natural’ as it densifies, but its
growth as a city is still equally driven by ecological processes. Although
pristine forests have long disappeared around the central districts of
Chicago, Cronon argues its growth is still fuelled by distant ‘first natures’
through trade, which link it to distant countryside. The city’s development
is also increasingly dependent human-created environments within the
city boundaries, such as parks, waterways, verges and more. Cronon
terms these ‘second natures’, because they are less obviously ‘natural’
environments, yet they continue to act underpin the city. They perform a
different role to the first natures the colonisers used to grow Chicago, such
as by providing space for residents to unwind, rather than raw material to
be traded. Yet, as will be outlined in this report, these second natures are
nonetheless central to the functioning of the city’s economic, social and
cultural activities.
Cronon’s work is highly relevant to England’s modern urban areas, in
which natural habitats and wildlife are becoming a less common feature
of everyday life. Regardless of where they are geographically located,
thriving urban areas dependent on the natural world within and beyond
their boundaries. This report provides a series of policy ideas aimed at
enhancing access to nature in urban areas throughout England. The rest of
17. Chicago city area = 234 sq miles (2020) vs.
this section outlines what access to nature is and why it is important, and
London Built Up Area = 671 sq miles (2011); Section 2 outlines the current trends in access to nature. Section 3 outlines
United States Census Bureau (2020). 2019
US Gazetteer Files (Link); Office for National the current window of opportunity created by the Government’s once-
Statistics (2011). 2011 Census – Built-up Ar-
eas (Link).
20 | policyexchange.org.ukIntroduction
in-a-generation reforms to the country’s planning and environmental
frameworks. Finally, Section 4 outlines new policy ideas to act on this
opportunity, in turn fleshing out what ‘Building Back Better’ from the
COVID-19 pandemic could look like in practice. This report refers to
elements of the natural world that provide society with clear value as
‘natural infrastructure’.
policyexchange.org.uk | 21Nature and the City
1. Access to nature
What is access to nature?
A challenge for defining access to nature is the sheer breadth of definitions
used. Some analyses use a high level, more qualitative definition. For
instance, Natural England’s Monitor of Engagement with the Natural Environment is
based on the concept of ‘nature connectedness’ which is comprised of five
‘pathways’ to nature: contact (e.g. visit frequency), emotion, compassion,
meaning and beauty.18 Other analyses use one or more quantitative
metrics, based on how easily people can interact with nature, such as a
recent Friends of the Earth study which defined access to nature based on
whether urban residents were within five minutes’ walk from at least two
hectares (Ha) of open green space, the minimum standard recommended
by Natural England.19
As part of the Government’s 25 Year Environment Plan, DEFRA is creating
a suite of metrics to monitor progress towards the Plan’s goals. One of
the 25 Year Environment Plan’s goals specifically relates to access to nature:
“making sure that there are high quality, accessible, natural spaces close
to where people live and work, particularly in urban areas”.20 However,
some of the indicators to monitor this goal are still not finalised.21
Access to nature defies definition in a single metric, and it is therefore
best to understand it through broad ideas of quantity and quality:
• Quantity of access refers to how easily people can interact with
nature. This is typically expressed through several different
quantitative metrics focused on people’s contact with or exposure
to nature. The most common metric used is walking distance to
green space, which provides an idea of how easily people can
18. Natural England (2020). A summary report on
nature connectedness among adults and chil- access greenspace. Another common metric is the number of
dren in England. Page 7 (Link); Ryan Lumber
et al (2017). Beyond knowing nature: Contact,
people per area of green space in an area, providing an idea of the
emotion, compassion, meaning and beauty are demands on a local greenspace. Dense urban areas tend to perform
the pathways to nature connection. PloS One,
12(5) (Link). worse on these metrics, due to low levels of publicly accessible
19. Friends of the Earth (2020). England’s green
space gap. Page 8 [note: this is the page of the
greenspace compared to the number of people accessing them.
PDF, as no page numbers are included in the • Quality of access refers to the value of people’s subjective
report] (Link); Note: Friends of the Earth ac-
knowledge in their report that their analysis enjoyment of interacting with nature, defined by things like
does not reflect the quality of green space
owing to data limitations.
emotional connection to nature and how nature contributes to
20. HM Gov (2018). A Green Future: Our 25 Year a sense of place. Due to its subjective nature, evidence for the
Plan to Improve the Environment. Page 28
(Link).
quality of access tends to be captured through surveys of the
21. DEFRA (June 2021). Outcome Indicator public’s self-reported interaction with nature. Our research finds
Framework for the 25 Year Environment Plan:
June 2021 Update. that high quality interactions with nature depend on two things:
Pages 120 – 121 (Link).
22 | policyexchange.org.uk1. Access to nature
the condition of greenspace, which is a measure of how valuable
existing greenspace is to residents, and ecological quality, which
tend to use the general biological diversity and habitat quality
of an area as a proxy for the value of nature.. Indeed, several
different voluntary standards are attempting to define quality,
such as the Green Flag Award (a scheme for well managed parks),
Building with Nature (a set of green infrastructure standards for
development), and the Place Standard Tool (framework to assess
the physical and social aspects of place).22
Notably, what ‘good’ access to nature looks like tends to be locally
defined. For instance, green roofs and sky gardens may benefit those that
have physical access to them, but they provide limited amenity value to
pedestrians on the street. Further, natural infrastructure that provides
lots of value to residents on one street may be an entirely inappropriate
intervention on the next. While green walls can be pragmatic ways to
regreen dense highstreets, they are rarely the most efficient way to green
less dense residential areas.
Why is access to nature valuable?
This section outlines the benefits natural infrastructure provides urban
residents as well as urban areas, which can be usefully divided into
benefits for society and benefits for nature. Some forms of value stem
from people directly interacting with nature, such as the multiple benefits
that accessible parks create for residents/ Others forms of value are more
indirect, created as by-products of enhancing access to nature, such as
lowering flood risk through more vegetated surfaces. Our research
highlighted that maximising the value of natural infrastructure is highly
dependent on local circumstances; paying attention to what kinds of
natural infrastructure are locally suitable is important to ensuring the right
kind of natural infrastructure is invested in.
Benefits for society
Incorporating natural infrastructure into towns and cities provides a
number of important benefits for people. These benefits primarily accrue
residents, as the people that are exposed to natural infrastructure in
their local area on a daily basis. However, the benefits can be broader,
spilling over to those passing through and visiting places through natural
infrastructures contribution to quality place-making, as well as society at
large via its contributions to broader regional trends, such as enhancing
biodiversity and reducing catchment-scale flood risk. These benefits
include:
22. Public Health England (2020). Improving
access to greenspace: a new review for 2020.
#1: Mental and physical health improvements: There is a clear evidence Page 25 (Link).
23. Public Health England (2020). Improving ac-
base on the relationship between natural infrastructure and better physical cess to green space: A new review for 2020.
and mental health outcomes.23 Pages 21 – 23 (Link); Jules Pretty et al
(2016). Improving health and well-being in-
• Multiple meta-analyses find high levels of self-reported physical dependently of GDP: dividends of greener and
prosocial economies. Int. J. Environ Health
Res 26(1): 11 – 36 (Link).
policyexchange.org.uk | 23Nature and the City
health in greener areas, based on both the quality and quantity
of greenspace.24 Studies have found positive associations between
greenspace and physical conditions such as heart rate, blood
pressure, cholesterol levels, type 2 diabetes and birth weight.25
• In terms of mental health, people living in greener areas tend to
report that they have a much better state of mind, owing to lower
levels of stress and anxiety, and greater resilience to swings in
emotions.26 The mental benefits depend on someone’s age: in
children and young people, the benefits partly depend on a child’s
developmental state and the type and accessibility of greenspace;
in adults, additional factors like gender and exercise behaviours
also shape the mental health benefits of natural infrastructure.27
Analysis of Natural England’s long-running Monitor of Engagement
with the Natural Environment survey suggests that people experience
high levels of mental health benefits after at least 120 minutes of
engagement with nature a week. Interestingly, people reported
strong mental health benefits regardless of how they interacted
with nature - either in one 120-minute block or sporadically
throughout the week – or the type of nature they interacted with.28
This suggests that simply having more natural infrastructure
provides mental health benefits, regardless of what kind of natural
infrastructure it is.
• Many analyses also point to potentially large health cost savings
through greater access to greenspace through avoided illness. For
instance, Natural England has estimated that if everyone in the
24. Caoimhe Twohig-Bennett and Andy Jones UK had good access to greenspace, the NHS could save £2.1bn
(2018). The health benefits of the great out-
doors: a systematic review and meta-analysis
through more people walking.29 Notably, the exact level of
of greenspace exposure and health outcomes. savings is uncertain, given a lack of recent estimates, and there
Environ. Res., 166: 628 – 637 (Link).
25. Ibid, Caoimhe Twohig-Bennett and Andy
is high levels of uncertainty in the cause-effect assumptions at
Jones (2018). The health benefits of the great play, such as the amount of people that exercise more as a result
outdoors; Peter James et al (2015). A review
of the health benefits of greenness. Curr. Epi- of new greenspace. Notably, how much someone benefits varies
demi. Rep., 2(2): 131 – 142 (Link).
26. Michelle Kondo et al (2018). Urban green
substantially; for instance, for many health indicators, deprived
space and its impact on human health. Int. urban area and certain ethnic groups benefit the most from new
J. Environ. Res. Public. Health. 15(3): 445
(Link). natural infrastructure.30
27. Ibid, Lovell et al (2020). Rapid scoping review of
health and wellbeing. Page 27.
28. Mathew White et al (2019). Spending at least
#2: Recreational, cultural and social value:
120 minutes a week in nature is associated with • The recreational, cultural and social value of natural infrastructure
good health and wellbeing. Sci. Rep. 9, 7730
(Link). depends on sensitivity to place, integrating with local vernaculars
29. Natural England (2009). Natural England Tech-
nical Information Note TIN055: An estimate of
and meeting the needs of local residents. As the Building Better,
the economic and health value and cost effec- Building Beautiful Commission outlines, “green is good for us…
tiveness of the expanded WHI scheme 2009.
Table 7 (Link). but a strip of grass or a couple of trees cannot rescue a polluted,
30. Rebecca Lovell et al (2020). A rapid scoping ugly and profoundly inhumane place”.31 For instance, there is
review of health and wellbeing evidence for the
Framework of Green Infrastructure Standards: some evidence that in dense urban areas greenery placed little
1st Edition September 2020. Pages 9 – 11
(Link).
and often is the most popular approach to greening, while in
31. Building Better Building Beautiful Commis- other areas large parks are more suitable.32 Design is therefore
sion (2020). Living with beauty: Promoting
health, well-being and sustainable growth. integral to maximising the subjective elements of value that
Page 105 (Link). natural infrastructure provides. Indeed, ‘bad’ design can reduce
32. Nicholas Boys Smith (2016). Heart in the right
street.
24 | policyexchange.org.uk1. Access to nature
an effective sense of place, with studies showing that parks are
less valued when users feel unsafe through dark corners or hidden
spaces.33
• With the right combination of quality and quantity, natural
infrastructure can help facilitate community and place building.
For instance, there is good evidence that well-managed communal
gardens lead to measurably higher levels of neighbourliness and
community awareness, at least in well-off areas.34 Green spaces
enable social contact, reducing isolation. One Dutch study found
that urban areas with less greenery were associated with a higher
likelihood of people reporting they felt lonely and a perceived
shortage of lacking social support.35
#3: Carbon storage:
• The potential for nature-based carbon storage is much larger
in rural compared to urban areas, due to the availability and
lower competition for land. However, there are still important
opportunities to absorb carbon in urban areas, and the UK needs to
take advantage of all the opportunities for nature-based solutions
to meet its climate targets.36 Street trees are particularly important;
For instance, a study based on four neighbourhoods in Merseyside
found that one neighbourhood with 0.3% canopy cover stored
around 0.5 tonnes of carbon dioxide per hectare (t/CO2/Ha),
but this rose to 17 t/CO2/Ha with just over 10% canopy cover.
Over the whole UK, urban woodland made up around 7.5% of
all woodland in the UK in 2017, absorbing 1.3 million tonnes of
CO2 annually.37 33. Linde Van Hecke et al (2018). Public open
space characteristics influencing adolescents’
use and physical activity: A systematic review
#4: Lowering flood risk: of qualitative and quantitative studies. Health
Place, 51:158 – 173 (Link).
• Surface water flooding is expected to grow as climate change
34. Jamie Anderson (2015). “Living in a communal
progresses. For instance, the number of people exposed to frequent garden” associated with well-being while re-
ducing urban sprawl by 40%: a mixed-methods
flooding (1 flood every 75 years) in urban areas throughout the cross-sectional study. Public Health (Link).
UK is estimated to rise from around 1.4 million today to between 35. Terry Hartig et al. Nature and health. Annu-
al Review of Public Health, 35: 207 – 228
2.3 – 3.1 million by 2050, with an associated increase in the (Link).
flooding-related damages increasing from around £1.5bn today 36. William Nicolle (2021). Will history repeat
itself on negative emissions? Policy Exchange
to between £1.9 - £2.2bn by 2050.38 (Link).
• Natural infrastructure, such as water gardens and green roofs, is 37. Office for National Statistics (2019). UK natu-
ral capital accounts: urban accounts (Link).
an important tool for reducing flood risk across urban areas and 38. Paul Sayers et al (2020). Third UK Climate
catchments. Natural Infrastructure that is installed specifically for Change Risk Assessment (CCRA3) Future Flood
Risk: Main Report. Pages 61 – 62, Figures 7-7,
its flood reduction qualities is typically referred to as a Sustainable 7-8 and 7-9 (Link); ‘Urban areas’ here in-
cludes urban cities and towns, urban minor
Urban Drainage Systems (‘SuDS’). In England, SuDS schemes are conurbations and urban major conurbations.
around 5% of development area.39 Under the right conditions, a 39. Ibid, Sayers et al (2020). CCRA3 Future Flood
Risk: Main Report. P35, Table 6-1, and P41
green roof can intercept 100% of incident rainfall.40 Modelling (Link).
conducted as part of another study suggests that with 10% of all 40. Kathryn Brown and Ana Mijic (2019). Gran-
tham Institute Briefing paper no. 30: Integrat-
roofs greened, a 2.7% reduction in overall storm water runoff can ing green and blue spaces into our cities: Making
it happen. Page 7 (Link).
be achieved, as well as an average reduction in the rate of run-off
41. Jeroen Mentens et al (2006). Green roofs as
per building of 54%. 41 a tool for solving the rainwater runoff problem
in the urbanised 21st Century? Landscape and
Urban Planning, 77: 217 – 226 (Link).
policyexchange.org.uk | 25Nature and the City
• Notably, natural infrastructure is not a silver bullet for reducing
flood risk. In some areas, flooding risk is too high to rely on
green roofs alone, and hard infrastructure solutions are necessary.
Retrofitting existing neighbourhoods with SuDS schemes can
also be expensive. Nonetheless, natural infrastructure offers
multiple benefits compared to hard infrastructure, such as
enhancing biodiversity, and incorporating it in the design stage
of development as part of a wider flood management strategy
can reduce capital costs substantially. A recent study in London
conservatively estimated that for every £1 invested in SuDS on
a borough level, £3.80 worth of flooding-related benefits are
created.42 Indeed, SuDS are increasingly common in developments
due to their favourability in planning decisions, with an estimated
50% of new developments in England incorporating SuDS.43
#4: Heat mitigation:
• Urban areas are typically warmer than the surrounding countryside
due to the ‘Urban Heat Island effect’, driven by densification, heat
given off from human activities, and smaller areas of greenspace.
The Committee on Climate Change estimate that, due to this,
there is a small chance that some urban areas may experience
temperature extremes above 40oC by 2040.44 This can lead to
direct economic losses, such as rail infrastructure shutting down,
as well as higher rates of heat-related mortality.45
• Natural infrastructure can have significant temperature regulation
effects in urban areas, not only cooling down buildings in summer
but warming them in winter. One study found that trees positioned
42. Juan Ossa-Moreno et al (2017). Economic next to buildings reduced internal summer temperatures by 6oC
analysis of wider benefits to facilitate SuDS up-
take in London, UK. Sustainable Cities and So-
and raised winter temperatures by 6oC. They also led to a 26% fall
ciety, 28: 411 – 419, Table 5 (Link); the Ben- in energy consumption, helping combat the expected future rise
efit-Cost Ratio includes flood benefits only.
43. Ibid, Sayers et al (2020). CCRA3 Future Flood in urban energy consumption for air conditioning.46 Although the
Risk: Main Report. P41 (Link). exact level of cooling varies over the year and with the building,
44. The CCC (2021). Independent Assessment of
UK Climate Risk (CCRA3). P48 (Link). green roofs have been shown to reduce surface temperatures on
45. Charles Ffoulkes et al (2019). Research to retrofitted roofs by around 20oC, and green walls can reduce
update the evidence base for indicators of cli-
mate-related risks and actions in England. Pag- temperatures by 4-6oC in summer.47
es 19-21 (rail infrastructure), 120 (heat-re-
lated deaths) (Link).
• When scaled up, there are clear benefits across whole cities;
46. Ranko Bozovic et al (2017). Blue Green Solu- one study estimated that in Manchester increasing the cover of
tions. A Systems Approach to Sustainable, Re-
silient and Cost-Efficient Urban Development green natural infrastructure to 10% could result in temperature
(Link). reductions of 2.5oC under a high emissions scenario.48 The ONS
47. Susanne Charlesworth (2010). A review of
the adaptation and mitigation of global climate estimates that the benefits of green natural infrastructure across 11
change using sustainable drainage in cities.
Journal of Water and Climate Change, vol-
city regions in the UK leads to £300 million in benefits, stemming
ume 1 (3): 165-180 (Link); Kenneth Ip et from avoided productivity losses and reduced cooling costs.49
al(2010), Shading performance of a vertical de-
ciduous climbing plant canopy. Build. Environ.,
45(1), 81–88 (Link).
48. Susannah Gill (2007), Adapting cities for cli-
mate change: the role of the green infrastruc-
ture. Built Environment, 33(1), 115-133
(Link).
49. Office for National Statistics (2019). UK
Natural Capital Accounts: 2019. See Table 7
(Link).
26 | policyexchange.org.ukYou can also read