Navigating the Obesity Epidemic Through Enhanced Risk Management Solutions - Perspectives on the impact of obesity
←
→
Page content transcription
If your browser does not render page correctly, please read the page content below

Navigating the Obesity
Epidemic Through
Enhanced Risk
Management Solutions
Perspectives on the impact of obesity

Navigating the Obesity Epidemic Through Enhanced
Risk Management Solutions

T  he ongoing obesity epidemic in North America has significant implications for mortality — and for
   our industry. As your risk management partner, Munich Re North America Life is working hard to
develop the industry’s most accurate, holistic view of metabolic risk as well as the best tools insurers can
use to manage their exposure to that risk.

Rather than rely on older approaches, at Munich Re, we combine state-of-the-art predictive analytics and
industry-leading underwriting and medical expertise to push the envelope. In this article, we share our
view of the risks as well as innovative ways to assess and mitigate this growing concern to help carriers
successfully position their businesses in a risk-informed way.

Obesity: addressing an underappreciated risk

                                                                                                           35%                                          27%
It’s no secret that we are in the midst of an obesity
epidemic. Twelve states in the U.S. now have an adult
obesity prevalence at or above 35%,1 while 27% of adults
in Canada were found to be obese in 2016-17.2                                                              United States                                    Canada
                                                                                                            (as of 2019)                                (in 2016-2017)
These trends are not new. So why are we more focused
than ever before on obesity risk and what it means for the insurance industry? Rather than rely on older approaches,
at Munich Re, we combine state-of-the-art predictive analytics and industry-leading underwriting and medical
expertise to push the envelope. We are identifying innovative ways to assess and mitigate this growing concern to
help carriers successfully position their businesses in a risk-informed way.

COVID-19 has highlighted the profound impact of obesity on all aspects of health
The significant impact of obesity on COVID-19 mortality provides stark evidence of the myriad and underappreciated
ways that obesity undermines health and heightens mortality.

Analyses have found that those with a body mass index (BMI) of 35 or more have fared significantly worse in the
pandemic, with one study concluding that “obesity plays a profound role in risk for death from COVID-19, particularly
in male patients and younger populations.”3 The increasing frequency of epidemics due to globalization and climate
change suggests that the risk to those who are obese is similarly increasing.

1
    Centers for Disease Control and Prevention. (2021 March). Obesity, race/ethnicity, and COVID-19. https://www.cdc.gov/obesity/data/obesity-and-covid-19.html
2
    Statistics Canada. (2018, October). Obesity in Canadian Adults, 2016 and 2017. https://www150.statcan.gc.ca/n1/pub/11-627-m/11-627-m2018033-eng.htm
3
    Tartof SY, Qian L, Hong V, Wei R, Nadjafi RF, Fischer H, Li Z, Shaw SF, Caparosa SL, Nau CL, Saxena T, Rieg GK, Ackerson BK, Sharp AL, Skarbinski J, Naik TK, Murali SB. (2020, November).
Obesity and Mortality Among Patients Diagnosed With COVID-19: Results From an Integrated Health Care Organization. Ann Intern Med. https://pubmed.ncbi.nlm.nih.gov/32783686/

    © 2021 Munich Re. All rights reserved.				                                                 Navigating the Obesity Epidemic Through Enhanced Risk Management Solutions | 1
Obesity is no longer an acute disease, but a chronic one
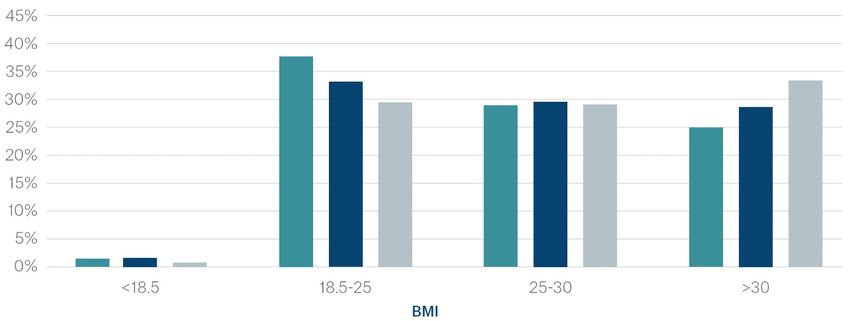
At the same time, BMI values continue to move upward for the population as a whole. According to the Centers for
Disease Control and Prevention (CDC), the percentage of the U.S. population aged 40-69 defined as normal weight
(BMI of 18.5-25) shrank from 41% to 32% between 1999-00 and 2015-16 while the percentage considered obese
(BMI of 30+) grew from 27% to 36%. (see Figure 1.) And while almost 14% of adults in Canada were considered
obese in 1978,4 27% were in 2017.2 Obesity among adolescents has also increased, with severe implications for long-
term health and the likelihood of complications such as diabetes and cardiovascular disease.
BMI at an individual level also
continues to creep upward from early
childhood through late middle age.
A Canadian study measuring the
45%
average 5-year change in BMI for
40%
individuals in different age cohorts
35%
found that BMI increased for every 30%
age cohort, except for those over age 25%
65. (see Figure 2.) 20%
15%
Both academic papers and our 10%
own research show an impact of 5%
between a quarter and half percent 0%
of worsening mortality each year 30
because of these trends. This makes
it more critical than ever to leverage Figure 1. BMI prevalence over time
the appropriate tools for identifying
‘healthy obese’ and accurately pricing
those with heightened risk.
29 + 1.5 29 + 1.5
28.5 28.5
28 +1 28 +1
27.5 27.5
27 + 0.5 27 + 0.5
26.5 26.5
26 0 0
26
25.5 25.5
25 - 0.5 - 0.5
25
24.5 24.5
1 1
24 24
25-34 35-44 45-54 55-64 65-74 75+ 25-34 35-44 45-54 55-64 65-74 75+
Baseline BMI Mean 5-year change in BMI Baseline BMI Mean 5-year change in BMI
Numbers on the left axis represent body mass index (BMI). Solid squares represent the mean baseline BMI. Numbers on the right axis represent mean change in BMI. Circles represent the mean
5-year change in BMI.
2
Statistics Canada. (2018, October). Obesity in Canadian Adults, 2016 and 2017. https://www150.statcan.gc.ca/n1/pub/11-627-m/11-627-m2018033-eng.htm
4
Public Health Agency of Canada, & Canadian Institute for Health Information. (2011). Obesity in Canada. https://www.canada.ca/content/dam/phac-aspc/migration/phac-aspc/hp-ps/hl-mvs/
oic-oac/assets/pdf/oic-oac-eng.pdf
© 2021 Munich Re. All rights reserved. Navigating the Obesity Epidemic Through Enhanced Risk Management Solutions | 2
Metabolic Risk Calculator

M     unich Re’s new Metabolic Risk Calculator helps insurers gain a more nuanced view of obesity risk. Current
      underwriting that assigns the same level of risk to all individuals with a given BMI ignores the fact that
metabolic health can vary considerably among those with the same BMI. By focusing on BMI in isolation, the
industry is underpricing certain risks that will hurt profitability in the long term and missing the opportunity to find
bright spots where a more favorable approach is warranted. The key is moving beyond imprecise measures like BMI
in isolation to holistically consider multiple associated factors to more accurately assess metabolic health.

Munich Re has developed a multivariate, evidence-based Metabolic Risk Calculator that allows insurers to better
assess metabolic risk by:
    Relying on a multivariate analysis of multiple metabolic risk factors
    Based on an analysis of multiple risk factors and actual outcomes for 1.5 million insurance applicants in the U.S., our
    metabolic risk calculator assesses mortality risk based not only on multiple factors such as build, blood pressure,
    cholesterol, and more, but also on the associations among these various factors. This will give users a much
    more nuanced picture of an applicant’s actual mortality risk than can be determined by scoring each risk factor
    independently.

    Better assessing the impact of age on metabolic risk
    Adolescents with high BMIs are a worse risk than older people with the same BMIs, all other factors being equal, due to
    the increased length of time they have to develop comorbidities as a result. The metabolic risk calculator automatically
    assesses BMI in the context of age through its multivariate approach, appropriately weighting mortality risk for obese
    individuals in different age groups.

    Simplifying the underwriting experience
    Replacing separate individual calculators for various risk factors with one comprehensive calculator will also save
    insurers significant time and effort in assessing metabolic risk.

    Addressing the fact that not all obesity poses the same risk
    It is critical to identify the more metabolically healthy, even among obese applicants. Rather than downgrading risk for
    everyone with a BMI over 30, the calculator enables a more accurate assessment of risk on an individual basis, allowing
    insurers to be more precise and competitive.

To do this, our metabolic risk calculator:
    Includes waist-to-height ratio. Although easy to calculate, BMI cannot distinguish between lean and fat mass or shed
    light on how fat is distributed in the body. Instead, body composition — a measure of the fat, muscle, water, and bone in
    the body — and how fat is distributed in the body are more closely correlated to adverse health outcomes than BMI. Our
    metabolic risk calculator incorporates a waist-to-height ratio to provide this more accurate view of body composition
    and better assess risk.

    Adds exercise levels and Brain Natriuretic Peptide (NT-proBNP) as additional measures to estimate true risk: Cardiac
    function screening tests, such as an exercise tolerance test, echocardiogram, NT-proBNP, and a coronary calcium score,
    can uncover the presence of early changes that may impact an individual’s metabolic risk. Our calculator allows for the
    assessment of those metabolic risks.

© 2021 Munich Re. All rights reserved.				                      Navigating the Obesity Epidemic Through Enhanced Risk Management Solutions | 3
Digital Assessment Platform (DAP)

T   he vast expansion of accelerated underwriting programs demands a new perspective on obesity risk. In today’s
    hyper-competitive landscape, accelerated underwriting approaches offer speed and simplicity for a better
customer experience and lower acquisition costs. But driving high straight-through processing rates while also
mitigating potentially greater mortality risk is critical to maintaining profitability.

Successfully balancing risk and pricing to maintain competitiveness and profitability requires robust risk monitoring,
management, and mitigation tools. The transition toward fluidless programs has increased the urgency around
discovering new ways to manage obesity risk. We are developing sophisticated tools and cutting-edge technology
to enhance risk management.

Munich Re’s Digital Assessment Platform (DAP), built on advanced machine learning, predictive analytics, and
our underwriting expertise, helps insurers gain real-time insights to improve risk selection and identify areas of
opportunity by:

    Monitoring risk for improved risk selection and more profitable underwriting
    DAP’s predictive models make it possible to identify and measure relative mortality and BMI misrepresentation risk
    (as well as smoking misrepresentation and lapse risk) at both the individual applicant and distribution channel levels.
    This gives carriers insight into the applicants for whom additional evidence may be warranted. It also enables them to
    monitor and compare the type and amount of risk created by different segments of their distribution network. And DAP
    provides a view of risk over time so that insurers can track how risk is changing year over year.

    Benchmarking BMI risk and ratings against competitors
    DAP helps carriers understand their position in the marketplace by providing insight into how the BMI distribution of
    their applicants and their ratings of those applicants compare to that of their peers — and understand which factors
    (age, gender, education, income, lab values, etc.) are driving those differences. This can help identify opportunities for
    market expansion and ensure that premiums are optimal for maximum profitability.

    Helping carriers optimize their programs
    As carriers compete for new business and implement new accelerated underwriting programs, determining how much
    evidence to require, what data sources to tap, and what questions to ask applicants has become paramount. DAP’s
    program optimization tools also help carriers understand, for their specific population, the best set of evidence to
    require to improve the customer experience and reduce costs while also controlling the mortality impact.

© 2021 Munich Re. All rights reserved.				                       Navigating the Obesity Epidemic Through Enhanced Risk Management Solutions | 4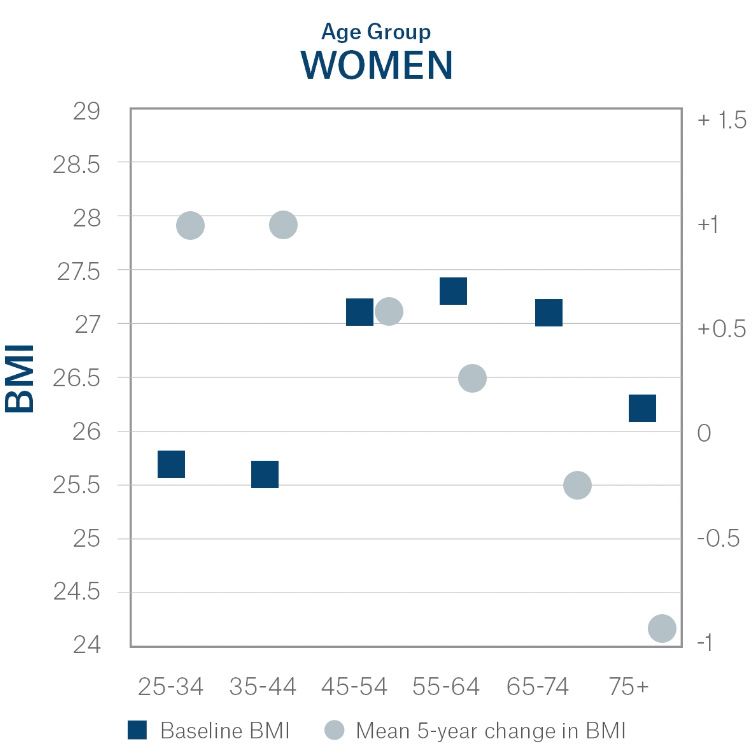
BMI Misrepresentation Predictive Model

Identify patterns of BMI misrepresentation proactively. BMI misrepresentation has emerged as one of the main
 drivers of misclassification — second only to smoking non-disclosure — in accelerated underwriting programs.
With research confirming BMI misrepresentation rates of 20% or higher in fully underwritten programs, these rates
are expected to increase in accelerated programs, imposing a material impact on mortality risk.5

But not all applicants have the same likelihood of misrepresenting their BMI and also vary in the magnitude of
their underreporting.

Anticipating the probability and magnitude of this misrepresentation is key for identifying high-risk applicants and
mitigating the extra mortality impact.

Munich Re’s BMI misrepresentation predictive model helps to identify these patterns of BMI misrepresentation
proactively. Using data from pre-existing, fully underwritten cases, the model is trained to identify discrepancies
between applicants’ reported and measured BMI. This enables it to flag those applicants likely to significantly
understate their BMI to be handled appropriately to address the misrepresentation. The model also helps carriers
identify patterns of misrepresentation in the distribution.

Effectively managing and mitigating metabolic risk

D   espite the growing risks posed by increasing obesity in North America, new tools, predictive analytics, and
    disruptive technology solutions make it possible to develop fairer and more accurate pricing while potentially
expanding the insured population. The key is moving beyond imprecise measures like BMI in isolation and
holistically considering multiple associated factors to assess metabolic health more accurately.

As your risk management partner, Munich Re is committed to helping you develop the best understanding of
metabolic risk and better assess, manage and mitigate it in your business. We also continue to study new third-party
solutions with the potential to revolutionize underwriting programs. Partner with us to leverage our powerful tools
and innovative solutions such as the metabolic risk calculator, DAP platform, and BMI misrepresentation model and
help advance your business in this evolving insurance landscape.

5
    Shahrawat. M. (2020, July) Predictive Analytics and BMI Misrepresentation. https://www.munichre.com/us-life/en/perspectives/predictive-analytics-mortality-impacts-bmi-misrepresentation.
html

© 2021 Munich Re. All rights reserved.				                                                   Navigating the Obesity Epidemic Through Enhanced Risk Management Solutions | 5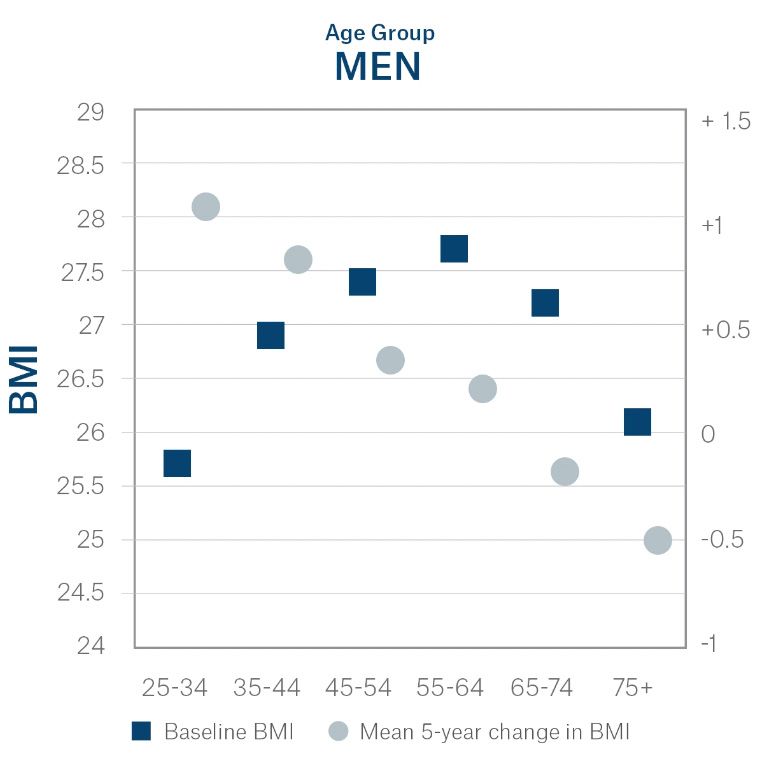
Munich Re North America Life
Perspectives on the impact of obesity
munichre.com/obesity-perspectives
Copyright © Munich American Reassurance Company
Copyright © Munich Reinsurance Company

April 2021
You can also read