NCH Sleep DataBank: A Large Collection of Real-world Pediatric Sleep Studies - arXiv
←
→
Page content transcription
If your browser does not render page correctly, please read the page content below
NCH Sleep DataBank: A Large Collection of Real-world
                                                            Pediatric Sleep Studies
                                                         Harlin Lee,1 Boyue Li,1 Shelly DeForte,2 Mark L. Splaingard,2
                                                               Yungui Huang,2 Yuejie Chi,1* Simon L. Linwood3*
arXiv:2102.13284v3 [eess.SP] 27 Oct 2021

                                                                                              Abstract
                                                     Despite being crucial to health and quality of life, sleep—especially pediatric sleep—is not
                                                 yet well understood. This is exacerbated by lack of access to sufficient pediatric sleep data
                                                 with clinical annotation. In order to accelerate research on pediatric sleep and its connection
                                                 to health, we create the Nationwide Children’s Hospital (NCH) Sleep DataBank and publish
                                                 it at Physionet and the National Sleep Research Resource (NSRR), which is a large sleep data
                                                 common with physiological data, clinical data, and tools for analyses. The NCH Sleep Data-
                                                 Bank consists of 3,984 polysomnography studies and over 5.6 million clinical observations on
                                                 3,673 unique patients between 2017 and 2019 at NCH. The novelties of this dataset include: 1)
                                                 large-scale sleep dataset suitable for discovering new insights via data mining, 2) explicit focus
                                                 on pediatric patients, 3) gathered in a real-world clinical setting, and 4) the accompanying rich
                                                 set of clinical data. The NCH Sleep DataBank is a valuable resource for advancing automatic
                                                 sleep scoring and real-time sleep disorder prediction, among many other potential scientific
                                                 discoveries.

                                           Background & Summary
                                           Sleep is an active process associated with physiological changes that involve multiple organ systems,
                                           and is vital for the maturation and daily functioning of infants, children and adolescents. Conse-
                                           quently, disruption of the complex interplay between sleep and other physiological processes can
                                           lead to significant medical consequences [1]. Sleep disorders, like obstructive sleep apnea (OSA)
                                           [2, 3], can lead to derangements in function that contribute to significant morbidity and even mor-
                                           tality. Sleep can also be disrupted by many organ-specific diseases like asthma, sickle cell disease,
                                           renal failure, or depression that alter the course of a particular medical condition and result in a
                                           poorer quality of life.
                                               Sleep disturbances in children are classified as behavioral insomnias of children, sleep-related
                                           breathing disorders, parasomnias, sleep-related movement disorders, circadian rhythm disorders
                                           or hypersomnias [4]. These sleep disorders may be associated with excessive daytime sleepiness
                                           (rare in young children), hyperactivity–impaired attention, poor school performance from impaired
                                           concentration and vigilance, and behavior problems including irritability.
                                           1. Department of Electrical and Computer Engineering, Carnegie Mellon University, 5000 Forbes Avenue, Pittsburgh
                                           PA 15213, USA.
                                           2. Nationwide Children’s Hospital, 700 Children’s Drive, Columbus OH 43205, USA.
                                           3. School of Medicine, University of California, Riverside, 92521 Botanic Gardens Drive, Riverside CA 92507, USA.
                                           *Corresponding authors: Yuejie Chi (yuejiechi@cmu.edu), Simon Lin Linwood (simon.linwood@ucr.edu)

                                                                                                  1
Sleep problems suffer from under-reporting by parents and under-diagnosis by primary care
physicians, but are conservatively estimated to occur in approximately 25% of healthy children
younger than 5 years and in up to 80% of children with special health care needs. Estimates of
prevalence of sleep disorders in children vary more widely for behavioral sleep problems like insomnia
than organic sleep problems like OSA.
While some childhood sleep disorders need only medical history to be properly diagnosed and
managed, some infants and children require an analysis of the child actually sleeping, called an
overnight sleep study or polysomnography (PSG), to accurately diagnose their sleep-related con-
dition. During an overnight PSG, the sleeping child’s physiological signals are recorded under the
direct supervision of specially trained sleep technicians, who attach monitoring sensors to special
computer software and adjust them during the night. The technician also provides observations
about the child’s sleep that are invaluable in making an accurate diagnosis. Video monitoring is also
incorporated into the PSG, allowing review of movements necessary to diagnose nocturnal seizures,
which occur in about 20% of children with epilepsy.
The physiological data collected during a PSG provide a picture of clinically useful information
about different sleep stages, sleep disruption, respiratory status during different sleep stages, leg
movements, and changes in cardiac rate and rhythm during sleep. For instance, episodes of OSA
may consist of decreased airflow in spite of normal respiratory effort in thoracic and abdominal
belts, changes in electroencephalogram (EEG) pattern called arousals, cardiac deceleration, and
oxygen desaturation. These findings may be mild during non-random eye movement (non-REM)
sleep but profound during REM sleep.
Computational algorithms that learn from large amounts of data have seen remarkable success
in healthcare, particularly with the proliferation of electronic health records (EHR) and improved
sensors. Regrettably, without a curated and comprehensive dataset of substantial size and acces-
sibility, pediatric sleep has not been able to fully benefit from such opportunities yet. As a first
step, this data descriptor introduces the Nationwide Children’s Hospital (NCH) Sleep DataBank,
which has 3,984 pediatric sleep studies on 3,673 unique patients conducted at NCH between 2017
and 2019, along with the patients’ longitudinal clinical data. They were gathered in the real-world
clinical setting at NCH as opposed to, for example, a controlled clinical trial. The published PSG
contain the patient’s physiological signals as well as the technician’s assessment of the sleep stages
and descriptions of additional irregularities [5]. The accompanying 5.6 million records of clinical
data are extracted from the EHR, and are separated into encounters, medications, measurements
(e.g. body mass index), diagnoses, and procedures. The dataset is deposited in the National
Sleep Research Resource (NSRR) [6] and Physionet [7, 8], and can be requested from https:
//sleepdata.org/datasets/nchsdb or https://physionet.org/content/nch-sleep. Accom-
panying code in Python to assist users in interacting with the dataset is published at https:
//github.com/liboyue/sleep_study.
We expect the NCH Sleep DataBank to be used to study many problems related to pediatric
sleep, including but not limited to:
• Automatic sleep stage classification, especially algorithms that combine modalities beyond
EEG or ECG [9, 10, 11, 12, 13],
• Automatic real-time sleep disorder (e.g. OSA) detection [14, 15],
• Diagnosis prediction,
2• Identifying patient subgroups that could affect their symptoms or best courses of treatment,
e.g. as suggested for insomnia [16],
• Treatment (e.g. medications and procedures) efficacy analysis.
Methods
Sleep study data acquisition
The NCH Sleep DataBank contains sleep studies acquired under standard care at NCH between
Dec. 16, 2017 and Dec. 31, 2019 using Natus Sleepworks versions 8 and 9 [17, 18]. Physiological
data collected during an overnight sleep study contain:
• Electroencephalogram (EEG) to identify sleep stages,
• Electromyelogram (EMG) of chin activity to help identify the decreased tone seen during
REM sleep,
• Leg EMG to measure leg movements,
• Electrooculogram (EOG) to identify characteristic eye movements seen during REM sleep,
• Electrocardiogram (ECG) to monitor cardiac rate and rhythm,
• Nasal and oral sensors to measure airflow,
• Thoracic and abdominal belts to measure chest and abdominal movements during breathing,
which is helpful in demonstrating increased or decreased respiratory effort,
• Pulse oximetry to measure blood oxygen saturation,
• End-tidal carbon dioxide (CO2) measurement of exhaled air to indirectly measure blood CO2
to assess for hypoventilation.
Sleep studies were annotated in real time by technicians at the time of the study, and then were
staged and scored by a second technician after the study was completed. Technicians annotated
studies using a combination of free-form text entries and selections within Natus Sleepworks. Tech-
nicians tried to identify all events of interest, however each technician may have their own style of
text annotation. Due to the variability in sleep stages in children, NCH does not use automatic
scoring of sleep stages. All sleep stages were manually scored by a technician and then verified or
changed by a physician board certified in sleep medicine.
Sleep studies were manually downloaded and converted to EDF+ format between May 2019
and Feb. 2020 using Natus Sleepworks version 9. Any gaps in the time-series data were padded
with zeros as part of the conversion. The specific acquisition equipment, setup, and montage are
variable between studies. Standard channel names are used and documented in the header of the
EDF files, allowing inference of the montage.
3Patient cohort
The NCH Sleep DataBank consists of 3,984 sleep studies performed on 3,673 unique patients. Of
them, 3,400 patients have one sleep study in the dataset, 238 have two studies, and 35 patients
have more than two studies, with a maximum of 5 sleep studies for one patient. In terms of gender
distribution, 2,068 patients were male, and 1,604 were female, with one unknown. Table 1 shows
the distribution of the unique patients’ races, where the majority of the patients were White, and
about a fifth were Black or African American. In regards to ethnicity, 186 patients were Hispanic
or Latino, 3,446 patients were Not Hispanic or Latino, and 41 had ethnicity of Other, Unknown, or
No Information.
Race description Count Percentage
White 2,433 66.24%
Black or African American 738 20.09%
Multiple races 277 7.54%
Asian 93 2.53%
Others and unknown 132 3.59%
Total 3,673 100%
Table 1: The distribution of 3,673 unique patients’ races.
The majority of patients (2,412) in the dataset were less than 10 years old at the time of the
sleep study, as seen in Figure 1. Figure 2 summarizes the length of care at NCH before and after
the first sleep study. The length of care prior to first sleep study was calculated as the time between
the patient’s earliest EHR entry (i.e. diagnosis, encounter, medication, measurement, procedure)
and their first sleep study. If the patient’s earliest EHR entry was after the first sleep study, length
of care is defined as 0. The length of follow up was calculated as the time between the patient’s
first sleep study and their last recorded EHR entry. Patients had a median of 289 days of follow-up
after their first sleep study, and 74% (2,718) had follow-up between 90 days and 2 years.
Patient data linkage
Sleep study recordings and associated reports at NCH are stored in a database that is independent
from the EHR, using Natus Sleepworks as a front end. It was therefore necessary to link patient
information in two places. The first link was between the header information in the EDF+ files and
the patient data entered in Natus Sleepworks. The second link was between the patient information
in Natus and the EHR.
A spreadsheet listing all sleep studies was exported from Natus Sleepworks. This listing included
the date and time of each sleep study and patient information such as first and last name, date of
birth and medical record number (MRN) for most sleep studies. Sleep studies were then downloaded
from Natus in mini-batches, and exported to EDF+. Sleep study specific header information in the
EDF+ files were used to match these files to the Natus spreadsheet export. When ambiguity was
present, or when MRNs were not present in Natus, we removed the EDF+ file from our dataset.
We then used each patient’s last name, date of birth, and MRNs extracted from Natus to retrieve
patient records from the EHR. When matches could not be confidently made to the EHR, the sleep
studies were removed from the dataset.
4300
250
Number of sleep studies
200
150
100
50
0
0 5 10 15 20 25 30
Age at time of sleep study (years)
Figure 1: Age at the time of sleep study, where 20 patients that are more than 30 years old are not
shown.
Data de-identification and IRB exemption
Each unique patient was given a random identifier (STUDY_PAT_ID), and each sleep study was
given a separate random identifier (SLEEP_STUDY_ID). A single patient may have multiple sleep
studies in the dataset, and therefore have multiple associated SLEEP_STUDY_IDs. Sleep studies
were then renamed (STUDY_PAT_ID)_(SLEEP_STUDY_ID).edf.
All EDF+ headers were de-identified by replacing the first 256 bytes of the EDF+ file with a
standard de-identified header. Annotation channels were read from EDF+ using Python MNE [19]
and written to text. All EDF+ files were converted to EDF by removing the annotation channel
using Luna [20]. Annotation text files were then de-identified by replacing any word that was not
in a whitelist with ‘XXX’. The whitelist was a combination of 162 common phrases found in the
annotations obtained by manual inspection, and a larger whitelist used by the de-identification
program Philter [21]. The Philter whitelist contains approximately 195,000 tokens of medical terms
and codes and common medical abbreviations, in addition to 20,000 most common English words,
and excludes the most common Social Security and Census names. The tab delimited, de-identified
annotations were then renamed to match the EDF filenames.
Next, a random date shift was applied within each patient data. For each STUDY_PAT_ID,
a random date shift of +/- 180 days was chosen, and all identified patient data that are linked to
the STUDY_PAT_ID (i.e. from EHR and Natus) were adjusted.
Finally, as an extra precaution against re-identification, rare diagnosis codes were redacted from
the diagnosis table. We defined rare diagnoses as final diagnoses given to less than 10 unique
patients from the entire NCH patient population (not limited to the sleep study patients) during a
given time period. Since the earliest record in the diagnoses table was 2001, we queried 1) counts
of unique NCH patients per ICD-9 code from Jan. 1, 2000 to Sep. 30, 2015, and 2) counts of
5600 600
500 500
400 400
Number of patients
Number of patients
300 300
200 200
100 100
0 0
−25 −20 −15 −10 −5 0 0 200 400 600 800 1000 1200
Length of care before first sleep study (YEARS) Follow up after first sleep study (DAYS)
Figure 2: Length of care at NCH before and after first sleep study, where each patient has two
entries: one negative for length of care prior to first sleep study (in years), and one positive for
follow up after first sleep study (in days). One entry above 1200 days and 5 entries below -25 years
are not shown.
unique NCH patients per ICD-10 code from Oct. 1, 2015 to Dec. 31, 2020. If a code had less than
10 unique patients in either ICD-9 or ICD-10 lists, it was deemed a rare diagnosis code. In every
row where a rare diagnosis code appeared, we changed the entries in “DX_CODE”, “DX_NAME”,
“DX_ALT_CODE”, “CLASS_OF_PROBLEM”, “CHRONIC_YN” to “redacted”. This process
affected a total of 6,460 rows and 834 unique patients in our diagnosis table.
As this project concerns analysis on de-identified data, the project did not fit the definition of
Human Subjects Research as defined by the United States Department of Health and Human Ser-
vices and Food and Drug Administration. Therefore, this study received NCH Institutional Review
Board (IRB) exemption with HIPAA waiver. The protocol that concerns the de-identification and
processing of the data, which requires handling identified data, and the collection and publication
of data and summary statistics, was approved under “STUDY00000505: Preparation of sleep study
data” on September 22, 2019.
Data Records
The NCH Sleep DataBank consists of two folders: Sleep_Data and Health_Data. Sleep_Data
contains annotated PSG recordings, while Health_Data contains patient demographic and clinical
data extracted from the EHR. Inside Sleep_Data, PSG sleep studies are provided in the EDF
format, and annotations are provided in a separate tab-delimited file. Sleep studies and their
matched annotations share the same file name (STUDY_PAT_ID)_(SLEEP_STUDY_ID) but
different extensions (.edf, .tsv). Clinical data in Health_Data are in .csv files, and they are linked
6to the files in Sleep_Data through the same STUDY_PAT_ID. Variables follow EHR conventions,
and descriptions can be found in the file Sleep_Study_Data_File_Format.pdf in Health_Data.
Sleep studies
The 3,984 sleep study files (.edf) contain PSG recordings taken in clinical setting at NCH. An
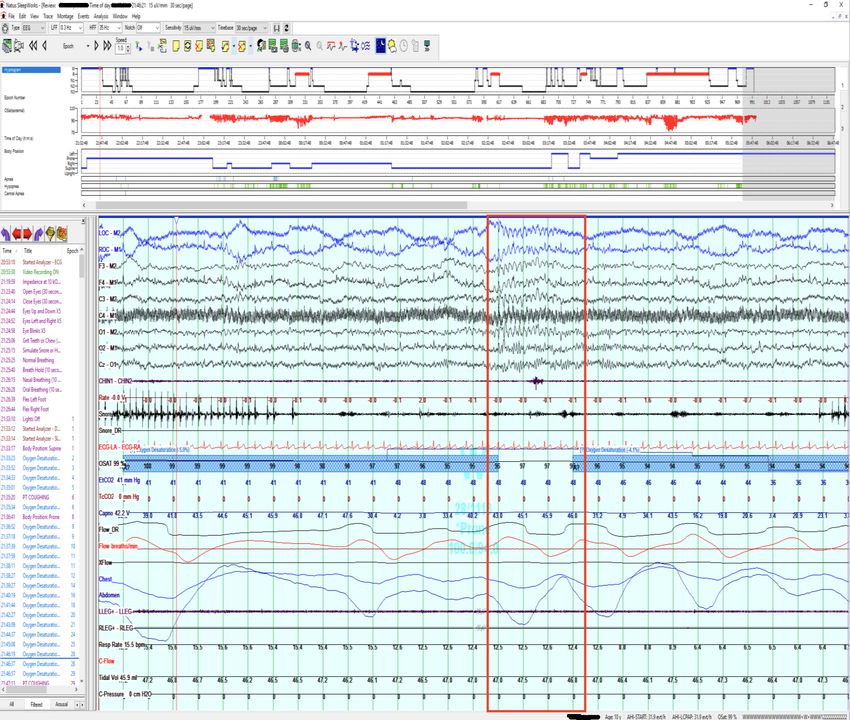
example plot of the signals can be seen in Figure 3. Almost half (1,972) of the files have 26
channels, a quarter (1,012) have 29, a fifth (820) have 25, and the rest have 28, 24, 40, 27, 9, or
56 channels, in decreasing order of frequency. The most commonly appearing channel names are
summarized in Table 2. The channel PATIENT EVENT was not used and can be excluded from
analyses.
The total length of recording in the NCH Sleep DataBank amounts to 40,884 hours, where the
minimum length of study is 3 minutes, the maximum is 16.5 hours, and the mean is 10.3 hours.
94.85% of the files contain between 8 and 12 hours of recordings, and the patients slept for a subset
of those times. Users of the dataset should take into account that the majority of the recordings
(3,204) are collected with a sampling frequency of 256Hz, but 581 studies were sampled in 400Hz,
and the rest (199) in 512Hz.
Sleep study annotations
The 3,984 annotation files (.tsv) contain a total of 5,046,370 annotations, among which there are
35,821 unique descriptions. The minimum number of annotations contained in a sleep study is
5, while the maximum is 6,047, and the mean value is 1,267. Each annotation has the following
information, where an example is given in Table 3.
• onset: The start time of the event since the beginning of the study in seconds.
• duration: The length of the event in seconds.
• description: The description of the event, which may be sleep stage label or free-form text
entry by the NCH technician, or standard sleep event label by Natus Sleepworks.
In particular, sleep stages are found in annotations with a duration of 30 seconds, where the
descriptions include ‘Sleep stage W’, ‘Sleep stage N1’, ‘Sleep stage N2’, ‘Sleep stage N3’, ‘Sleep
stage R’, or ‘Sleep stage ?’. The annotation ‘Sleep stage ?’ typically occurs after ‘Lights On’,
and physiological data acquired during that time can usually be ignored, as it indicates that the
study has ended. Of the total number of annotations, 79.48% were related to sleep staging: 6.88%
(347,294) are ‘Sleep stage ?’, 13.19% (665,676) are ‘Sleep stage W’, 2.54% (128,410) are ‘Sleep stage
N1’, 27.41% (1,383,765) are ‘Sleep stage N2’, 17.35% (875,486) are ‘Sleep stage N3’, and 12.11%
(611,320) are ‘Sleep stage R’. This is equivalent to 30,539 hours of data with sleep stage labels. The
mean length of such data per study is 7.7 hours, and 96.63% (3,850) of the studies contain between
6 and 10 hours of sleep data with stage labels.
Besides sleep stage labels, the most common events include: Oxygen Desaturation, Oximeter
Event, EEG Arousal, Obstructive Hypopnea, Limb Movement, Gain/Filter Change, Move, Body
Position: (Left, Right, Supine, Prone, Upright), Obstructive Apnea, Hypopnea, Central Apnea,
and Mixed Apnea.
Free text annotations by the NCH technician typically describe events in the room, movements,
and other patient activities, and will often have a duration of 0 seconds. Additionally, hypopneas,
7Channel name EDF file count Percentage
EEG C3-M2 3,971 99.67%
EEG O1-M2 3,971 99.67%
EEG O2-M1 3,971 99.67%
EEG CZ-O1 3,971 99.67%
RATE 3,970 99.65%
ETCO2 3,970 99.65%
CAPNO 3,970 99.65%
RESP RATE 3,970 99.65%
SPO2 (2,819) or OSAT (1,152) 3,970 99.65%
EEG F3-M2 3,969 99.62%
RESP THORACIC (2,821) or RESP CHEST (1,148) 3,969 99.62%
RESP ABDOMINAL (2,821) or RESP ABDOMEN (1,148) 3,969 99.62%
SNORE 3,968 99.60%
EEG C4-M1 3,962 99.45%
EEG F4-M1 3,960 99.40%
C-FLOW 3,943 98.97%
EOG LOC-M2 3,933 98.72%
EOG ROC-M1 3,931 98.67%
EMG CHIN1-CHIN2 3,782 94.93%
PRESSURE 2,824 70.88%
EMG LLEG-RLEG 2,820 70.78%
ECG EKG2-EKG 2,820 70.78%
RESP AIRFLOW 2,820 70.78%
TIDAL VOL 2,818 70.73%
RESP PTAF 2,817 70.71%
PATIENT EVENT 2,722 68.32%
TCCO2 1,417 35.57%
SNORE_DR 1,148 28.82%
XFLOW 1,148 28.82%
EMG LLEG+-LLEG- 1,146 28.77%
EMG RLEG+-RLEG- 1,146 28.77%
ECG LA-RA 1,146 28.77%
FLOW_DR 1,146 28.77%
RESP FLOW 1,146 28.77%
C-PRESSURE 1,146 28.77%
EEG CHIN1-CHIN2 136 3.41%
Table 2: List of 33 most common channels and their frequencies in 3,984 EDF files. Other 101
channels appear in less than 1% of the files.
8onset duration description
15985.234375 0.0 Chewing motion
15990.93359375 30.0 Sleep stage W
16002.09375 0.0 Movement
16002.34375 1.21875 Limb Movement
Table 3: Example annotations from a .tsv file. ‘Chewing motion’ and ‘Movement’ are free text
entries by the NCH technicion, while ‘Limb Movement’ is a standard sleep event labeled by Natus
Sleepworks.
apneas, seizures, and other patient events may be mentioned in the free text annotations. On the
other hand, standard sleep event annotations are selected in, or automatically applied by Natus
Sleepworks [17, 18], and are likely to have varying durations other than 0 or 30 seconds.
While there may be some variation, the general format for sleep studies is as follows: Sleep
staging begins at the annotation ‘Lights Off’ and ends at ‘Lights On’. Descriptive annotations
will typically precede sleep stage scoring at irregular intervals prior to ‘Lights Off’. Sleep stages
are annotated in 30 second epochs, beginning at ‘Lights Off’; however not all studies include this
annotation.
Clinical data
The NCH Sleep DataBank includes patient demographics and longitudinal clinical data such as
encounters, medication, measurements, diagnoses, and procedures. The number of observations
and variables for each file are listed in Table 4. More details about the variables can be found in
Sleep_Study_Data_File_Format.pdf in the same folder. Note that the age of the patient at the
time of sleep study is calculated in SLEEP_STUDY.csv. Measurements include body mass index,
body mass index percentile, or blood pressure.
Table 5 lists 20 diagnoses that are given to the highest number of unique patients in the
NCH Sleep DataBank according to DIAGNOSIS.csv. Only final diagnoses as indicated by the
DX_SOURCE_TYPE and DX_ENC_TYPE variables were considered for this analysis. Any
DX_CODEs recorded in ICD 9 code were converted to the corresponding ICD 10 codes, according
to the ICD 10 codes already provided under the variable DX_ALT_CODE in DIAGNOSIS.csv.
17 unique ICD 9 diagnoses (across 75 rows) that did not have corresponding ICD 10 codes were
disregarded from further consideration. In order to get a broad overview of the patient population,
the ICD codes were abstracted to a more general level before their frequencies was counted, e.g.
diagnoses “G47.33 Obstructive sleep apnea (adult) (pediatric)” and “G47.61 Periodic limb move-
ment disorder” both counted under “G47 Sleep disorders.” Note that we started by considering all
diagnoses in the EHR data, not just the diagnoses resulting from the specific sleep studies included
the NCH Sleep DataBank.
9File name Variable names Rows
DEMOGRAPHIC.csv study pat ID, birth date, pcori gender cd, pcori 3,673
race cd, pcori hispanic cd, gender descr, race descr,
ethnicity descr, language descr, peds gest age num
weeks, peds gest age num days
SLEEP_STUDY.csv study pat ID, sleep study ID, sleep study start date- 3,984
time, sleep study duration datetime, age at sleep
study days
SLEEP_ENC_ID.csv study pat ID, sleep study ID, study enc ID 3,964
ENCOUNTER.csv study enc ID, study pat ID, encounter date, visit 495,138
start datetime, visit end datetime, adt arrival date-
time, ed departure datetime, encounter type, visit
type cd, visit type descr, ICU visit Y/N, prov ID,
prov type, dept ID, dept specialty, admit source,
hosp admit source, discharge disposition, discharge
destination, drg code, drg name, visit reason
MEDICATION.csv study med ID, study enc ID, study pat ID, med start 3,035,986
datetime, med end datetime, med order datetime,
med taken datetime, med source type, quantity,
days supply, frequency, effective drug dose, eff drug
dose source value, drug dose unit, refills, RxNorm
code, RxNorm term type, medication descr, generic
drug descr, drug order status, drug action, route,
route source value, prescribing prov ID, pharm class,
pharm subclass, thera class, thera subclass
MEASUREMENT.csv study meas ID, study pat ID, study enc ID, meas 332,569
recorded datetime, meas type, meas value number,
meas value text, meas source, study prov ID
DIAGNOSIS.csv study dx ID, study enc ID, study pat ID, dx start 1,513,853
datetime, dx end datetime, dx source type, dx enc
type, dx code type, dx code, dx name, dx alt code,
class of problem, chronic Y/N, prov ID
PROCEDURE.csv study proc ID, study pat ID, study enc ID, procedure 283,599
datetime, study prov ID, proc ID NCH, proc code,
proc code type, proc descr
PROCEDURE_SURG_HX.csv study surghx ID, study pat ID, proc noted date, proc 10,190
start time, proc end time, proc code, cpt code, proc
descr
Table 4: The variable names and number of observations for each patient data file in Health_Data.
More details about the variables can be found in Sleep_Study_Data_File_Format.pdf in the same
folder.
10Diagnosis ICD 10 code Patients, N
Sleep disorders G47 3,379
Sleep apnea G47.3 2,558
Sleep disorder, unspecified G47.9 1,163
Other sleep disorders G47.8 914
Circadian rhythm sleep disorders G47.2 566
Insomnia G47.0 388
Hypersomnia G47.1 257
Sleep related movement disorders G47.6 180
Parasomnia G47.5 165
Narcolepsy and cataplexy G47.4 47
Abnormalities of breathing R06 2,776
Encounter for immunization Z23 1,720
Chronic diseases of tonsils and adenoids J35 1,686
Encounter for general examination without com- Z00 1,587
plaint, suspected or reported diagnosis
Acute upper respiratory infections of multiple and J06 1,537
unspecified sites
Body mass index (BMI) Z68 1,417
Suppurative and unspecified otitis media H66 1,378
Symptoms and signs concerning food and fluid intake R63 1,369
Acute pharyngitis J02 1,260
Other symptoms and signs involving the circulatory R09 1,256
and respiratory system
Other functional intestinal disorders K59 1,185
Cough R05 1,176
Lack of expected normal physiological development R62 1,097
in childhood and adults
Encounter for follow-up examination after completed Z09 1,068
treatment for conditions other than malignant neo-
plasm
Nausea and vomiting R11 1,051
Fever of other and unknown origin R50 1,043
Specific developmental disorders of speech and lan- F80 1,002
guage
Asthma J45 991
Gastro-esophageal reflux disease K21 982
Table 5: 20 diagnoses that are given to the highest number of unique patients in the NCH Sleep
DataBank according to DIAGNOSIS.csv. Note that the diagnoses were abstracted to a higher level
before being counted. For example, patients with diagnosis “G47.33 Obstructive sleep apnea (adult)
(pediatric)” were counted under G47 and G47.3.
11Technical Validation
Validation of de-identification procedure
After EDF files were de-identified, we performed several validation steps to confirm that the data
matched the original EDF+ export. We loaded all channels from both the de-identified EDF file
and the original EDF+ export and confirmed that all signal channels matched. We then confirmed
that no more than 15 percent of the annotations had been changed between the files due to the
de-identification step. Finally, all files included in the data set have been read by Python MNE
through this validation procedure and any files with read errors were not included in the data set.
Validation of data maps
We identified and tested three separate points in our data pipeline: 1) mapping of sleep study
from Natus Sleepworks to the de-identified EDF file, 2) mapping of clinical data from EHR to the
de-identified CSV files, and 3) the linkage between the sleep study and the clinical data.
The first was the mapping between the de-identified EDF file and the original sleep data file
accessible via Natus Sleepworks. We first chose a random sleep study, and then a 30-second segment
from that study. Figure 3 shows that the sleep data viewed on Natus Sleepworks (top) and visualized
from the corresponding EDF file in the published dataset (bottom) match.
The second mapping was between the de-identified clinical data and the EHR. We extracted from
the dataset all clinical data associated with the random patient chosen in the first verification step,
and confirmed that they are identical to the medical records viewed from the physician interface of
the EPIC electronic medical record.
The last mapping we verified was SLEEP_STUDY_ID, the random identifier linking the sleep
studies to the patient data. We verified this by matching the sleep study, which is represented by
SLEEP_STUDY_ID, with its corresponding encounter in the patient data, which is represented by
STUDY_ENC_ID. If an encounter had procedure codes and departmental codes associated with
sleep study, had the same randomly assigned STUDY_PAT_ID as the sleep study, and the same
starting date and time (within a window of +/- one hour) as the sleep study start time obtained
from Natus Sleepworks, we considered it a match. We were able to match 3,964 sleep studies to
encounter codes in the patient data using this method, therefore providing validation of a mapping
between the sleep studies and patient data and consistency of date shifting. This information is
provided in the file SLEEP_ENC_ID.csv.
Sleep stage classification for PSG data validation
We developed a baseline sleep stage classifier and included it in the codebase to demonstrate the
technical quality as well as a potential utility of the dataset, especially the PSG data. This simple
algorithm predicts the sleep stages (W, N1, N2, N3, R) based on 30 seconds of 7 EEG channels
(F4-M1, O2-M1, C4-M1, O1-M2, F3-M2, C3-M2, CZ-O1) after they are down sampled to 128Hz.
Wavelet transform is a powerful method that can flexibly represent the time-frequency content
of a signal. As such, it is particularly useful in analyzing non-stationary signals, and have previously
been used for EEG-based sleep stage classification [22, 23, 24, 25]. After applying multi-resolution
Daubechies wavelet transform [26] to each EEG channel, we computed summary statistics such as
min, max, mean, and standard deviation of the coefficients, resulting in 84 features. A random
1213 Figure 3: Visual verification that a randomly chosen 30-second segment of sleep data on Natus Sleepworks (top) matches the sleep data in the corresponding EDF file (bottom), especially at the region of interest marked by red box. Natus Sleepworks may denoise or auto-scale some signals for the viewer.
forest classifier with 100 decision trees was then trained on these features using 67% of the dataset,
and tested on the rest.
    Table 6 reports the 3-fold stratified cross validation results on 3,928 sleep studies that had the
7 EEG channels, in addition to the results on some subgroups (0 to 1 year old, 1 to 2 years old,
and 18+ patients). Fitting the classifier with default parameters from Scikit-learn [27] took 1 hour
on Intel Xeon Gold 3.60GHz CPU in parallel; subgroups took less than 2 minutes each. This quick
and straightforward algorithm, without any denoising or parameter tuning, achieves a classification
accuracy of over 80% on the 222 adult sleep studies, suggesting high quality of the PSG recordings.
Moreover, the difference in classification results between age groups supports the importance of
having a dataset dedicated to pediatric sleep.

Prader-Willi syndrome (PWS) patient analysis for EHR data validation
The availability of EHR allows the study of clinically meaningful patient subpopulations in the
NCH Sleep DataBank. As a use case, we examine the sleep patterns of PWS patients within this
dataset. To provide context, PWS is a rare genetic disorder that is estimated to affect 1 out of
10,000 to 30,000 people, and many researchers and clinicians are interested in sleep abnormalities
and sleep-disordered breathing of PWS patients [28, 29, 30, 31, 32]. We construct two PSG cohorts,
where Cohort 1 includes the PSGs of PWS patients, and Cohort 2 consists of PSGs of obese but
non-PWS patients. To control for the effect of OSA, both cohorts only consider PSGs during which
patients were diagnosed OSA.
    To construct the PSG cohorts, we first searched for all STUDY_ENC_IDs in DIAGNOSIS.csv
during which a patient was given a final diagnosis of OSA. Then, we only kept the encounter IDs that
were also present in SLEEP_ENC_ID.csv, as we have matched them with SLEEP_STUDY_IDs
in an earlier validation step. This process identified 860 PSGs (763 unique patients) with OSA
diagnoses. Among these, 16 PSGs (12 unique patients) were designated Cohort 1, since they were
associated with STUDY_PAT_IDs that had a final diagnosis of PWS in the EHR. For reference,
the NCH Sleep DataBank has a total of 34 unique patients who had final diagnosis of PWS in the
EHR. On the other hand, 370 PSGs (311 unique patients) were associated with STUDY_PAT_IDs
with obesity diagnoses but not PWS, and selected Cohort 2.
    For every PSG in Cohort 1 and Cohort 2, we tallied the number of each sleep stage (W, N1, N2,
N3, R) annotation, and extracted the following sleep characteristics: total length of sleep (sleep
time) by counting 30 seconds of sleep for each sleep stage annotation, and distribution of sleep
stages, e.g., W constitutes 20% of the sleep time. Table 7 describes summary statistics of the
two cohorts’ sleep characteristics. In summary, the ease-of-navigation of the EHR data makes it
possible to conduct disease-specific data mining using NCH Sleep DataBank, e.g. extraction of sleep
characteristics such as apnea-hypopnea index (AHI), and refined statistical analysis that accounts
for potential confounding variables such as BMI and age.

Usage Notes
The NCH Sleep DataBank is available for download from National Sleep Research Resource (NSRR)
at https://sleepdata.org/datasets/nchsdb and Physionet https://physionet.org/content/
nch-sleep for non-commercial use.

                                                 14
Automated score sleep stage
W N1 N2 N3 R
W (661,645) 63.1 0. 34.0 1.5 1.4
sleep stage, N
Manual score
N1 (127,602) 23.9 0.9 68.1 2.1 5.0
N2 (1,375,678) 4.4 0. 88.6 5.8 1.1
N3 (871,200) 1.7 0. 27.2 70.7 0.
R (608,180) 6.7 0. 76.6 1.5 15.1
(a) All age groups. 3,928 sleep studies and 3,644,305 samples. Overall
accuracy is 64.4%.
Automated score sleep stage
W N1 N2 N3 R
W (52,979) 89.5 0.1 8.2 0.5 1.7
sleep stage, N
Manual score
N1 (8,263) 37.5 2.5 47.4 0.6 12.1
N2 (80,275) 5.6 0.1 89.1 2.9 2.3
N3 (30,612) 2.6 0. 18.3 79.1 0.
R (24,006) 9.2 0. 24.7 0.6 65.5
(b) 18 years and older. 222 sleep studies and 196,135 samples. Overall
accuracy is 81.1%.
Automated score sleep stage
W N1 N2 N3 R
W (63,041) 83.3 0. 2.4 2.8 11.4
sleep stage, N
Manual score
N1 (4,579) 28.7 1.1 24.7 6.2 39.2
N2 (38,525) 9.4 0. 62.9 10.2 17.4
N3 (64,512) 4.5 0. 3.7 83.3 8.5
R (60,167) 11.1 0. 5.0 7.1 76.8
(c) 0-1 year olds. 242 sleep studies and 230,824 samples. Overall
accuracy is 76.6%.
Table 6: Sleep stage classification results of our baseline algorithm applied to different age groups.
One sample is a 30-second epoch of sleep. Cell (row i, column j) of the normalized confusion matrix
indicates the percentage (%) of samples in stage i (manually scored by NCH technician) that were
predicted to be in stage j (by our automated algorithm). Each row adds to 100%. Bolded diagonal
entries are the percentages of samples in each stage that were correctly classified. Overall accuracy
is the total number of correctly classified samples divided by the total number of samples in %.
All numbers reported are averaged over 3-fold stratified cross validation trials and rounded to one
decimal point. Standard deviation wasCohort 1 Cohort 2
PSG, N 16 370
Unique patients, N 12 311
Age, mean ± s.d. (years) 10.5 ± 5.6 13.2 ± 4.7
Sleep time, mean ± s.d. (hours) 8.0 ± 0.7 7.5 ± 0.9
W, mean ± s.d. (%) 14.4 ± 7.1 20.5 ± 16.1
N1, mean ± s.d. (%) 4.1 ± 2.7 3.5 ± 3.4
N2, mean ± s.d. (%) 45.2 ± 7.3 39.9 ± 11.5
N3, mean ± s.d. (%) 20.5 ± 6.7 21.1 ± 8.5
R, mean ± s.d. (%) 15.8 ± 6.0 15.0 ± 7.3
N1 N2, mean ± s.d. (%) 49.3 ± 6.7 43.4 ± 11.8
N1 N2 N3, mean ± s.d. (%) 69.8 ± 6.3 64.5 ± 13.4
Table 7: Summary statistics of sleep time and distribution of sleep stages for two PSG cohorts.
Cohort 1: PSGs with OSA diagnoses on PWS patients, Cohort 2: PSGs with OSA diagnoses on
obese but not PWS patients; sleep time: total amount of time spent in sleep stages W, N1, N2,
N3, and R; s.d.: standard deviation. Percentage of each sleep stage is calculated by dividing time
spent in each sleep stage by sleep time. All numbers are rounded to one decimal point.
Potential uses
The NCH Sleep DataBank can potentially be used to study many problems related to pediatric
sleep, including but not limited to:
• Automatic sleep scoring (sleep stage classification): Sleep scoring divides sleep into two stages,
rapid eye movement (REM), and non-REM, then further divides the latter into shallow sleep
(stages N1 and N2) and deep sleep (stage N3) [9, 10, 11], in addition to wake (Stage W).
In typical pediatric clinical settings, this is a time-consuming and tedious process done by a
technician. Many computational algorithms have shown promise for automatic sleep scoring
in adults [12], which encourage exploration on automatic sleep scoring for infants and children.
Algorithms that combine PSG modalities beyond EEG or ECG [13] especially warrant more
investigation.
• Automatic sleep disorder (e.g. obstructive apnea) detection: Large sets of PSG signals pub-
lished with expert annotations can be leveraged to develop computational algorithms in sleep
disorder detection, unleashing the potential of eventual real-time systems that read these
signals and detect sleep disorders at their onsets [14, 15]. OSA detection is particularly im-
portant, as OSA is associated with various cardiovascular, respiratory, and neurocognitive
deficits and morbidity among infants and children [2, 3].
• Diagnosis prediction: Statistical models that predict or measure the risk of diagnoses using
other variables (e.g. other diagnoses, demographic, features from PSG, encounters, measure-
ment values) can be constructed and validated to create hypotheses for further experiment.
16• Identifying patient subgroups: Given the demographics and medical history, patients can
be divided into clinically meaningful subgroups before further analysis, as demonstrated in
this paper for PWS. Additionally, data-driven approaches may be developed to reveal clusters
within the patient population, which could affect their symptoms or best courses of treatment,
e.g. as suggested for insomnia [16].
• Treatment efficacy analysis: Retrospective studies using the accompanying longitudinal clin-
ical data (e.g. medications and procedures) can be used to analyze efficacy of different treat-
ments options.
Code availability
The code that was used to analyze patient data, read EDF files, run baseline sleep stage classifier,
and generate figures and tables in this paper is published at https://github.com/liboyue/sleep_
study.
Acknowledgements
Research reported in this publication was supported by the National Institute Of Biomedical Imag-
ing And Bioengineering of the National Institutes of Health under Award Number R01EB025018.
The content is solely the responsibility of the authors and does not necessarily represent the official
views of the National Institutes of Health. The authors thank Tim Held for data identification,
Melody Kitzmiller for data query, Dan Digby for data pipelines, Rajesh Ganta for data validation,
Rahul Ragesh, Ramachandra Mannava, and Jacob Hoffman for help with sleep stage classifier de-
velopment, Daniel Mobley and Michael Rueschman for publishing the data to NSRR, and Lucas
McCullum and Tom Polland for publishing the data to Physionet.
Author contributions
Y.C. and S.L.L. designed and supervised the study. S.D., Y.H., B.L., and H.L. prepared the dataset.
M.L.S. provided clinical interpretations. H.L., B.L., and S.D. conducted data analysis and technical
validation. H.L., Y.C., S.D., M.S., Y.H., B.L., and S.L.L. drafted the manuscript.
Competing interests
The authors declare no competing interests.
References
[1] Splaingard, M. L. & May, A. Sleep Disturbances. In McInerny, T. K. et al. (eds.) American
Academy of Pediatrics Textbook of Pediatric Care (American Academy of Pediatrics, Elk Grove
Village, IL, 2016).
17[2] Lumeng, J. C. & Chervin, R. D. Epidemiology of pediatric obstructive sleep apnea. Proc. Am.
Thorac. Soc. 5, 242–252 (2008).
[3] Beebe, D. W. et al. Neuropsychological effects of pediatric obstructive sleep apnea. J. Int.
Neuropsychol. Soc. 10, 962 (2004).
[4] American Academy of Sleep Medicine. International Classification of Sleep Disorders (Amer-
ican Academy of Sleep Medicine, Darien, IL, 2014), 3rd edn.
[5] Kushida, C. A. et al. Practice parameters for the indications for polysomnography and related
procedures: an update for 2005. Sleep 28, 499–523 (2005).
[6] Zhang, G.-Q. et al. The national sleep research resource: towards a sleep data commons.
Journal of the American Medical Informatics Association 25, 1351–1358 (2018).
[7] Goldberger, A. L. et al. Physiobank, physiotoolkit, and physionet: components of a new
research resource for complex physiologic signals. circulation 101, e215–e220 (2000).
[8] Lee, H., Li, B., Huang, Y., Chi, Y. & Lin, S. NCH sleep databank: A large collection of real-
world pediatric sleep studies with longitudinal clinical data (2021). (version 3.1.0). PhysioNet.
https://doi.org/10.13026/p2rp-sg37.
[9] Grigg-Damberger, M. et al. The visual scoring of sleep and arousal in infants and children. J.
Clin. Sleep Med. 3, 201–240 (2007).
[10] Berry, R. B. et al. The AASM Manual for the scoring of Sleep and Associated Events: Rules,
Terminology and Technical Specifications. Version 2.4. (American Academy of Sleep Medicine,
Darien, IL, 2017).
[11] Berry, R. B. et al. The AASM Manual for the scoring of Sleep and Associated Events: Rules,
Terminology and Technical Specifications. Version 2.5. (American Academy of Sleep Medicine,
Darien, IL, 2018).
[12] Fiorillo, L. et al. Automated sleep scoring: A review of the latest approaches. Sleep Med. Rev.
48, 101204 (2019).
[13] Yan, R. et al. Multi-modality of polysomnography signals’ fusion for automatic sleep scoring.
Biomed. Signal Process. Control 49, 14–23 (2019).
[14] Mendonca, F., Mostafa, S. S., Ravelo-García, A. G., Morgado-Dias, F. & Penzel, T. A review
of obstructive sleep apnea detection approaches. IEEE J. Biomed. Health Inform. 23, 825–837
(2018).
[15] Xie, B. & Minn, H. Real-time sleep apnea detection by classifier combination. IEEE Trans.
Inf. Technol. Biomed. 16, 469–477 (2012).
[16] Benjamins, J. S. et al. Insomnia heterogeneity: characteristics to consider for data-driven
multivariate subtyping. Sleep Med. Rev. 36, 71–81 (2017).
[17] SleepWorks 8 Reference Manual (Natus Medical Incorporated, Ontario, Canada, 2017).
[18] SleepWorks 9 Reference Manual (Natus Medical Incorporated, Ontario, Canada, 2017).
18[19] Gramfort, A. et al. MEG and EEG data analysis with MNE-Python. Front. Neurosci. 7, 267
(2013). URL https://www.frontiersin.org/article/10.3389/fnins.2013.00267.
[20] Purcell, S. Luna: software for the analysis of sleep signal data (2019). URL http://zzz.bwh.
harvard.edu/luna/.
[21] Norgeot, B. et al. Protected Health Information filter (Philter): accurately and securely de-
identifying free-text clinical notes. NPJ Digit. Med. 3, 1–8 (2020).
[22] Ebrahimi, F., Mikaeili, M., Estrada, E. & Nazeran, H. Automatic sleep stage classification
based on EEG signals by using neural networks and wavelet packet coefficients. In 2008 30th
Annual International Conference of the IEEE Engineering in Medicine and Biology Society,
1151–1154 (IEEE, 2008).
[23] Fraiwan, L., Lweesy, K., Khasawneh, N., Wenz, H. & Dickhaus, H. Automated sleep stage
identification system based on time–frequency analysis of a single EEG channel and random
forest classifier. Comput. Methods Programs Biomed. 108, 10–19 (2012).
[24] Hassan, A. R. & Bhuiyan, M. I. H. A decision support system for automatic sleep staging
from EEG signals using tunable Q-factor wavelet transform and spectral features. J. Neurosci.
Methods 271, 107–118 (2016).
[25] Şen, B., Peker, M., Çavuşoğlu, A. & Çelebi, F. V. A comparative study on classification of
sleep stage based on EEG signals using feature selection and classification algorithms. J. Med.
Syst. 38, 18 (2014).
[26] Daubechies, I. Orthonormal bases of compactly supported wavelets. Comm. Pure Appl. Math.
41, 909–996 (1988).
[27] Pedregosa, F. et al. Scikit-learn: Machine learning in Python. J. Mach. Learn. Res. 12,
2825–2830 (2011).
[28] Vela-Bueno, A. et al. Sleep in the prader-willi syndrome: clinical and polygraphic findings.
Arch. Neurol. 41, 294–296 (1984).
[29] Hertz, G., Cataletto, M., Feinsilver, S. H. & Angulo, M. Sleep and breathing patterns in
patients with prader willi syndrome (pws): effects of age and gender. Sleep 16, 366–371
(1993).
[30] Nixon, G. M. & Brouillette, R. T. Sleep and breathing in prader-willi syndrome. Pediatr.
Pulmonol. 34, 209–217 (2002).
[31] Meyer, S. L. et al. Outcomes of adenotonsillectomy in patients with prader-willi syndrome.
Arch. Otolaryngol. Head Neck Surg. 138, 1047–1051 (2012).
[32] Pavone, M. et al. Sleep disordered breathing in patients with prader–willi syndrome: A mul-
ticenter study. Pediatr. Pulmonol. 50, 1354–1359 (2015).
19You can also read