Neural encoding of voice pitch and formant structure at birth as revealed by frequency following responses - Nature
←
→
Page content transcription
If your browser does not render page correctly, please read the page content below

www.nature.com/scientificreports
OPEN Neural encoding of voice pitch
and formant structure at birth
as revealed by frequency‑following
responses
Sonia Arenillas‑Alcón1,2,3, Jordi Costa‑Faidella1,2,3*, Teresa Ribas‑Prats1,2,3,
María Dolores Gómez‑Roig3,4 & Carles Escera1,2,3*
Detailed neural encoding of voice pitch and formant structure plays a crucial role in speech perception,
and is of key importance for an appropriate acquisition of the phonetic repertoire in infants since
birth. However, the extent to what newborns are capable of extracting pitch and formant structure
information from the temporal envelope and the temporal fine structure of speech sounds,
respectively, remains unclear. Here, we recorded the frequency-following response (FFR) elicited by a
novel two-vowel, rising-pitch-ending stimulus to simultaneously characterize voice pitch and formant
structure encoding accuracy in a sample of neonates and adults. Data revealed that newborns tracked
changes in voice pitch reliably and no differently than adults, but exhibited weaker signatures of
formant structure encoding, particularly at higher formant frequency ranges. Thus, our results indicate
a well-developed encoding of voice pitch at birth, while formant structure representation is maturing
in a frequency-dependent manner. Furthermore, we demonstrate the feasibility to assess voice pitch
and formant structure encoding within clinical evaluation times in a hospital setting, and suggest the
possibility to use this novel stimulus as a tool for longitudinal developmental studies of the auditory
system.
Spoken language is arguably the most prevalent form of human communication. Experimental evidence sug-
gests a universal organic basis for language acquisition, based on the identical development of speech perception
pathways observed across different populations, languages and cultures1–3. Speech perceptual skills have been
well characterized along the lifespan, especially with regard to their maturation during the first y ear4–6. However,
less is known about their functional state during the very first hours after birth, when humans newly encounter
the rich and challenging complexity of the external acoustic environment. A highly efficient auditory system
becomes hence a requisite for proper language acquisition, as the complex and dynamic acoustic signal of speech
conveys only very slight spectral and temporal cues for speech sound discrimination7.
Previous studies have shown that the auditory system of newborns and infants is able to handle several aspects
related to pitch processing, such as tracking pitch c ontours8–15, higher-order frequency direction r elationships16,
processing a missing f undamental17 or exhibiting relative pitch by discriminating transposed m elodies18,19. Like-
wise, the newborn auditory system appears able to discriminate p honemes20–22 even when only based upon
vowel formant structure changes or d uration20,23,24. And yet, the low level neural underpinning of these abilities
remains to be established.
Using non-invasive electroencephalography recordings, auditory brainstem responses (ABR) evoked to acous-
tic transients, such as click stimuli, have successfully been used to assess the integrity of the auditory pathway25–27.
However, periodic acoustic stimuli also elicit a particular brain response of subcortical and cortical origin, known
as the frequency-following response (FFR)28–30. The FFR reflects with high fidelity the encoding of periodic tem-
poral envelope modulations (FFRENV) and temporal fine structure harmonic constituents (FFRTFS) of a stimulus
(Aiken and Picton31 following the terminology proposed by Krizman and Kraus29). In language studies, these
1
Brainlab‑Cognitive Neuroscience Research Group, Department of Clinical Psychology and Psychobiology,
University of Barcelona, P. Vall d’Hebron 171, 08035 Barcelona, Catalonia, Spain. 2Institute of Neurosciences,
University of Barcelona, Barcelona, Catalonia, Spain. 3Institut de Recerca Sant Joan de Déu, Esplugues de
Llobregat, Catalonia, Spain. 4BCNatal‑Barcelona Center for Maternal Fetal and Neonatal Medicine (Hospital Sant
Joan de Déu and Hospital Clínic), University of Barcelona, Barcelona, Catalonia, Spain. *email: jcostafaidella@
ub.edu; cescera@ub.edu
Scientific Reports | (2021) 11:6660 | https://doi.org/10.1038/s41598-021-85799-x 1
Vol.:(0123456789)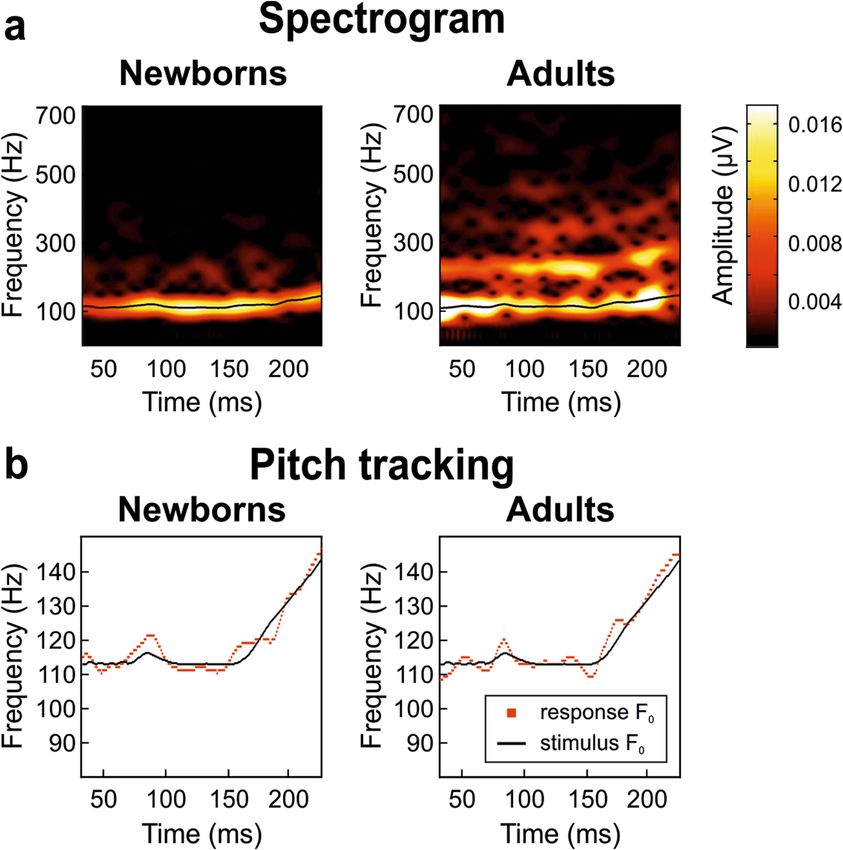
www.nature.com/scientificreports/
two components of the FFR have been respectively regarded as indexes of two perceptual properties of speech
sounds: voice pitch contour and formant structure29,31.
FFR recordings are increasingly considered a valuable tool to index the current functional state of the audi-
tory system and to predict the future development of l anguage32, since disruptions in the FFR elicited by speech
sounds relate to deficits in phonological awareness, reading impairments and d yslexia33–36. The potential of the
FFR as a biomarker for auditory deficits and their relation to literacy skills has thus been p roposed11,15,37–41.
However, most developmental studies on the FFR targeted babies of several months of age (e.g.,42–44), toddlers,
infants or years-old children (e.g.,37,40,44–49), with only a few published reports on n ewborns8–13,50. Thus, knowl-
edge about the expected speech perceptual skills in newborns, who are more vulnerable than older age groups
to hearing d amage3,15, may aid the early detection of language impairments and guide appropriate interventions
benefitting from the massive neural plasticity during the first years of life47,51–54.
Moreover, while newborn studies have focused on the assessment and maturation of pitch processing through
the analysis of the F FRENV, to date, none addressed formant structure encoding in a systematic m anner9,11,15.
To the best of our knowledge, only a recent study from our lab11, providing a normative newborn database of
FFRENV properties, attempted, as a secondary aim, to reveal whether the neonate auditory system was able to
discriminate sounds differing in their fine structure (/da/ vs. /ga/). While the results were negative, the appar-
ent lack of formant structure encoding may be due to several reasons: (a) the short duration of the consonant
transition (47 ms) and its formant change, which limit the resolution of the computed spectral information42;
(b) the high frequency content of the stimuli (/da/ F2 = 1438–1214 Hz, /ga/ F2 = 1801–1214 Hz), which elicits
diminished FFR amplitudes that are difficult to recognize55; (c) the fact that phase-locking to higher frequen-
cies develops later than to lower o nes39,42; and, ultimately, (d) the nature of the analyzed signal ( FFRENV), which
emphasizes temporal envelope information representation at the expense of temporal fine s tructure31. Thus,
it still remains unclear whether newborns cannot yet precisely track formant changes in complex sounds or if
stimulation parameters used so far were not suited to reveal this ability.
Furthermore, in newborn FFR research, time is of the essence. Recording time constraints determine what
stimulus encoding abilities can be studied, and it is even a more challenging issue when newborn research is
conducted in a hospital setting. In addition to the ease of waking up or disturbing sleep, the hospital environment
requires frequent and continuous access to the baby and the mother for routine tests to discard serious health
issues, interventions, in-depth health evaluations, and any other kind of neonatal care. Taking this into account,
it would be unsuitable to carry out recording sessions lasting between 4 023 and 5 08 min, typical of speech-sound
discrimination studies. The most adequate session duration would be between 20 and 30 m in40,42. Therefore,
devising a new single stimulus that would allow a proper assessment of both the F FRENV and FFRTFS simultane-
ously within recording times compatible with infant research is required. This would provide a snapshot of the
functional state of speech sound processing mechanisms at birth and, ultimately, help better understand how
the encoding of this complex auditory signal matures.
Thus, the aim of the present study was to characterize the functional maturity of voice pitch contour and
formant structure encoding mechanisms in the newborn population with non-invasive electrophysiological
recordings, using the adult population as a reference. To that end, we developed a novel speech stimulus that
allows the simultaneous assessment of both components of the speech signal through analyzing the F FRENV and
the FFRTFS, and which is at the same time compatible with clinical evaluation time constrains in a hospital setting.
FFRs were recorded to a novel two-vowel (/oa/) speech stimulus with a rising pitch ending. In order to esti-
mate voice pitch encoding from the temporal envelope of the recorded neural response, we computed the F FRENV
and analyzed it (spectral measures at the fundamental frequency [F0] peak; pitch tracking measures extracted
from stimulus-to-response cross-correlations and signal autocorrelations) accounting for the different steady and
rising pitch sections of the stimulus (both during the /a/ vowel). In order to estimate formant structure encoding
from the temporal fine structure of the recorded response, we computed the F FRTFS and analyzed it (spectral
measures at the first formant [F1] frequency peak) accounting for the different /o/ and /a/ vowel sections of the
stimulus (both during the steady pitch section)8–13,29,42,46,56.
Given that the human auditory system is able to encode changes in voice pitch with great precision starting
from the first days of l ife9, we would expect no significant differences between newborns and adults in spectral
amplitudes at F0 or in pitch tracking accuracy measures computed from the FFRENV. Because the capacity of
neurons in the auditory system to phase-lock their activity to higher sound frequencies develops later than to
lower ones and continues improving during the first year of life39,42, we would expect newborns to exhibit overall
smaller FFRTFS spectral amplitudes at F1 peak frequencies than adults. However, we had no clear hypotheses as
to whether the newborn FFRTFS would reflect a discriminative encoding of vowel formant structure as it does
in adults57 and, if so, whether that discriminative encoding would depend on F 1 center frequency. The evidence
suggesting that the newborn auditory system discriminates vowel c hanges20–24, is based upon recordings of event-
related potentials (ERPs) reflecting higher-order auditory system computations. But, the fundamentally different
nature of the FFR as a phase-locked neural response reflecting the acoustic waveform with high precision, and
the fact that this low-level encoding of acoustic features is immature at birth, at least for higher frequencies,
precluded us at this point to have strong hypotheses on the newborn’s auditory system’s capabilities.
Results
Temporal envelope-following responses ( FFRENV) and temporal fine structure-following responses ( FFRTFS)
elicited by a two-vowel syllable, rising-pitch ending, /oa/ stimulus (Fig. 1a) were collected from 34 newborns
and 18 adult participants. In order to assess voice pitch contour and formant structure encoding in depth, neural
responses were analyzed according to the sound features of the different stimulus sections. Below, we provide
descriptive statistics and comparisons for a comprehensive number of parameters extracted from the F FRENV
Scientific Reports | (2021) 11:6660 | https://doi.org/10.1038/s41598-021-85799-x 2
Vol:.(1234567890)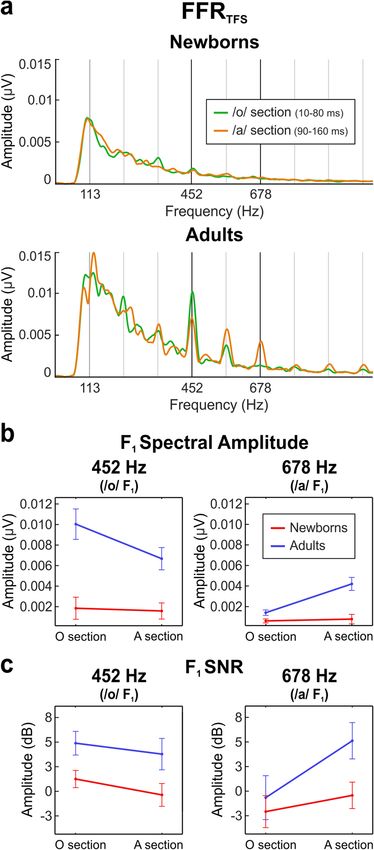
www.nature.com/scientificreports/
Figure 1. Temporal representation of the stimulus (a); FFRENV (b) and FFRTFS (c). (a) Time waveform (top)
and spectrogram of the /oa/ stimulus with schematic overlay of the formant structure trajectory (targeted F 0 and
F1 in solid lines; non-analyzed F 2 depicted in dotted line). (b) Grand averaged time-domain waveform of the
FFRENV from newborns (top red) and adults (bottom blue), obtained by averaging the neural responses to the
two stimulus polarities. (c) Grand averaged time-domain waveform of the F FRTFS from newborns (top red) and
adults (bottom blue), obtained by subtracting the neural responses to the two stimulus polarities.
and FFRTFS (see “Methods” for a detailed description). Statistically non-significant results can be found in Suppl.
Table 1.
Scientific Reports | (2021) 11:6660 | https://doi.org/10.1038/s41598-021-85799-x 3
Vol.:(0123456789)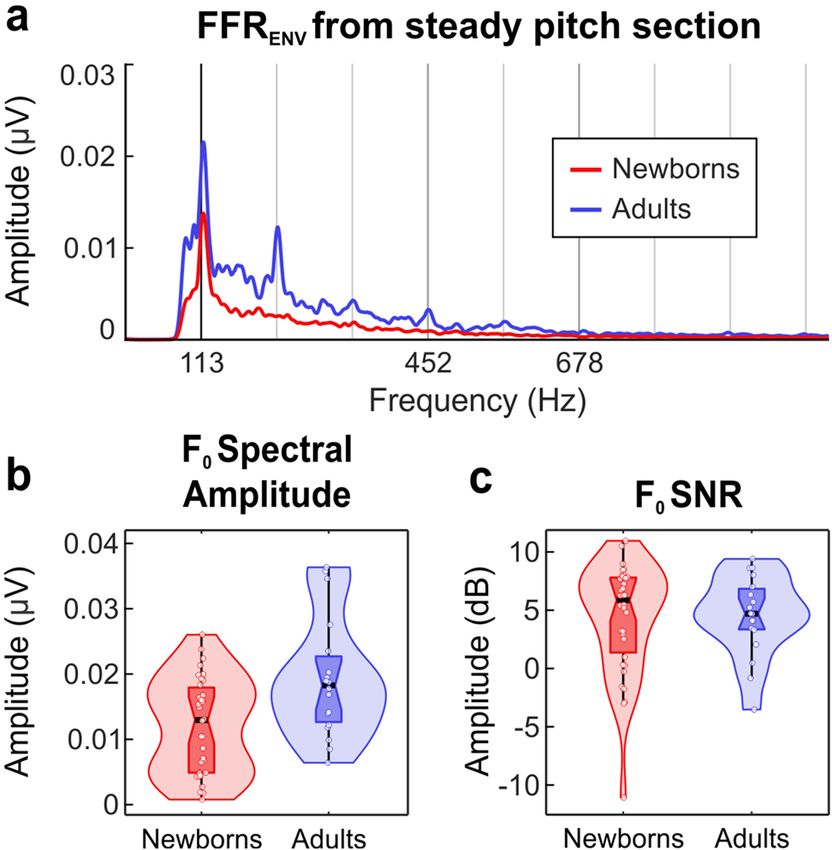
www.nature.com/scientificreports/
Measure Mean SD Median Q1 Q3 IQR Minimum Maximum
Neural lag (ms; from 10 to 250 ms)
Newborns 9.33 1.74 9.26 8.70 10.01 1.31 3.53 12.60
Adults 6.26 1.21 5.85 5.55 6.47 0.92 5.10 9.75
F0 spectral amplitude (µV; from 10 to 160 ms)
Newborns 0.01 0.01 0.01 < 0.01 0.02 0.01 < 0.01 0.03
Adults 0.02 0.01 0.02 0.01 0.02 0.01 0.01 0.04
F0 SNR (from 10 to 160 ms)
Newborns 4.36 4.72 5.86 0.82 7.83 7.01 −11.07 10.95
Adults 4.53 3.43 4.70 3.01 7.26 4.25 −3.52 9.40
/a/ steady section (90–160 ms)
Cross-correlation (Pearson’s r)
Newborns 0.18 0.06 0.18 0.12 0.23 0.11 0.06 0.30
Adults 0.20 0.05 0.20 0.17 0.23 0.07 0.07 0.27
Pitch error (Hz)
Newborns 11.66 7.15 10.18 5.64 16.55 10.90 2.76 28.73
Adults 9.45 3.40 9.77 6.45 12.07 5.63 3.27 15.29
Pitch strength (r)
Newborns 0.60 0.18 0.57 0.45 0.74 0.29 0.32 0.88
Adults 0.55 0.09 0.55 0.46 0.62 0.15 0.43 0.76
/a/ rising section (160–250 ms)
Cross-correlation (Pearson’s r)
Newborns 0.11 0.04 0.10 0.08 0.13 0.05 0.05 0.18
Adults 0.10 0.02 0.10 0.09 0.12 0.03 0.06 0.15
Pitch error (Hz)
Newborns 11.72 7.08 10.44 5.50 16.25 10.75 2.60 28.15
Adults 9.50 3.34 9.87 6.55 12.00 5.45 3.13 15.03
Pitch strength (r)
Newborns 0.60 0.18 0.56 0.45 0.74 0.29 0.32 0.88
Adults 0.55 0.09 0.55 0.46 0.61 0.15 0.44 0.75
Table 1. Descriptive statistics for FFRENV derived parameters: neural lag; F0 spectral amplitude and SNR
computed for the steady pitch section; stimulus-to-response cross-correlation, pitch error and pitch strength
computed separately for each section of the stimulus (/a/ steady section; /a/ rising section). SD standard
deviation, Q1 first quartile (25th percentile), Q3 third quartile (75th percentile), IQR interquartile range.
Neural transmission delay. Neural lag. Newborns showed a significantly longer neural lag (an estima-
tion of FFR latency) compared to adults (U(50) = 59, p < 0.001, Cohen’s d = 0.659). Descriptive statistics can be
found in Table 1.
Assessment of voice pitch encoding from FFRENV. In order to determine the strength of the repre-
sentation of the F0 and assess the accuracy in tracking F0 changes, our /oa/ stimulus was devised to feature a
steady pitch during its initial section (113 Hz; 0–160 ms) and a linearly increasing pitch during its final sec-
tion (113–154 Hz; 160–250 ms) (Fig. 1a). To accentuate the FFR components corresponding to the encoding of
the stimulus envelope (mainly the F 0) while suppressing those related to the fine structure, thus controlling for
vowel changes that occur along the different sections of the stimulus, we computed the FFRENV. Grand-average
FFRENV waveforms are shown in Fig. 1b for both groups separately (newborns and adults). All descriptive statis-
tics for FFRENV derived parameters can be found in Table 1.
Spectral amplitude at F 0 peak. The spectral amplitude at F
0 peak (113 Hz) during the steady pitch section of the
stimulus (10–160 ms) was calculated as an indicator of the magnitude of neural phase-locking at that specific
frequency49. Newborns exhibited significantly reduced spectral amplitudes at F 0 peak as compared to adults
(t(50) = − 3.079, p = 0.003, Cohen’s d = − 0.831). The corresponding amplitude spectra in the frequency domain
computed along the steady pitch stimulus section is shown in Fig. 2a. Figure 2b illustrates the distribution of F0
spectral amplitude values obtained for each group.
Signal‑to‑noise ratio. The signal-to-noise ratio (SNR) at F0 peak during the steady pitch section of the stimulus
was taken as an estimation of the relative spectral magnitude of the response. No significant group differences
were found. Figure 2c illustrates the distribution of F0 SNR values obtained per group.
Scientific Reports | (2021) 11:6660 | https://doi.org/10.1038/s41598-021-85799-x 4
Vol:.(1234567890)www.nature.com/scientificreports/
Figure 2. Amplitude FFRENV spectra (a) and data distributions (violin plots) of F0 spectral amplitude (b) and
F0 SNR (c) parameters extracted from the steady pitch section of the stimulus, by averaging the neural responses
to the two stimulus polarities from both groups separately. Scatter plots show all tested participants in each
group. In each plot, horizontal black line and vertical black line indicate the median and the interquartile range,
respectively.
Stimulus‑to‑response cross‑correlation. The stimulus-to-response cross-correlation was taken as a measure of
the accuracy with which the FFRENV reproduced the stimulus waveform, separately for the /a/ steady and /a/ ris-
ing pitch contour stimulus sections. Lower stimulus-to-response cross-correlation values were obtained during
the rising pitch section (mean ± SD; /a/ rising = 0.11 ± 0.03) as compared to the steady pitch section (mean ± SD;
/a/ steady = 0.18 ± 0.06) (Z = − 5.774, p < 0.001, Cohen’s d = 0.801). No significant group differences or group per
stimulus section interaction were found.
Pitch error. We then computed the pitch error per pitch section separately, in order to determine pitch-tracking
accuracy of the F0 contour11,29. Neither significant group or stimulus section differences nor group per stimulus
section interaction were found (see Fig. 3a for spectrogram and Fig. 3b for pitch track).
Pitch strength. Pitch strength was taken as a measure of periodicity and the magnitude of neural phase-locking
of the response10 and was also computed separately per stimulus pitch section. Neither significant group or
stimulus section differences nor group per stimulus section interaction were found.
Assessment of formant structure encoding from FFRTFS. In order to determine the ability of the par-
ticipants to encode the formant structure of speech sounds, the /oa/ stimulus featured two sections with steady
pitch but differing in their formant structure: the /o/ section (10–80 ms; F 1 = 452 Hz) and the /a/ steady pitch
section (90–160 ms; F1 = 678 Hz). In order to emphasize temporal fine structure components of the response
while diminishing the contribution of responses to the temporal envelope, we computed the F FRTFS29,31. Grand-
average FFRTFS waveforms are shown in Fig. 1c for both groups separately. The frequency spectrum of the /o/
section and the /a/ steady pitch section are shown in Fig. 4a for both groups. All descriptive statistics can be
found in Table 2.
Spectral amplitudes and SNRs from the F FRTFS were retrieved separately from neural responses during the
/o/ section (10–80 ms) and the /a/ steady pitch section (90–160 ms), selecting the spectral peaks corresponding
to stimulus F 1 frequencies (452 Hz [/o/] and 678 Hz [/a/]), as indicators of the magnitude (absolute and relative)
of phase-locking at the selected frequencies.
Spectral amplitude at /o/ vowel F1. Spectral amplitudes at the /o/ vowel F 1 (452 Hz) are illustrated in Fig. 4b
(left). A main effect of group revealed significantly smaller spectral amplitudes at 452 Hz in newborns as com-
pared to adults ( F(1,50) = 85.778, p < 0.001, ηp2 = 0.632). A main effect of stimulus section showed a significantly
larger spectral amplitude value at 452 Hz during the /o/ vs. /a/ steady pitch sections (F(1,50) = 25.529, p < 0.001,
ηp2 = 0.338). The group per stimulus section interaction was significant as well (F(1,50) = 18.603, p < 0.001,
ηp2 = 0.271). Post-hoc tests computed to determine the direction of the interaction revealed higher spectral
Scientific Reports | (2021) 11:6660 | https://doi.org/10.1038/s41598-021-85799-x 5
Vol.:(0123456789)www.nature.com/scientificreports/
Figure 3. Spectrogram (a) and pitch tracking (b) extracted from the newborns (left) and adults (right) F FRENVs
grand averages elicited by /oa/ stimulus. (a) The color scale from white to black represent the spectral amplitude
in µV; dark colors represent smallest amplitude values, while light ones represent the highest. (b) F0s extracted
from the stimulus is represented in solid black line, F0s extracted from the FFRENVs elicited by the stimulus
depicted in dotted red line.
amplitudes in adults at 452 Hz during the /o/ vs. /a/ sections ( t(17) = 3.803, p = 0.001, Cohen’s d = 0.896), but no
significant differences were found in newborns.
Spectral amplitude at /a/ vowel F 1. Spectral amplitudes at the /a/ vowel F1 (678 Hz) are illustrated in Fig. 4b
(right). A main effect of group revealed significantly smaller spectral amplitudes at 678 Hz in newborns as com-
pared to adults ( F(1,50) = 79.157, p < 0.001, ηp2 = 0.613). A main effect of stimulus section showed a significantly
larger spectral amplitude value at 678 Hz during the /a/ steady pitch vs. /o/ sections (F(1,50) = 64.555, p < 0.001,
ηp2 = 0.564). The group per stimulus section interaction was significant as well (F(1,50) = 50.252, p < 0.001,
ηp2 = 0.501). Post-hoc tests computed to determine the direction of the interaction revealed higher spectral
amplitudes in adults at 678 Hz during the /a/ steady pitch vs. /o/ sections (t(17) = − 5.845, p < 0.001, Cohen’s d = −
1.378), but no significant differences were found in newborns.
SNR at /o/ vowel F1. SNR values at the /o/ vowel F1 (452 Hz) are illustrated in Fig. 4c (left). A main effect of
group revealed significantly smaller SNR values at 452 Hz in newborns as compared to adults ( F(1,50) = 47.213,
p < 0.001, ηp2 = 0.486). A main effect of stimulus section showed a significantly larger SNR value at 452 Hz dur-
ing the /o/ vs. /a/ steady pitch sections (F(1,50) = 4.207, p = 0.046, ηp2 = 0.078). No significant group per stimulus
section interaction was found.
SNR at /a/ vowel F 1. SNR values at the /a/ vowel F1 (678 Hz) are illustrated in Fig. 4c (right). A main effect of
group revealed significantly smaller SNR values at 678 Hz in newborns as compared to adults ( F(1,50) = 17.136,
p < 0.001, ηp2 = 0.255). A main effect of stimulus section showed a significantly larger SNR value at 678 Hz dur-
ing the /a/ steady pitch vs. /o/ sections ( F(1,50) = 15.414, p < 0.001, ηp2 = 0.236). The group per stimulus section
interaction was significant as well (F(1,50) = 4.753, p = 0.034, ηp2 = 0.087). Post-hoc tests computed to determine
Scientific Reports | (2021) 11:6660 | https://doi.org/10.1038/s41598-021-85799-x 6
Vol:.(1234567890)www.nature.com/scientificreports/
Figure 4. Formant structure encoding in newborns and adults. (a) Amplitude FFRTFS spectra extracted from
the /o/ vowel section (green) and the /a/ vowel section (orange) from the stimulus, plotted separately for
newborns (top) and adults (bottom). (b) Main effects graphic of F1 spectral amplitude at 452 Hz (left) and
678 Hz (right) during the /o/ vowel section and the /a/ vowel section, plotted in red and blue lines for newborns
and adults, respectively. (c) Main effects of F1 SNR at 452 Hz (left) and 678 Hz (right) during the /o/ vowel
section and the /a/ vowel section, depicting neural responses from newborns (red) and adults (blue).
the direction of the interaction revealed higher SNR values in adults at 678 Hz during the /a/ steady pitch vs. /o/
sections (t(17) = − 5.656, p < 0.001, Cohen’s d = − 1.333), but no significant differences were found in newborns.
It should be noted that some SNR values, especially those of newborns at 678 Hz peak, were very close to zero.
In order to ascertain whether there was a measurable signal when expected (at 452 Hz during the /o/ section and
at 678 Hz during the /a/ section), we submitted the SNR values, per group and per condition separately, to one-
tailed, one sample t-tests against zero. Results demonstrated that newborns had a measurable signal for lower
Scientific Reports | (2021) 11:6660 | https://doi.org/10.1038/s41598-021-85799-x 7
Vol.:(0123456789)www.nature.com/scientificreports/
Measure Mean SD Median Q1 Q3 IQR Minimum Maximum
Spectral amplitude /o/ section at 452 Hz (µV)
Newborns 0.0019 0.0010 0.0017 0.0010 0.0024 0.0014 0.0004 0.0053
Adults 0.0100 0.0052 0.0087 0.0065 0.0134 0.0069 0.0030 0.0211
Spectral amplitude /a/ steady section at 452 Hz (µV)
Newborns 0.0016 0.0011 0.0014 0.0006 0.0022 0.0016 0.0002 0.0046
Adults 0.0067 0.0036 0.0068 0.0034 0.0091 0.0057 0.0011 0.0145
Spectral amplitude /o/ section at 678 Hz (µV)
Newborns 0.0006 0.0004 0.0005 0.0004 0.0008 0.0004www.nature.com/scientificreports/
available to a fetus during the gestation period are dominated by a low frequency content (< 500 Hz5,67–69), while
higher frequency ranges, which characterize most of the temporal fine structure of speech46,70, would only be
fully available at birth. Indeed, neonates may base their preferences on pitch contours and slow temporal dynam-
ics, features available during pregnancy71–73. Furthermore, albeit previous studies have shown neural signatures
of vowel change detection for vowel pairs differing only in second formant (F2) frequencies in n ewborns20 and
6 months-old babies74, recent electrophysiological5 and behavioral75 evidence suggests that infant vowel dis-
crimination relies more strongly on F 1 (usually below 800 Hz) than F 2 frequency differences. For instance, in a
comprehensive study, McCarthy et al.5 analyzed neural responses to vowel changes using all pairs of a set of 7
English vowels, and showed that phonetic development from 4 to 11 months-old exhibits an increasing sensi-
tivity to higher-frequency acoustic information (i.e., infants progressively rely less on F 1 changes and more on
F2 changes). Importantly, while youngest infants (4–5 months-old) neural responses appeared to reflect vowel
acoustics (i.e., larger acoustic changes were reflected by larger neural response changes), those from older infants
(10–11 months-old) seemed to represent putatively categorical changes (i.e., vowel space maps recreated from
neural data showed large differences between vowel pairs with small acoustic differences). Intriguingly, a close
inspection of their data (particularly at Fig. 4) strongly suggests that vowel pairs with lower F1 frequency content
(//ᴐ// vs. /u/; < 500 Hz) are represented in youngest infants’ vowel space farther apart from each other than vowel
pairs with higher F1 frequency content (/a/ vs. /ε/; > 500 Hz), a pattern not apparent in older infants. However,
the authors did not explicitly test this hypothesis. In fact, to the best of our knowledge, there is no behavioral or
neurophysiological study in newborns or young infants explicitly testing vowel discrimination as a function of
formant frequency. This may constitute an exciting avenue for future research linking auditory neural responses
to auditory pathway and vowel discrimination development.
Regarding our data, in view of the above and taking into account that 1) the chosen first formants of our
stimulus fall below (/o/ F 1) and above (/a/ F
1) the 500 Hz filter cut-off; 2) FFR spectral amplitudes increase with
age57; 3) FFR spectral amplitudes diminish along the frequency a xis55; and 4) FFRs are plastically modulated by
experience9,51,57,68, it appears reasonable to expect certain degree of response in newborns at the lower frequency
formant (452 Hz) and a fast decay of spectral power at the higher frequency formant (678 Hz). In any case, it
seems plausible that certain speech sound processing skills were already mature at birth due to a greater exposure
during pregnancy, while others would still be undeveloped.
Functional maturity state differences across speech perceptual skills at birth. A first indicator
of auditory system’s functional maturity is auditory transmission delay76,77. Measuring wave V latencies and
stimulus-to-response neural lags (which were consistent with activity generated in the brainstem76) we found, in
agreement with previous literature, shortened delays in adult participants, which may be due to the increasing
myelination and age-related changes in synaptic function13,42,43,53.
However, even with a still maturing transmission speed, our results demonstrate that newborns accurately
encode the F0 of speech sounds as well as track changes in voice pitch during immediate postnatal hours, in line
with previous s tudies8–13. Although spectral amplitudes at the F 0 peak were smaller in newborns as compared
to adults, no significant differences were found with the adult sample when choosing relative amplitude meas-
urements (i.e., SNR). Thus, the higher spectral amplitude values for adults could be due to the fact that, even
during the pre-stimulus period, they also presented a higher spectral noise level (pre-stimulus root mean square:
newborns = 0.03 ± 0.01 µV; adults = 0.05 ± 0.02 µV; U(50) = 571, p < 0.001).
On the other hand, our results indicate a differential processing of formant structure in newborns in com-
parison to adults. Similar to the results on the FFRENV, neonates showed significantly smaller FFRTFS absolute
spectral amplitude values, but also smaller relative measures such as the SNR. However, our data demonstrate
that newborns can encode the fine structure of speech sounds to a certain extent, with some limitation for
higher frequency ranges, as evidenced by the fact that their SNR values were higher at 452 Hz (/o/ F1) during
the /o/ section than during the /a/ section, but at 678 Hz (/a/ F1) they were not significantly different from zero.
Although the SNR at 678 Hz during the /o/ section was negative in newborns, when analyzing the amplitude of
the frequency spectrum (Fig. 4a) we observed that spectral amplitudes at 678 Hz during either of the two sections
were very weak. Because of the reduced spectral amplitude and its large standard deviation, we considered this
negative value as negligible, probably due to a noisy signal at higher frequencies rather than to active inhibition.
We considered the possibility that our results regarding formant structure encoding could be influenced by
the internal structure of the stimulus, i.e., the /o/ section always preceded the /a/ section. As infants and neonates
seem to preferentially use rhythmic cues to segment syllables and words from the acoustic stream78,79, newborns
may be more sensitive to sound onsets than codas. According to the temporal sampling framework hypotheses,
put forward by Goswami80, rhythmic amplitude envelope modulations would entrain cortical oscillatory activity
to exert a preferential processing of syllable onsets. However, there is no obvious reason why such preferential
onset processing should be apparent only at formant structure encoding and not at pitch encoding. Therefore,
in order to shed some light on this possible confounding factor, we decided to statistically compare the SNR
values at F0 during the /o/ steady pitch section (10–80 ms) vs. the /a/ steady pitch section (90–160 ms), using a
paired-samples t-test for each group of age. Our results showed that there were no significant differences in the
SNR values at F 0 between stimulus steady pitch sections for either of the two groups (newborns: t (33) = − 1.466,
p = 0.152, Cohen’s d = -0.251; adults: t(17) = 0.797, p = 0.436, Cohen’s d = 0.188; for further statistical information,
the reader is referred to Suppl. Table 1). Thus, no onset effect in pitch encoding was observable in any group.
Moreover, given the rhythmic stimulation used in our study (SOA = 295 ms), half cycle of an entrained oscilla-
tion would last enough to cover, with the high excitability phase, both /o/ and /a/ steady pitch sections of our
stimulus. Furthermore, the high frequency ranges we are dealing with in our FFR data (beyond 100 Hz) are
more prone to elicit recordable subcortical activity than c ortical81–83, and the modulation of phase-locking in
Scientific Reports | (2021) 11:6660 | https://doi.org/10.1038/s41598-021-85799-x 9
Vol.:(0123456789)www.nature.com/scientificreports/
subcortical neuronal ensembles by cortical oscillations has not been described, to the best of our knowledge,
in the literature. Finally, in our study, the adult F FRTFS SNR values at the formant peaks showed a double dis-
sociation, being larger at the /o/ F 1 frequency during the /o/ section and at the /a/ F 1 frequency during the /a/
section, ruling out any onset effect. Therefore, given the pattern of results and the reviewed literature, an onset
effect seems a negligible influencing factor in our results. In any case, further research studying the influence of
vowel order should be carried out to help better clarify this possible confound (e.g., presenting an /ao/ syllable
and comparing the pattern of results).
These results thus agree with the abovementioned notion that, due to the low-pass filter characteristics of the
womb, fetuses are probably isolated from the mid and high frequency acoustic content of external sounds that
characterizes most of the temporal fine structure of s peech46,70. Yet, while lacking the required prior experience
for a mature perceptual system responding accurately to high frequencies, the ability to encode fine structure
per se seems to be present at birth. Future testing with premature babies early exposed to natural sounds may
shed more light on this issue.
Overall, our results are in line with the idea that humans, despite their limited experience to speech at birth,
present mature functional mechanisms to detect changes in speech features at an unexpectedly early a ge8,84, and
since alterations in the neural mechanisms underlying temporal envelope encoding are associated to several
disabilities such as autism48, dyslexia70 or other learning problems33, it is tempting to speculate that the encod-
ing of temporal envelope information, such as its periodicity, may play a crucial role in the very first stages of
language acquisition8. Temporal envelopes could provide a neural synchrony channel onto which separate neural
representations of other speech features would anchor as parts of an ensemble that would, ultimately, give rise
to a coherent unitary entity85. Furthermore, there is increasing evidence that the FFR is a brain response that
receives subcortical and cortical contributions in a frequency-specific manner, with frequencies below 150 Hz
originating mainly from subcortical s ources30,82,83,86,87. Therefore, it is tempting to speculate that the effects
observed here may reflect the increasing maturation of the subcortical auditory system from birth to adulthood.
The reported differences in formant structure encoding abilities found between newborns and adults open
a window of opportunity to study the developmental progression of these skills. Considering that the gradual
increase of phase-locking to high-frequencies is age-dependent42, understanding how inter-individual differences
in development as revealed by FFRTFS neural responses relate to the acquisition of formant encoding perceptual
skills could be used to identify potential risks of future disabilities. Early impairment detection is thus critical
to allow early interventions and to maximize the development of speech and listening competences, essential
requirements for the acquisition of optimal literacy skills15.
Considerations on speech stimuli commonly used for newborn FFR studies. In language FFR
studies, the most commonly applied speech stimuli are mandarin syllables following the four different lexi-
cal tones8,13,48,51,52,88,89, and different single vowels with rising p
itch9,10,43,90. The use of these stimuli focused the
research field on assessing voice pitch encoding, putting the assessment of formant structure encoding aside.
A notable exception is the widely used consonant–vowel syllable /da/11,14,42,44,45,49,56,91,92, which contains a fine
structure change during the consonant–vowel transition. The relevance of using this stimulus relies on the fact
that stop consonants are an important constraint in populations with literacy impairments93, and since stop
bursts are rapid and low in amplitude in the /d/ consonant compared to vowels, even normal-hearing adults
and children can find difficult to discriminate it from other contrastive stop consonants28. However, the short
duration of the consonant transition and the high (and changing) frequency peak of the formants that compose
it (e.g., the difference between /d/ and /g/ appears in the second formant: /da/ F2 = 1438–1214 Hz, /ga/ F2 = 1801–
1214 Hz), render this type of stimuli suboptimal in the characterization of FFR responses, which exhibit a spec-
tral power decay with increasing frequency55, especially in populations with an immature encoding of the high
frequency content of sounds, such as n ewborns39,42. Hence, while the phase locking to lower frequency sounds
could in principle be safely assessed from the first hours of life42,50 as we demonstrate here as well, the lack of
prenatal experience to the high frequency content of sounds and the requirement of a later and greater matura-
tion of the auditory system to encode them39,42,46,50 pose some limitations in the design of stimuli suited to study
formant structure encoding.
Therefore, we believe our newly designed /oa/ stimulus, with pitch variation and two vowel sections with
different formant structure based on relatively lower frequency harmonic components and suitable durations
for accurate spectral analyses, enables a proper assessment of speech sound temporal envelope ( FFRENV) and
temporal fine structure ( FFRTFS) encoding.
Conclusion
The present study provides the first evidence that neonates are able to encode not only the voice pitch of speech
sounds and its changes with great accuracy, as has been demonstrated in previous research, but also the formant
structure. Specifically, newborns show emerging formant structure encoding skills at lower frequency ranges but
still immature encoding precision at higher frequency ranges. In addition, having already proved the feasibility
of successfully recording temporal envelope and temporal fine structure in newborns, we here promote the use
of this new stimulus as a powerful tool to perform a longitudinal assessment of speech encoding in babies from
their very first hours of life throughout the first years of infant development.
Methods
Participants. A sample of 34 healthy term newborns (17 females; mean gestational age = 40.19 ± 1.08 weeks;
mean birth weight = 3379 ± 289 g; aged 14–78 h after birth) was recruited from Sant Joan de Déu Hospital in
Barcelona (Spain). Obstetric pathologies, high-risk gestations and risk factors related to hearing impairments
Scientific Reports | (2021) 11:6660 | https://doi.org/10.1038/s41598-021-85799-x 10
Vol:.(1234567890)www.nature.com/scientificreports/
(according to the criteria of the Joint Committee of Infant H earing94) were considered excluding factors. All
newborns had Apgar scores higher than 8 at 1 and 5 min of life and had passed the standardized hearing screen-
ing test based on the automated auditory brainstem response system (ALGO 3i, Natus Medical Incorporated,
San Carlos, CA). Six additional newborns were attempted to be recorded but finally not included in the study
because they woke up before concluding the recording session, and it was not possible to help them falling asleep
again.
Additionally, 18 healthy young adult participants (14 females; mean age = 26.94 ± 3.78 years) with no self-
reported history of neurological, psychiatric or hearing impairment, and with normal or corrected-to-normal
visual acuity were included in the study for comparison. Taking into account previous research showing no
differences between sexes for the encoding of frequencies until 720 Hz95,96, chances that data extracted from
our selected range of analyzed frequencies (up to 678 Hz) were affected by sex condition were low. All partici-
pants underwent a screening pure tone audiometry to ensure a normal hearing level at 250, 500, 1000, 2000
and 4000 Hz. Excluding factors were mean hearing thresholds above 25 dB sound pressure level (SPL) or mean
interaural hearing threshold differences larger than 20 dB SPL.
Both newborns and adults underwent a standard click-evoked auditory brainstem response test employing
a standard SmartEP platform (Intelligent Hearing Systems, Miami, Fl, USA), with a 100 µs square-wave click
stimulus delivered at 65 dB SPL for adults and 60 dB SPL for newborns. Following the precedent of Jeng et al.97,
differences in stimulus intensities were chosen to compensate for the smaller ear canal volumes observed in
young infants98,99. All participants included in the sample had a reliably identifiable wave V. The mean latency
of wave V was 8.70 (± 0.42 SD) ms for newborns and 6.54 (± 0.39 SD) ms for adults, and its mean amplitudes
were 0.13 (± 0.08 SD) µV for newborns and 0.29 (± 0.12 SD) µV for adults (Suppl. Fig. 1). All these values were
comparable to those published previously11,100.
The study was approved by the Ethical Committee of Clinical Research (CEIC) of the Sant Joan de Déu
Foundation (Approval ID: PIC-53-17) and the Bioethics Committee of the University of Barcelona, and all adult
participants and newborns’ legal guardians gave informed consent in compliance with the Code of Ethics of the
World Medical Association (Declaration of Helsinki). The data that support the findings of this study and the
code used for data analysis are available upon reasonable request to the authors.
Stimulus. Inspired by the aforementioned previous stimuli limitations (e.g., short duration of consonant
transitions and changing formants, high frequency content), a 250 ms two-vowel syllable stimulus with a rising
pitch ending (/oa/) was created in Praat101 (Fig. 1a). The /o/ vowel section (F1 = 452 Hz; F2 = 791 Hz) lasted from
0 to 80 ms, the /a/ vowel section (F1 = 678 Hz; F2 = 1017 Hz) from 90 to 250 ms, and the /oa/ formant transition
section from 80 to 90 ms. Stimulus pitch was kept steady at F0 = 113 Hz from 0 to 160 ms and increased linearly
up to 154 Hz from 160 to 250 ms. We used 113 Hz F 0 instead of the common 100 Hz F 0 to avoid electric line noise
harmonics by the European 50 Hz alternating current11. In order to maximize the detection of differences in
vowel formant encoding in the FFRTFS, formant peak frequencies coincided with harmonics of the fundamental.
Stimuli were delivered monaurally to the right ear with a stimulus-onset asynchrony (SOA) of 295 ms, in
alternating polarities, at an intensity of 65 dB SPL for adults (Etymotic shielded earphones of 300 Ω, ER, Elk
Grove Village, IL, USA) and 60 dB SPL for newborns (same earphones connected to a Flexicoupler disposable
adaptor, Natus Medical Incorporated, San Carlos, CA) using Intelligent Hearing Systems (Miami, Fl, USA). Dif-
ferences in stimulus intensities were chosen for the same reason as in click stimulus.
Procedure. All newborns were recorded at the hospital room where they were resting with their mother.
After the neonate passed the universal hearing screening test, the researcher started the recording session as
soon as the newborn fell asleep, interrupting it to any sign of discomfort or sleep disruption and resuming it
when the newborn was asleep again. The total mean duration of a test session was approximately 25 min (two
click blocks × 2000 sweeps × 51.81 ms SOA, plus four /oa/ stimulus blocks × 1000 sweeps × 295 ms SOA, plus the
duration of rejected sweeps), plus recording preparation time (around 5 min). Adult participants were tested
in an acoustically shielded chamber in a laboratory facility located at the University of Barcelona, following the
same procedure as in newborns with the exception of being awake with their eyes closed. Taking into account
that the analyzed frequency content of neural responses recorded in the present study belongs to a higher fre-
quency range than those characteristic of cortical sources (beyond 100 H z81), and that attentional modulations
30,86,102,103
of the FFR seemingly affect only cortical sources , we can consider the contribution of alertness as a
confounding factor in our results to be rather weak.
Data acquisition. FFRs were recorded from both newborns and adults with a SmartEP platform including
the cABR and Advanced Hearing Research modules connected to a Duet amplifier (Intelligent Hearing Systems,
Miami, Fl, USA), using three disposable snap Ag/AgCl electrodes placed in a vertical montage (ground electrode
at the forehead; active at Fpz; online reference at the right mastoid, ipsilateral to the stimulated ear). All electrode
impedances were kept < 7 kΩ. The continuous signal was acquired at a sampling rate of 13,333 Hz with an online
bandpass filter from 30 to 1500 Hz and epoched from − 40.95 (pre-stimulus period) to 249.975 ms relative to
stimulus onset. A total of 4000 artifact-free responses were obtained for each participant after automatic rejec-
tion of any sweep with voltage values exceeding ± 30 µV.
FFR processing. Data was bandpass filtered offline from 80 to 1500 Hz. In order to assess voice pitch encod-
ing, it was necessary to accentuate the FFR components corresponding to the encoding of the stimulus envelope,
such as the fundamental frequency ( F0). Thus, neural responses were averaged by adding sweeps correspond-
ing to the two stimulus polarities [(Rarefaction + Condensation)/2], yielding the envelope-following response
Scientific Reports | (2021) 11:6660 | https://doi.org/10.1038/s41598-021-85799-x 11
Vol.:(0123456789)www.nature.com/scientificreports/
(FFRENV). This procedure also aids in minimizing the contribution of putative cochlear microphonics. On the
other hand, to properly evaluate formant structure representation, it was necessary to emphasize the FFR com-
ponents highlighting the encoding of the stimulus temporal fine structure, such as vowel formants ( F1, F2), and
minimize the contribution of activity related to the envelope. To this aim, the responses to stimuli of alternat-
ing polarities were subtracted [(Rarefaction–Condensation)/2], yielding the temporal fine structure-following
response (FFRTFS)29,31. In this study, only the FFRTFS spectral peaks corresponding to F
1 frequencies were ana-
lyzed, since those from F2 frequencies belonged to a very high frequency range that elicits weak neural responses
difficult to record and, therefore, could not be reliably observed in all participants, especially in newborns. All
data were analyzed using MATLAB R2019b104.
FFR parameters and statistical analysis. To give a comprehensive description of FFR properties both
in newborns and adults, we computed several parameters, which we briefly detail below (see Ribas-Prats et al.11
for a full description of procedure, scripts and routines). All statistical analyses were performed on SPSS 25.0105.
Descriptive statistics are shown as mean, standard deviation (SD), median, first (Q1) and third ( Q3) quartiles,
interquartile range (IQR), and minimum and maximum values of the parameters for each group of age. The
Kolmogorov–Smirnov test with the Lilliefors’ significance correction was selected to check the normal distribu-
tion of the samples. Results were considered significant when p < 0.05. Contrast statistics, as well as p values and
effect sizes obtained from statistically significant comparisons are reported in the Results sections. Statistically
non-significant results and normality tests are reported in Suppl. Table 1.
Neural transmission delay. Neural lag. Neural lag was taken as an estimation of FFR latency due to the
auditory system’s neural transmission delay11, and was extracted from a cross-correlation of the entire stimulus
with the neural response (10–250 ms), selecting the time lag that corresponds to the maximum cross-correlation
value. The obtained values were non-normally distributed, so a Mann–Whitney U test was used to assess for
significant group differences (i.e., whether newborns showed a different transmission delay than adults).
Voice pitch encoding. To determine the abilities of newborns (by comparison with adults) to encode the
voice pitch contour of the auditory stimulus presented, several parameters were extracted from the F
FRENV:
Spectral amplitude at F0 peak. Spectral amplitude at F 0 peak (113 Hz) was calculated as an indicator of the mag-
nitude of neural phase-locking at that specific frequency49 only during the steady pitch section of the stimulus
(10–160 ms), due to the continuous variation in pitch frequency throughout the rising section (160–250 ms).
Since the obtained values were normally distributed, we employed a two-samples T-test to assess for significant
group differences (i.e., whether newborns showed different spectral amplitudes of the signal at F0 peak than
adults).
Signal‑to‑noise ratio. Signal-to-noise ratio (SNR) at F0 peak was taken as an estimation of the relative spectral
magnitude of the response, taking into account not only the amplitude value of the signal at the frequency peak
of interest (113 Hz) but also around that peak. Therefore, we divided the mean amplitude within a ± 5 Hz fre-
quency window centered at the peak of the frequency of interest (F0) by the mean amplitude within two 28 Hz
wide frequency windows (flanks) centered at ± 19 Hz from the frequency of interest (e.g., for F0 = 113 Hz, the
mean amplitude from 108 to 118 Hz divided by the average of the mean amplitude from 80 to 108 Hz and the
mean amplitude from 118 to 146 Hz). In order to ascertain group differences in the magnitude of the F 0 encod-
ing and discern whether newborns had different responses to voice pitch than adults, we used Mann–Whitney
U tests because the obtained values were non-normally distributed.
Stimulus‑to‑response cross‑correlation. In order to assess the accuracy with which the F FRENV reproduces the
stimulus waveform, we calculated the normalized cross-correlation between each individual’s neural response
and the stimulus, separately for the /a/ steady (90–160 ms) and /a/ rising pitch contour stimulus sections (160–
250 ms)29. The maximum value reached within a time lag of 3 to 10 ms (corresponding to the neural lag) was
selected (Pearson’s r; values from − 1 to 1). The obtained values were non-normally distributed. Therefore, to test
for putative between-subjects differences (i.e., whether newborns showed a different overall stimulus–response
correlation than adults), a Mann–Whitney U test was used, with Age (newborns; adults) as grouping variable
and Stimulus Section (/a/ steady; /a/ rising) as contrast variable. To test for putative within-subjects differences
(i.e., whether stimulus–response correlations were different depending on stimulus pitch contour), a Wilcoxon
test for two related samples comparing the correlation values obtained for each stimulus section (/a/ steady; /a/
rising) was used. Finally, to test for a putative interaction between factors (i.e., whether newborns showed a dif-
ferent correlation value depending on stimulus pitch section than adults), a Mann–Whitney U test was used tak-
ing Age (newborns; adults) as grouping variable and the difference between the two conditions of the Stimulus
Section (/a/ steady – /a/ rising) as contrast variable.
We also computed the normalized autocorrelation of the neural response, as well as that of the stimulus, in
40 ms sliding bins, to extract pitch error and pitch strength values.
Pitch error. Pitch error per stimulus section was used to determine pitch-tracking accuracy of the F 0 contour11,29
(corresponding to the autocorrelation peak lag per bin) by averaging the absolute Euclidian distance between the
stimulus F0 contour and the response F0 per pitch section separately (steady [10–160 ms]; rising [160–250 ms];
starting from the onset of the section + the individual neural lag; values in Hz). Since obtained values were non-
Scientific Reports | (2021) 11:6660 | https://doi.org/10.1038/s41598-021-85799-x 12
Vol:.(1234567890)www.nature.com/scientificreports/
normally distributed, to determine between-subject effects, within-subjects effects and interaction, we followed
the same procedure as with the stimulus-to-response cross-correlation explained above.
Pitch strength. Pitch strength per stimulus section was taken as a measure of periodicity and the magnitude of
neural phase-locking of the response10, and calculated by averaging the obtained peak autocorrelation value of
the response across bins, per pitch section separately (steady; rising; starting from the onset of the section + the
individual neural lag; values from − 1 to 1). Values were non-normally distributed, thus an identical method
with the same factors as employed above in cross-correlation and pitch error parameters was used to determine
between-subject effects, within-subjects effects and interaction.
Formant structure encoding. Regarding the encoding of the perceptual quality of formant structure,
several parameters were retrieved from the FFRTFS.
Spectral amplitude. Spectral amplitudes at spectral peaks corresponding to stimulus F1 frequencies (452 Hz
[/o/] and 678 Hz [/a/]) were retrieved separately from neural responses to the /o/ section (10–80 ms) and the /a/
steady section (90–160 ms). All values were normally distributed, so an ANOVA test was conducted. Regarding
the spectral amplitude at 452 Hz, (a) the Group variable (newborns; adults) was chosen as between-subjects
factor, to examine whether newborns showed different amplitude values at 452 Hz than adults; (b) Stimulus
Section (/o/ section; /a/ section) as within-subjects factor, in order to test whether spectral amplitudes at 452 Hz
were different depending on stimulus vowel section; (c) Interaction between factors was analyzed to ascertain
whether newborns showed a different amplitude value at 452 Hz depending on stimulus vowel section than
adults. Pursuing an identical purpose, we conducted again the same test to examine differences at 678 Hz. The
transition from /o/ vowel to /a/ vowel was not analyzed due to its short duration (10 ms).
Signal‑to‑noise ratio. Following the same procedure as with the spectral amplitude, SNRs at spectral peaks
corresponding to stimulus F1 frequencies (452 Hz [/o/] and 678 Hz [/a/]) were also retrieved separately from
responses to the /o/ and the /a/ steady section, using an identical method to calculate it as described above for
the FFRENV. All values were normally distributed, so ANOVA tests on 452 Hz and 678 Hz were conducted with
the same factors and objectives as described above for F1 spectral amplitudes analyses.
All analyses were additionally computed by excluding participants with extreme values (more than three
interquartile ranges; N = 9; 4 newborns + 5 adults). As the statistical results obtained did not alter the main find-
ings of the study, we decided to keep all participants within the reported analyses to better represent the inherent
variability of our samples (results excluding extreme values are reported in Suppl. Tables 2–7).
Received: 14 September 2020; Accepted: 4 March 2021
References
1. Kuhl, P. K. Early language acquisition: Cracking the speech code. Nat. Rev. Neurosci. 5, 831–843 (2004).
2. Hoff, E. Language development at an early age: Learning mechanisms and outcomes from birth to five years. Encycl. Early Child.
Dev. 7–10 (2009).
3. Sket, G. M. et al. Neonatal white matter maturation is associated with infant language development. Front. Hum. Neurosci. 13
(2019).
4. Zubiaurre-Elorza, L. et al. Auditory structural connectivity in preterm and healthy term infants during the first postnatal year.
Dev. Psychobiol. 60, 256–264 (2018).
5. McCarthy, K. M., Skoruppa, K. & Iverson, P. Development of neural perceptual vowel spaces during the first year of life. Sci.
Rep. 9, 1–7 (2019).
6. Kuhl, P. K. Brain mechanisms in early language acquisition. Neuron 67, 713–727 (2010).
7. Cabrera, L. & Gervain, J. Speech perception at birth: The brain encodes fast and slow temporal information. Sci. Adv. 6, eaba7830
(2020).
8. Jeng, F. C., Lin, C. D. & Wang, T. C. Subcortical neural representation to Mandarin pitch contours in American and Chinese
newborns. J. Acoust. Soc. Am. 139, 190–195 (2016).
9. Jeng, F. C. et al. Cross-linguistic comparison of frequency-following responses to voice pitch in American and Chinese neonates
and adults. Ear Hear. 32, 699–707 (2011).
10. Jeng, F. C., Peris, K. S., Hu, J. & Lin, C. D. Evaluation of an automated procedure for detecting frequency-following responses
in American and Chinese neonates. Percept. Mot. Skills 116, 456–465 (2013).
11. Ribas-Prats, T. et al. The frequency-following response (FFR) to speech stimuli: A normative dataset in healthy newborns. Hear.
Res. 371, 28–39 (2019).
12. Jeng, F. C., Nance, B., Montgomery-Reagan, K. & Lin, C. D. Exponential modeling of frequency-following responses in american
neonates and adults. J. Am. Acad. Audiol. 29, 125–134 (2018).
13. Jeng, F. C. et al. Development of subcortical pitch representation in three-month-old Chinese infants. Percept. Mot. Skills 122,
123–135 (2016).
14. Pinto, E. S. M. & Martinelli, M. C. Brainstem auditory evoked potentials with speech stimulus in neonates. Braz. J. Otorhinolaryn‑
gol. 86, 191–200 (2018).
15. Richard, C. et al. Characteristics of the frequency-following response to speech in neonates and potential applicability in clinical
practice: A systematic review. J. Speech, Lang. Hear. Res. 63, 1618–1635 (2020).
16. Carral, V. et al. A kind of auditory ‘primitive intelligence’ already present at birth. Eur. J. Neurosci. 21, 3201–3204 (2005).
17. He, C. & Trainor, L. J. Finding the pitch of the missing fundamental in infants. J. Neurosci. 29, 7718–7722 (2009).
18. Plantinga, J. & Trainor, L. J. Memory for melody: Infants use a relative pitch code. Cognition 98, 1–11 (2005).
19. Tew, S., Fujioka, T., He, C. & Trainor, L. Neural representation of transposed melody in infants at 6 months of age. Ann. N. Y.
Acad. Sci. 1169, 287–290 (2009).
20. Cheour-Luhtanen, M. et al. Mismatch negativity indicates vowel discrimination in newborns. Hear. J. 82, 53–58 (1995).
Scientific Reports | (2021) 11:6660 | https://doi.org/10.1038/s41598-021-85799-x 13
Vol.:(0123456789)You can also read