New Approaches For Automated Detection and Analysis of Hazardous Thunderstorms at NASA Langley Research Center - Kristopher Bedka
←
→
Page content transcription
If your browser does not render page correctly, please read the page content below
New Approaches For Automated Detection
and Analysis of Hazardous Thunderstorms at
      NASA Langley Research Center

                 Kristopher Bedka
        Climate Science Branch, Science Directorate
              NASA Langley Research Center

              kristopher.m.bedka@nasa.gov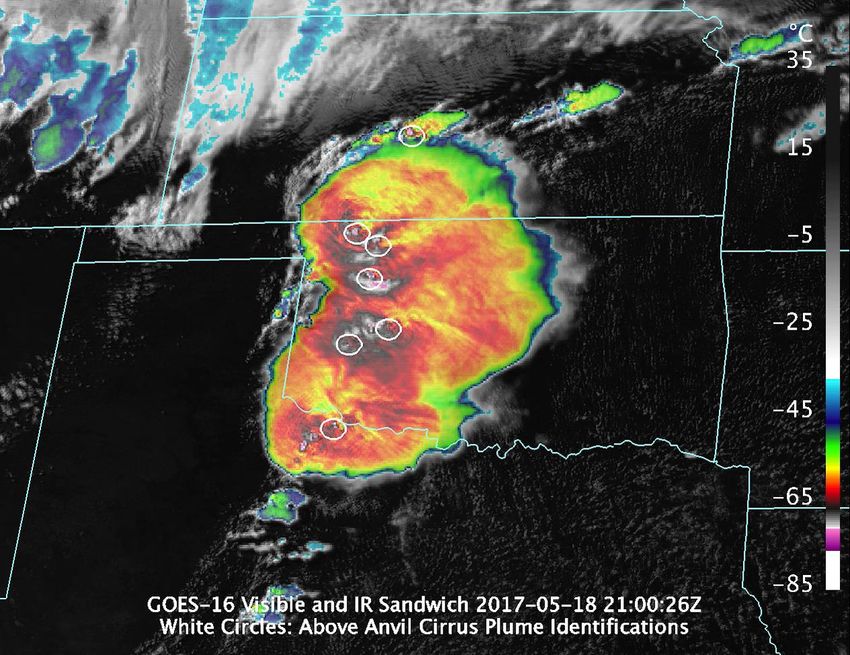
Talk Outline

• Analysis and Prediction Of Tornadic Storms Using Remote Sensing Data Fusion

• The Above Anvil Cirrus Plume: The Most Definitive Indicator of a Severe Storm
  in Visible and Infrared Satellite Imagery
Analysis and Prediction of
Tornadic Storms Using Remote
     Sensing Data Fusion
                    Kristopher Bedka
            Science Directorate, NASA Langley Research Center

                            Work Led By
                     Thea Sandmael
                         University of Oklahoma

                        In Collaboration With
                          Cameron Homeyer
                         University of Oklahoma

        John Mecikalski, Jason Apke, and Christopher Jewett
                    University of Alabama in Huntsville

 Supported by the NASA ROSES Severe Weather Research Program and
           NOAA GOES-R Risk Reduction Research Program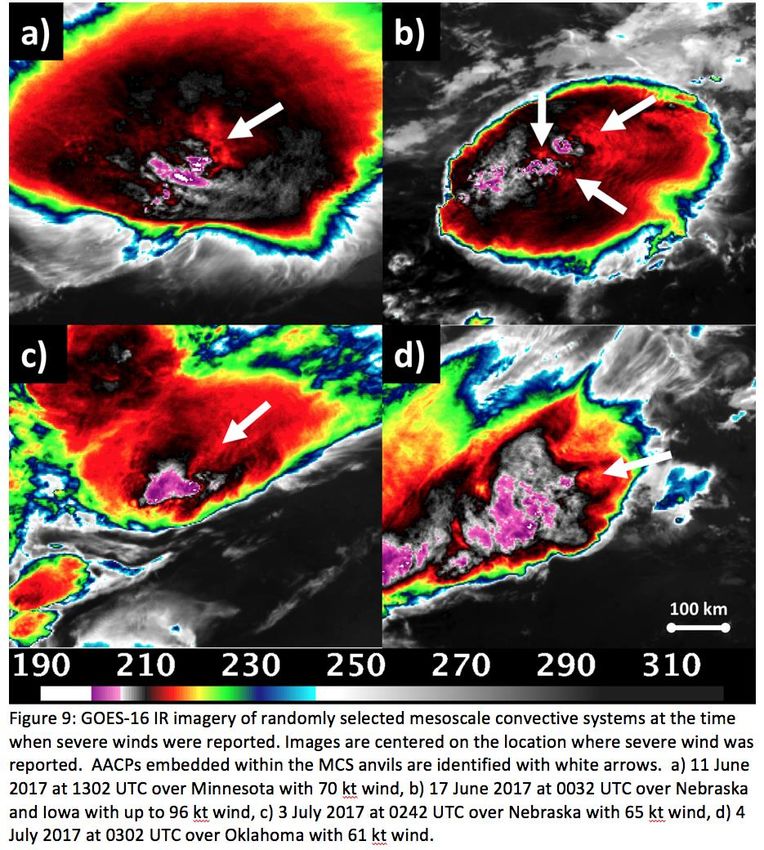
Introduction

OBJECTIVE: Use advanced remote sensing observations and products to
be available at up to 30-sec frequency during the GOES-R era to:

1) Characterize storm evolution and recognize unique signatures that occur in
advance of tornadoes and other severe weather

2) Develop and demonstrate state-of-the-art derived products that could potentially
improve severe storm detection and forecast lead-time
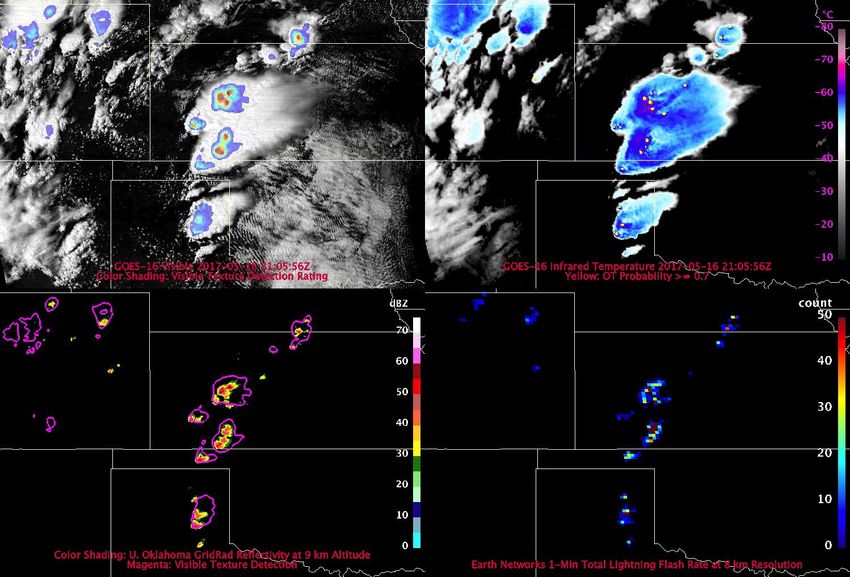
Multi-Sensor Observations of Severe Storms
                                                           at 1 to 5 min Frequency
                                                                                                                                                            Over 125 Severe Weather Reports
                                                                                                                                                              During Animation Timeframe
GOES-16 Visible                                                   GOES-16 Infrared                                                                                     16 May 2017 2100-2359 UTC
                             Nebraska

    Colorado
                                                       Kansas

                   Texas                          Oklahoma
                                                                Preliminary pre-operational GOES-16 data
                                                                acquired from University of Wisconsin
                                                                Space Science and Engineering Center                                                                                               Tornado
                                                                                                                                                                                                    Wind
NEXRAD Weather Radar Echoes                                        ENTLN Total Lightning Flash Rate at
                                                                   ~8 km GOES-16 Geostationary Lightning Mapper Resolution
                                                                                                                                                                                                     Hail
                                                                                                                                                    Credit: NOAA Storm Prediction Center

                                                                                                                                                      Severe weather reports appear to
                                                                                                                                                        be quite chaotic and random

                                                                                                                                                              How can we the identify
                                                                                                                                                                the severe storms?

NOAA NEXRAD volumetric data acquired and
processed through the GridRad framework at the
                                                                                                           Earth Networks Total Lightning Network
                                                                                                           data acquired and processed at the
                                                                                                                                                              What indicators are truly
University of Oklahoma (www.gridrad.org)                                                                   University of Alabama in Huntsville
                                                                                                                                                              statistically significant?

                                                                                                                                                                    How useful are
                                                                                                                                                                satellite-derived data?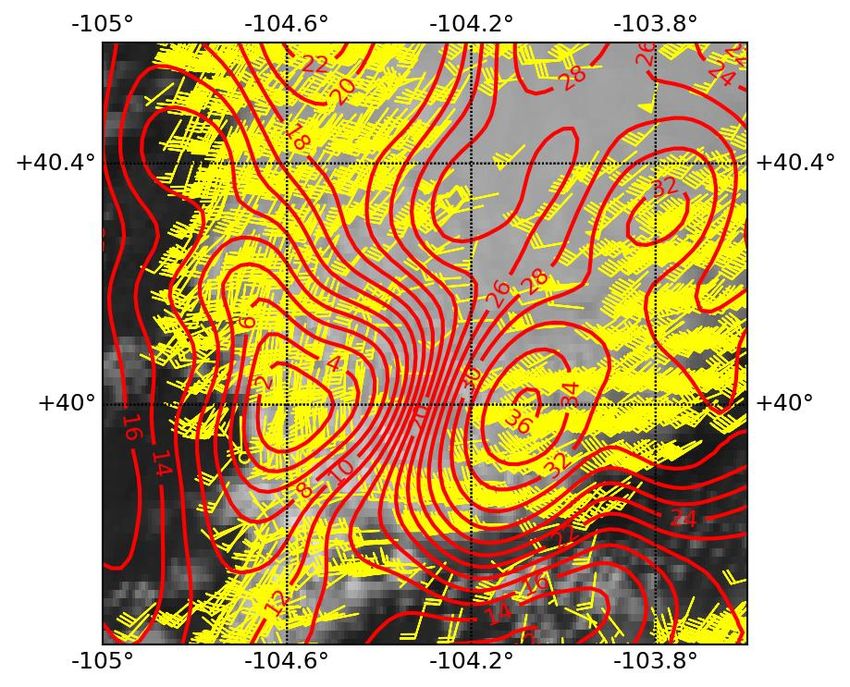
Satellite and Ground-Based
                                                                      Remote Sensing Data Fusion

Data Fusion: The process of integrating multiple datasets
for combined analysis
                                                                                                   NEXRAD Storm Tracking
Radar-based storm tracking is used to combine
1) GOES multispectral imagery and derived products
2) NEXRAD updraft intensity and storm rotation metrics
3) Total lightning flash rate
to identify early indicators of severe and tornadic storms

Photograph By: Roland Welser (DLR) over Northern Texas on 29 May 2012 during
the DC3 Field Campaign
Storm is producing 2.5 inch diameter hail at the time of the photo
Graphic Designed By Timothy Marvel, Kristopher Bedka (NASA LaRC) and
Cameron Homeyer (University of Oklahoma)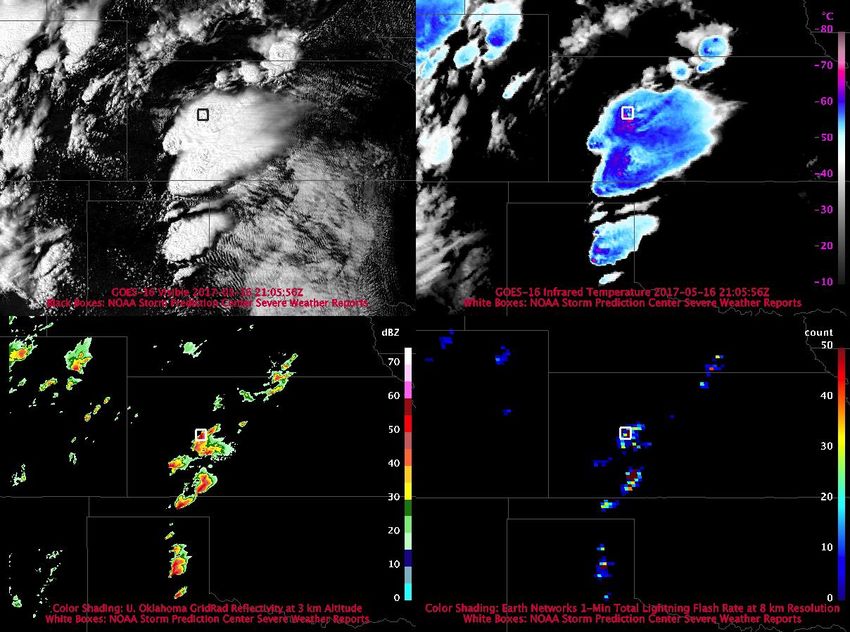
Analysis Methods

• 28 severe weather events analyzed across the U.S. from 2011-2016
       •   19 events GOES-13 7.5 min rapid scan and 9 events GOES-14 1-min super rapid scan data

• 8378 storms tracked throughout their lifetime using NOAA Doppler radar data
       •   335 tornadic storm cells generated 1044 tornadoes
       •   1120 non-tornadic, severe storm cells

• Storm tracks used to extract maximum GOES, radar, and lightning product data within
  a 10-km radius of the storm location
       •   Data extracted at 1-minute intervals (when available). 5-min radar fields always interpolated
           to 1-min. GOES products are not interpolated
       •   Tornadic storm analysis done during three periods 1) 1-30 min prior to FIRST tornado, 2)
           During tornado, and 3) 1-30 min after LAST tornado

• Severe weather reports linked to the nearest storm within 3 km of storm track

• Details Provided By:
Sandmæl, T. N., C. R. Homeyer, K. M. Bedka, J. M. Apke, J. R. Mecikalski, and K. Khlopenkov, 2018: Using Remotely Sensed Updraft
Characteristics to Discriminate Between Tornadic and Non-Tornadic Storms, Submitted to J. Appl. Meteor. Climatol.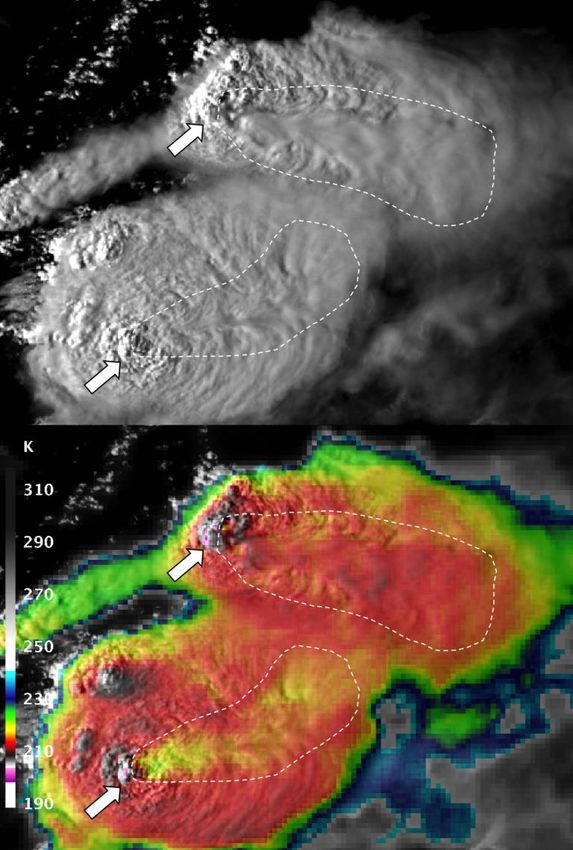
Datasets
                                      GOES Datasets
• IR Brightness Temperature

• NASA LaRC Overshooting Top (OT) Visible Texture Rating (Bedka and Khlopenkov 2016)

• AMV-Derived Divergence UAH / UW-CIMSS Super Rapid Scan Anvil Level Flow System
  (SRSAL, Apke et al. 2016, 2018), 9 GOES-14 1-Min Cases Only

 NEXRAD and Earth Networks Total Lightning Network (ENLTN) Datasets
• NEXRAD Radial Divergence, Azimuthal Shear (i.e. “Rotation”) within low (1-3 km), middle (3-
  8 km), and upper layers (8+ km) and Spectrum Width

• Echo Top Height for Various Reflectivity Thresholds

• 8 km Gridded 1-min ENTLN Lightning Flash Extent Density A Proxy For GOES-R GLM Data, 9
  GOES-14 1-Min Cases Only

                                     Ancillary Fields
• Severe Weather Reports from the NOAA NCEI Storm Events Database, including tornado
 intensity and duration

• NOAA National Weather Service Tornado Warnings
• NWP Analyses: Tropopause Temp/Height, Temperature Profiles for AMV Height Assignment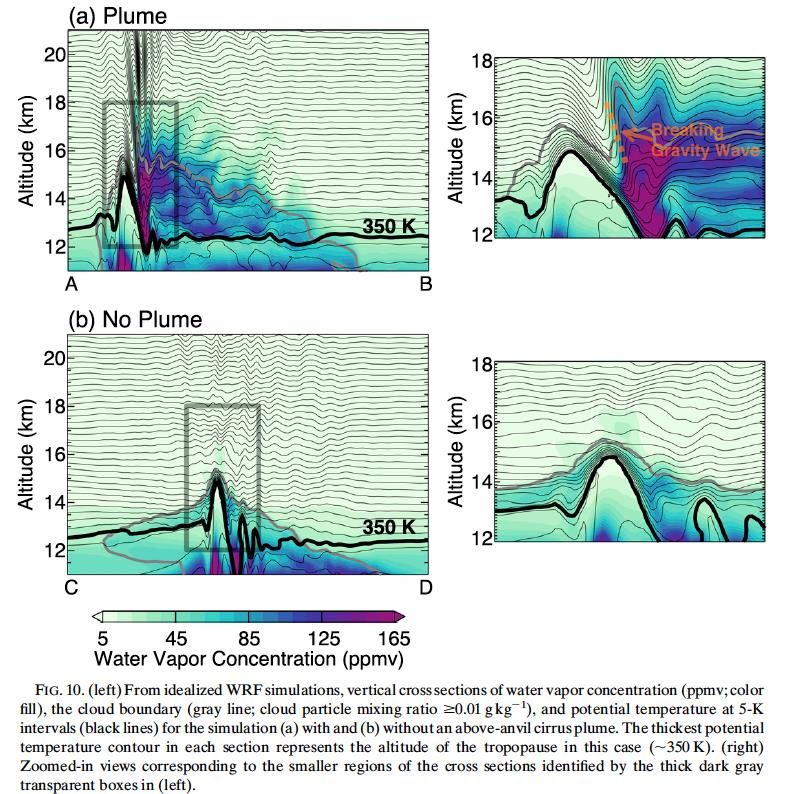
U. Oklahoma / Texas A&M GridRad System
                                             (http://www.gridrad.org)
                      GOAL: Use Overlapping NOAA NEXRAD Radar Volumes To Construct
               High Spatial (2 km), Temporal (5-Min), and Vertical (0.5 km) Resolution Composites
•   Comparable to the NOAA Multi-Radar Multi-Sensor (MRMS) system,            NOAA NEXRAD Doppler Radar Sites
    but emphasizes resolving the 3-D structure of the storm, especially in   15 Elevation Scans Per 5-Min Volume
    the upper troposphere / lower stratosphere

•   Products Include: Echo Tops at varying dBZ, Radial Divergence,
    Azimuthal Shear (i.e. ”Rotation”), Spectrum Width, Hydrometeor
    Classification, Dual-Polarization Fields, Hail Detection / Hail Size
    Estimates, and Many More

                                                                               Mean Number of Radar Slices
                                                                              Through An Atmospheric Column
                                                                                 (Cooney et al. (JGR, 2018))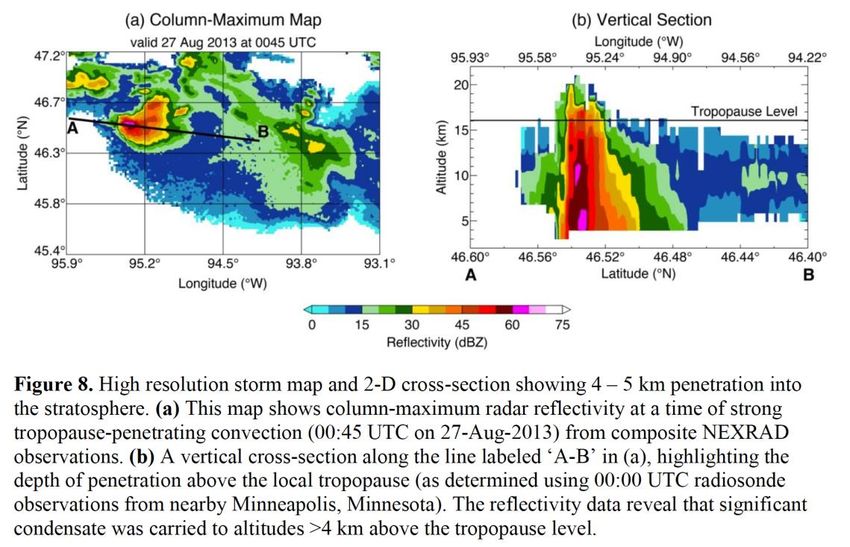
U. Oklahoma / Texas A&M GridRad System
                                                (http://www.gridrad.org)
                           GOAL: Use Overlapping NOAA NEXRAD Radar Volumes To Construct
                     High Spatial (2 km), Temporal (5-Min), and Vertical (1 km) Resolution Composites
•     Comparable to the NOAA Multi-Radar Multi-Sensor (MRMS) system,            NOAA NEXRAD Doppler Radar Sites
      but emphasizes resolving the 3-D structure of the storm, especially in   15 Elevation Scans Per 5-Min Volume
      the upper troposphere / lower stratosphere

•     Products Include: Echo Tops at varying dBZ, Radial Divergence,
      Azimuthal Shear (i.e. ”Rotation”), Spectrum Width, Hydrometeor
      Classification, Dual-Polarization Fields, Hail Detection / Hail Size
      Estimates, and Many More

                                                                                 Mean Number of Radar Slices
                                                                                Through An Atmospheric Column
                                                                                   (Cooney et al. (JGR, 2018))

    Smith et al. (JGR, 2017)
GridRad Storm Cell Tracking
Critical For Data Fusion and Tornadic Storm Analysis
11-12 May 2014 Storm Tracks
• GridRad 40 dBZ convective radar
echoes (Storm Labeling in Three Dimensions,
Starzec et al. 2017) define storm objects
that are tracked in each 5-min volume
• Results quite comparable to tracks
available in NOAA Weather Service
operations (Homeyer et al. 2017)
• Radar objects enable accumulation of
Lines show storm tracks, colors
used to differentiate cells but do
radar, satellite, and severe weather
not have any scientific significance report data throughout storm lifetimes
Graphic Courtesy of Cameron Homeyer (OU)GridRad Storm Cell Tracking
Critical For Data Fusion and Tornadic Storm Analysis
Storm Tracks For All 28 Severe Weather Events
• GridRad 40 dBZ convective radar
• echoes
GridRad (Storm 40Labeling
dBZ convective radar
in Three Dimensions,
echoes
Starzec (Storm
et al. 2017) define storm objects
Labeling in Three
that are tracked Starzec
Dimensions, in each 5-min
et al. volume
2017)
define storm objects that are
• Results quite comparable to tracks
tracked in time
available in NOAA Weather Service
operations (Homeyer et al. 2017)
• Radar objects enable
accumulation
• Radar of radar,
objects enable satellite,
accumulation of
Lines show storm tracks,
Lines
used to differentiate
show
cells
colors
storm tracks, colors
but do
and satellite,
radar, severe weather report
and severe data
weather
used to differentiate cells but do
not have any scientific
not havesignificance
any scientific significance report data throughout
throughout storm lifetimes
storm lifetimes
Graphic Courtesy of Thea Sandmael (OU)GOES-16 Visible
Visible channel reflectance patterns show physical deformation of
the cloud top by updrafts and turbulence
IR temperatures are modulated by a variety of factors. Cold cloud
covers much larger area than OTs depicted in visible
GOES-16 InfraredGOES-16 Visible
GOAL: Develop an automated method for quantifying the texture with
visible channel imagery to provide an alternative indication of updraft
location / intensity
PREMISE: Anvils should be of certain reflectance depending on solar
geometry and time of year. First identify anvils and then perform Fourier
analysis on 32x32 1 km pixel windows to quantify texture
GOES-16 Visible With
Texture Detection RatingAccumulated Severe Weather Reports
During Animation Timeframe 16 May 2017 Severe Weather Outbreak, 2100-2359 UTC
GOES Texture and OT Probability Overlay
Tornado
Wind
Hail
GOES-16 Infrared and
GOES-16 Visible High IR-Based
Texture Rating Overshooting Top
Probability
GridRad Reflectivity ENTLN-Based Proxy For
at 9 km Altitude Overlaid GOES-16 Geostationary
With Texture Detection Lightning Mapper DataHow Does Visible Texture Relate
to Radar Echo Top (10 dBZ)Height?
Echo Top Above Tropopause
Figure taken from:
Sandmæl, T. N., C. R. Homeyer, K. M. Bedka, J. M.
Apke, J. R. Mecikalski, and K. Khlopenkov, 2018:
Using Remotely Sensed Updraft Characteristics to
Discriminate Between Tornadic and Non-Tornadic
Storms, Submitted to J. Appl. Meteor. Climatol.
Number of samples in each rating interval
• Unitless GOES Visible Texture Rating ranges from 5 to ~80
• GOES-13 and -14 Visible Texture Rating co-located with GridRad tropopause-relative 10 dBZ echo top
• Increased texture indicates a stronger updraft and cloud top further above the anvil and tropopause
• Can be generated using any GEO imager and is currently being provided to NOAA National CentersSUPER RAPID SCAN ANVIL LEVEL FLOW (SRSAL V 2.2)
Jason Apke and John Mecikalski (U. Alabama In Huntsville)
Cloud-Top
Cloud-Top u-wind
Divergence
Background u- wind
• Mesoscale Atmospheric Motion Vectors (mAMVs)
derived from ≤ 1-min GOES data are used to derive
cloud top divergence (CTD) and vorticity (CTV, Apke
et al. 2016)
• Recursive Filter used to generate 0.02°x0.02° grid of
u- and v-component winds. Finite differencing used
to derive CTD and CTV
• GFS Tropopause Flow used as background
• Maximum resolvable feature resolution is ~10 km
horizontal diameter, smaller features will be
smoothed out
• CTD demonstrated to identify severe, deep
convection updrafts (Apke et al. 2018)
Apke, J. M., J. R. Mecikalski, and C. P. Jewett, 2016: Analysis of mesoscale
atmospheric flows above mature deep convection using super rapid scan
geostationary satellite data. J. Appl. Meteor. Climol., 55, 1859-1887. Figure 1. The 21 May 2014 2138 UTC GOES-14 VIS imagery of a supercell over
Apke, J. M., J. R. Mecikalski, K. Bedka, E. W. McCaul Jr., C. R. Homeyer, and C. P.
central Colorado shown with mAMV in yellow and flow variables (u-
Jewett, 2018: Relationships between deep convection updraft background winds, u- recursive filter winds, and SRSAL cloud-top divergence)
characteristics and satellite based super rapid scan mesoscale atmospheric contoured with positive (negative) values in red (blue-dash).
motion vector derived flow. Mon. Weather Rev., submitted.Putting The Pieces Together
Sample Result: 40 dBZ Precipitation Echo Top
95% Median height of heavy liquid or ice precipitation is 1.5 km
higher during tornado than before first tornado and 2.5-5 km
higher than non-tornadic storms
75%
50%
25%
5%
During
The most intense 30-min period 16-30 Min Tornado
Non-Severe N=6210
16-30 Min
(+/- 15 min from max value during Before First
N=148616 After Last
storm lifetime), analyzed for non- Tornado Tornado
severe, hail, and wind storms N=961 N=821
1-15 Min 1-15 Min
Wind or Hail Storm Before First
N=24155 After Last
Tornado Tornado
Figure taken from: N=1164
N=1058
Sandmæl, T. N., C. R. Homeyer, K. M. Bedka, J. M. Apke, J. R. Mecikalski, and K. Khlopenkov,
2018: Using Remotely Sensed Updraft Characteristics to Discriminate Between Tornadic and
Non-Tornadic Storms, Submitted to J. Appl. Meteor. Climatol.Satellite, Radar, and Lightning Analysis
Remote Sensing Indicators
of Updraft Intensity
1) Radar or GOES outflow layer
divergence,
2) Convective echo height
3) Radar spectrum width
4) GOES visible channel texture
5) Total lightning flash density
• All updraft intensity indicators
are highest on average when a
tornado is on the ground
• Tornadic storm updrafts
significantly stronger than hail
or wind storm updraftsRadar Rotation and Divergence Analysis
• Tornadic storms feature
rotating updrafts, with
rotation evident throughout
the depth of the storm
• Upper–level (8+ km) rotation
is evident long before rotation
at low levels
• The product of the upper-level
divergence and rotation rate
provides the best statistical
separation between tornadic
and non-tornadic stormsSatellite-Only Analysis
Storm Minimum IR Brightness Temperature
• Visible super rapid scan AMV divergence and
texture clearly increase when tornado is on
the ground
• Cold storm-minimum temperatures alone
cannot be used to identify a severe storm
• Perhaps an opportunity to identify where tornado
COULD NOT occur, i.e. IR-tropopause temp > 1 K?
• GOES-16 IR temperatures in OT regions ~3-6 K
colder than GOES-13/14, so perhaps signals in
tornadic storms will be stronger with next-gen dataSatellite, Radar, and Lightning
Analysis Summary
When tornadoes are on the ground,
remote sensing shows that the parent
thunderstorm:
1) Has the strongest updraft,
2) Produces the most frequent lightning,
3) Ejects cirrus outflow fastest, and
4) Rotates fastest
Tornadic storms are 3x stronger than non-
severe storms and 2x stronger than non-
tornadic hail or wind storms
The NEXRAD maximum rotation rate at 8+ km altitude multiplied by the outflow rate identifies a strong rotating updraft
at upper levels long before a tornado forms
• Threshold of 35x10-3 s-1 Identifies a tornadic storm 45 mins prior to its first tornado, compared to 34 mins from the first
National Weather Service (NWS) tornado warning
• Detects 65% of tornadic storms, compared to 50% from NWS, assuming false alarm rate identical to NWS (85%)Radar Updraft and Rotation Metrics
As A Function of Tornado Intensity
• Radar/GOES updraft and radar rotation metrics increase
on average with increasing tornado intensity
• Storms that generate weak tornadoes can still generate
high values, so no particular threshold can be used to
discriminate the most intense tornadoes
GOES Visible TextureSummary
Analysis and Prediction of Tornadic Storms Using Remote Sensing Data Fusion
• Automated radar-based tracking of 8378 storms was used to quantify statistical
differences in characteristics of tornadic storms relative to other storm types
• GOES, radar, and lightning datasets all indicate that tornadic storms feature the
strongest updrafts
• Updrafts were more intense on average during the strongest tornadoes
• Satellite visible texture and super-rapid scan AMV-based divergence provides much
better inference of updraft intensity than IR temperature
• Rapid outflow divergence and upper-level (8+ km altitude) rotation precedes
formation of the first tornado by up to 1 hour in some cases, 45 min on average
• An upper-level radar divergence*rotation product offers new opportunity for
detecting tornadic storms and perhaps increasing warning lead time
• Ask me more about this during the CWG meeting!The Above Anvil Cirrus Plume
The Most Definitive Indicator of a Severe Storm
In Visible and Infrared Satellite Imagery
Kristopher Bedka
Science Directorate, NASA Langley Research Center
In Collaboration With
Elisa Murillo and Cameron Homeyer
University of Oklahoma
Benjamin Scarino
Science Systems and Applications, Inc
Haiden Mersiovsky
Florida State University
With Inspiration From: Martin Setvak (Czech Hydrometeorological Institute)
and Pao Wang (UW-Madison)
Supported by the NASA ROSES Severe Weather Research ProgramGOES-16 Above Anvil Cirrus Plume Producing Supercell Storm
18 May 2017, 2124-0100 UTC, North Texas
MUG Meeting May 22-24 2018What Is An Above Anvil Cirrus Plume?
• Above anvil plumes are typically generated by intense tropopause-penetrating updrafts in environments with
strong storm-relative wind shear (Utrop+2km – Ucell)
• Updraft – shear combination promotes gravity wave breaking and injection of ice into the stratosphere
(Wang 2003; Homeyer et al. 2017)
• Other mechanisms for plume formation have been proposed. See Pao Wang’s upcoming presentation
Cloud Top Cross Section Through
Idealized Storm Simulations With
Varying Storm-Relative Shear
Strong Shear = Plume
Weaker Shear = Similar Overshooting
Magnitude But No Plume
Figure 10 Overshooting Updraft
From Homeyer et al. (JAS, 2017)What Is An Above Anvil Cirrus Plume?
• Plume-anvil height difference produces texture and shadowing in visible imagery, making them
apparent to the human eye
• Stratosphere is generally warmer than anvil, causing the plume to be anomalously warm when
initially generated near the updraft. There is ample evidence of cold plumes though, more
research is required to understand why some plumes as warm vs cold.
When anvil level winds are strong,
cold anvil borders the warm area,
producing a U or V pattern
• The “enhanced-V signature”, McCann (1983)
A ring-shaped cold area with a middle
warm area occurs with weaker anvil-
level winds
• The “cold-ring signature”, Setvak et al. (2010)
Enhanced-V
LINK TO PDF WITH DETAILED EXPLANATION OF Signature
ENHANCED-V AND COLD-RING STORM PHYSICS Overshooting Updraft
By Martin Setvak (CHMI)GOES-13
Aurora, NE 7 Inch Hail GOES-13
23 Jun 2003 Vivian, SD 8 Inch Hail
23 Jul 2010
All These Randomly Selected Extremely
Severe Storms Generated A Plume
GOES-13
GOES-13
Eagle Butte, SD
El Reno, OK EF-3
107 mph Wind
31 May 2013
17 Jun 2010
PLUME PLUME
GOES-13 GOES-13
Hackleberg, AL EF-5 Joplin, MO EF-5
27 Apr 2011 22 May 2011
GOES-16
Polo, SD GOES-16
100 mph Wind Canton, TX EF-4
19 Jul 2017 29 Apr 2017Above Anvil Plumes Occur Worldwide
• Plume-producing storms occur throughout the
Central Europe world...not just a Midwest U.S. phenonemon
• Observed over 6 of the 7 continents and over
high-latitudes, mid-lats, and deep tropics
• Links To Blog Posts From
International Plume Events
Spain
Czech Republic
Plumes Germany
South Africa
Arabian Peninsula
Congo, Angola, Mozambique, and South Africa
• Recent GOES-16 Events From The
GOES Satellite Liason Blog
https://satelliteliaisonblog.com/2017/08/10/rapid-convective-
initiation-and-large-hail-in-southern-colorado/
https://satelliteliaisonblog.com/2017/06/26/1-min-goes-16-imagery-
use-in-warning-operations/
Example of MSG SEVIRI-based sandwich product – combination of HRV
band with color-enhanced IR10.8 brightness temperature image. https://satelliteliaisonblog.com/2017/04/14/texas-severe-storm-near-
Germany, 12 July 2011, 1740 UTC. Prepared by Martin Setvak (CHMI) sunset/Above Anvil Plumes Occur Worldwide
• Plume-producing storms occur throughout the
world...not just a Great Plains phenonemon
Several Feet Of Hail, La Cruz, Argentina,
• Observed over 6 of the 7 continents and over
26 Oct 2017
high-latitudes, mid-lats, and deep tropics
• Links To Blog Posts From
International Plume Events
Plume Spain
Czech Republic
Germany
South Africa
Arabian Peninsula
Congo, Angola, Mozambique, and South Africa
• Recent GOES-16 Events From The
GOES Satellite Liason Blog
https://satelliteliaisonblog.com/2017/08/10/rapid-convective-
initiation-and-large-hail-in-southern-colorado/
https://satelliteliaisonblog.com/2017/06/26/1-min-goes-16-imagery-
use-in-warning-operations/
https://satelliteliaisonblog.com/2017/04/14/texas-severe-storm-near-
sunset/Above Anvil Plumes Occur Worldwide
• Plume-producing storms occur throughout the
world...not just a Great Plains phenonemon
7+ Inch Hail, Cordoba, Argentina • Observed over 6 of the 7 continents and over
8 February 2018 high-latitudes, mid-lats, and deep tropics
• Links To Blog Posts From
Plume International Plume Events
Plume Spain
Czech Republic
Germany
South Africa
Plume
Arabian Peninsula
Congo, Angola, Mozambique, and South Africa
• Recent GOES-16 Events From The
GOES Satellite Liason Blog
https://satelliteliaisonblog.com/2017/08/10/rapid-convective-
initiation-and-large-hail-in-southern-colorado/
https://satelliteliaisonblog.com/2017/06/26/1-min-goes-16-imagery-
use-in-warning-operations/
https://satelliteliaisonblog.com/2017/04/14/texas-severe-storm-near-
sunset/Motivation For This Study
• The coarse resolution of past GEO imagers has inhibited quantification of plume storm severity,
limiting utility of plume recognition in forecast operations
• Coarse spatial/temporal resolution -> Late plume identification and/or inability to see plume at all
• GOES-14 and GOES-16 have observed many severe weather outbreaks at 1 min frequency, allowing
precise determination of when/where plumes were produced
• This study merges 1) human plume identifications from GOES-14/16 SRSO imagery, 2) automated
storm tracking using NOAA NEXRAD data, 3) severe weather reports, and 4) NOAA National
Weather Service severe weather warning data to answer:
1) Are plume-producing storms more severe than storms without plumes?
2) How far in advance of severe weather and warnings do plumes typically appear?
3) What severe weather types and severe intensity are common within plume storms?
4) What are the radar-observed updraft characteristics before, during, and after plume
production? What is the typical plume storm mode, e.g. do plumes indicate a supercell?Quantifying Plume – Severe Weather Relationships
• 12 severe weather outbreaks studied using GOES-14 and -16, 30-sec to 1-min imagery
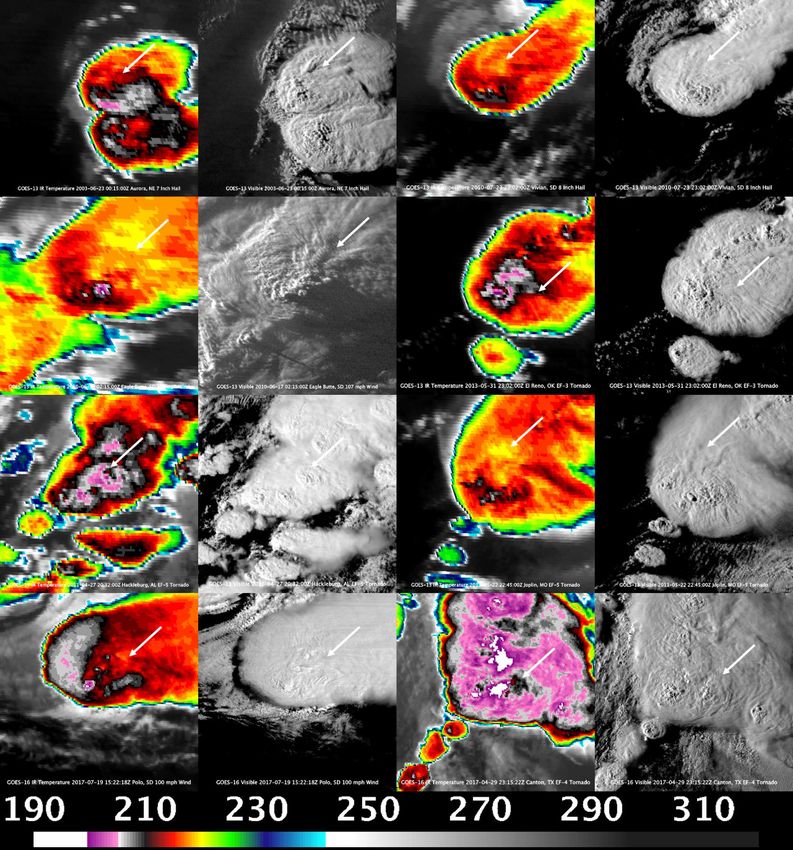
• 6000+ GOES images analyzed
• 405 plume producing storm cells identified by a team of human experts
• Radar-detected cell and plume must persist for 10+ mins to be included in plume storm population
• Starting and ending time of plume production noted
• Many instances of over 10 plumes being produced simultaneously across several states
• Some storms produced plumes almost continuously for over 4 hours
• Mean duration of plume production: ~50 mins
• 4503 hail, wind, and tornado reports generated by 700 severe storm cells
• 807 significant severe reports: 2+ inch hail, 65+ kt wind, EF-2+ tornado
• NOAA NCEI Storm Events Database used to define severe weather
• https://www.ncdc.noaa.gov/stormevents
• Severe thunderstorm and tornado warnings from the Iowa Environmental Mesonet website
• https://mesonet.agron.iastate.edu/request/gis/watchwarn.phtmlHow Do We Identify Plumes?
• Look for “smoke-like” visible texture, plume-shaped channel of cold IR temperatures,
and/or warm anomalies generated near OT region
• More uncertainty at night when only IR information available
• Two different people analyzed the imagery, start/end uncertainty +/- 5 mins
• First trackable 40 dBZ echo top at 2135 UTC, 25 mins before the start of the animation
• Plume began at 2225 UTC from our perspectiveAbove Anvil Cirrus Plumes Identified With GOES-16 Data
Visible+ IR “Sandwich”: 18 May 2017Cell Tracks and Severe Weather Reports
Plume vs. Non-Plume Storms
• In many cases, severe weather
reports are concentrated along
plume storm tracks
• Plume storm tracks are ~45-60
mins longer on average than
non-plume stormsKey Findings
Plume-Producing Storm Severity
• Plume-producing storms generated 14 times more severe weather per storm than storms
without plumes
• Plume storms: 6.33 reports/storm Non-Plume: 0.46 reports/storm
• If storms with 0 reports are disregarded, plume storms generated 2.6 times more severe
weather, 10.8 vs 4.2 reports/storm
• 59% of storms with plumes were severe
• Storms with plumes generated the majority (57%) of all severe reports during the 12 outbreaks
• 73% of the 2+ inch hail, 65+ kt wind, and EF-2+ tornado reports generated by plume storms
• 86% tornado, 88% hail, 41% wind
• 48% of plume storms were supercells (N=194) defined using a combination of quantitative (long lifetime,
high echo top, rotation) and qualitative analysis (hook echo, BWER, deviant motion)
• 75% of supercells produced plumesDamaging-Wind Producing MCS’s
Can Also Generate Plumes
70 kt wind 96 kt wind
• Weaker plume -significant
severe wind relationship
than hail or tornado likely
driven by the fact that
updraft cores in MCS’s are
not as temporally persistent
as hail or tornado
• Therefore, plumes are often
65 kt wind 61 kt wind not as long lived or are
cannot be linked to a radar
cell trackKey Findings Duration of Plume Production • >70% of plumes are typically produced for less than an hour, but production can last for 4+ hours
Key Findings
Severe Weather Timing Relative To Plume Production
•   Plumes appeared an average of ~30 minutes before the first severe weather was produced by the
    parent storm, and provide comparable lead time to the first National Weather Service severe
    weather warnings

•   Plume preceded the first NWS warning for 33% of storms, but typically only by 0-10 mins

                                                            NWS                       Plume
                                                           Warning                   Appeared
                                                           Was First                   First
GOES and NEXRAD Analyses of
Plume and Non-Plume Storms: 40 dBZ Echo Top
40 dBZ -> Heavy ice/liquid precip, graupel, and/or large hail
Above Tropopause
Below Tropopause
Tropopause
Relative 40-dBZ
Echo Top Height (km)
No Plume During Plume Plume No Longer
Severe Storm Non-Severe Storm Generated
No Plume Before a During Plume
Non-Severe Storm Plume Forms Severe StormGOES and NEXRAD Analyses of
Plume and Non-Plume Storms: Anvil Divergence
Radar
Divergence
at 8+ km
Altitude
No Plume During Plume Plume No Longer
Severe Storm Non-Severe Storm Generated
No Plume Before a During Plume
Non-Severe Storm Plume Forms Severe StormGOES and NEXRAD Analyses of
Plume and Non-Plume Storms: Anvil Divergence
Radar
Divergence
at 8+ km
Altitude
• Height of large ice particles rises by 2.5 km and outflow rate increases by 50% when plumes form
• Significant updraft acceleration and greater cloud top penetration into the stratosphere contribute
to gravity breaking and plume generation
• When severe weather is produced by a plume storm, the storm is most intense on average, except
for lightning which is comparably high for non-severe plume storms
• The plume signature allows anyone to easily identify these extremely intense and often
supercell storms in the absence of Doppler radar imageryGOES and NEXRAD Analyses of
Plume and Non-Plume Storms: Storm Minimum IR Temp
Minimum
Storm IR
Brightness
Temperature
No Plume During Plume Plume No Longer
Severe Storm Non-Severe Storm Generated
No Plume Before a During Plume
Non-Severe Storm Plume Forms Severe StormGOES and NEXRAD Analyses of
Plume and Non-Plume Storms: Storm Minimum IR Temp
Minimum
Storm IR
Brightness
Temperature
• Both non-severe and severe storms can have cold IR temperatures
• Difference between plume and non-plume storms only ~3 K on average (0.5-0.75 km height diff)
• Cold temperatures alone cannot be used to identify a severe stormSummary
The Above Anvil Cirrus Plume: The Most Definitive Indicator of a
Severe Storm In Visible and Infrared Satellite Imagery
• Automated NEXRAD-based storm tracking paired with a large database of human-identified
above anvil plumes to analyze plume storm characteristics and severity
• On average, cloud tops are highest and updrafts most intense while plumes are produced
• Plume storms are far more severe than storms without plumes
• The majority (73%) of significant severe weather, most notably 2+ inch hail and EF-2+ tornado, was
generated by plume storms
• Plumes appear 31 mins in advance of the first severe weather report on average. Plumes preceded a
National Weather Service warning for 33% of severe plume storms
• Plumes often indicate that the parent storm is a supercell
• Though storms without plumes can generate severe weather, a plume is better correlated
with severe weather than any other known VIS or IR cloud-top signature
• Plumes can be seen in any GEO or LEO VIS/IR imagery, serving as a valuable severe
weather warning decision aid especially in regions without Doppler weather radar data
• Submitted Paper
Bedka, K. M., E. Murillo, C. Homeyer, B. Scarino, H. Mersiovsky, 2018: The Above Anvil Cirrus Plume: The Most Definitive
Indicator of a Severe Storm In Visible and Infrared Satellite Imagery. Submitted to Weather and ForecastingAsk Me More This Week About...
• Satellite-based detection of high ice water content / aircraft engine icing conditions
• Satellite-based detection of supercooled water aircraft airframe icing
• Cloud-resolving model assimilation of satellite cloud property retrievals to improve deep
convection forecasting -> NOAA “Warn On Forecast”
• Long-term climatologies of deep convection and overshooting tops, and hail/wind/tornado
risk estimates
• Impact of overshooting convection on lower-stratospheric air composition
• AMSR-E passive microwave imager observations of above-anvil plume storms
• Hazardous storm forecasting over Lake Victoria and other African Great Lakes
• Geostationary satellite imager calibration analysis
• Airborne and space-borne Doppler wind lidar
THANK YOU!!!! kristopher.m.bedka@nasa.govYou can also read