New Hypertensive Retinopathy Grading Based on the Ratio of Artery Venous Diameter from Retinal Image
←
→
Page content transcription
If your browser does not render page correctly, please read the page content below
Date of publication JUN-28, 2021, date of current version JUN-02, 2021.
www.computingonline.net / computing@computingonline.net
Print ISSN 1727-6209
Online ISSN 2312-5381
DOI 10.47839/ijc.20.2.2069

 New Hypertensive Retinopathy Grading
 Based on the Ratio of Artery Venous
 Diameter from Retinal Image
 BAMBANG KRISMONO TRIWIJOYO1,2, BOY SUBIROSA SABARGUNA3,
 WIDODO BUDIHARTO1, EDI ABDURACHMAN1
 1
 Binus Graduate Program Bina Nusantara University, Jl. Kebon Jeruk No.27, Jakarta, Indonesia
 (e-mail: bambang.triwijoyo@binus.ac.id, wbudiharto@binus.edu, edia@binus.edu)
 2
 Department of Computer Science, Faculty of Engineering and Health, Bumigora University, Jl. Ismail Marzuki, Mataram, West Nusa Tenggara,
 Indonesia (e-mail: bambang.triwijoyo@binus.ac.id)
 3
 Department of Community Medicine, Faculty of Medicine, University of Indonesia, Jl. Pegangsaan Timur, Central Jakarta City, Indonesia
 (e-mail: sabarguna08@ui.ac.id)

 Corresponding author: Bambang Krismono Triwijoyo (e-mail: bambang.triwijoyo@binus.ac.id).

 ABSTRACT Medical research indicated that narrowing of the retinal blood vessels might be an early indicator
of cardiovascular diseases; one of them is hypertensive retinopathy. This paper proposed the new staging method
of hypertensive retinopathy by measure the ratio of diameter artery and vein (AVR). The dataset used in this
research is the public Messidor color fundus image dataset. The proposed method consists of image resizing using
bicubic interpolation, optic disk detection, a region of interest computation, vessel diameter measuring, AVR
calculation, and grading the new categories of Hypertensive Retinopathy based on Keith-Wagener-Barker
categories. The experiments show that the proposed method can determine the stage of hypertensive retinopathy
into new categories.

 KEYWORDS hypertensive retinopathy; grading; artery-vein diameter ratio.

I. INTRODUCTION varies from one inspection to the next, even when the same

C ARDIOVASCULAR disease, such as stroke and
 coronary heart disease, is a major cause of morbidity
and mortality worldwide [1]. Studies show that the first
 human being is involved. Therefore, reproducibility is a
 major concern [4]. The average human grader usually needs
 to spend up to twenty minutes per retinal image to complete
major marker of cardiovascular risk is narrowing of the measurements, so this method is certainly not feasible for
retinal arteries [2]. The measurement that has been used to large-scale research studies and clinical utility. There is a
measure the degree of narrowing is the ratio of arterial- need for a more precise and efficient system that can assess
venous diameter (AVR) [3]. The AVR ratio is determined by retinal blood vessels automatically. This paper proposes a
measuring the diameter of the individual retinal arteries and new method of measuring the ratio of arterial and venous
venous caliber. Lower AVR is associated with higher blood diameter (AVR) and determining the grade of hypertensive
pressure and an increased risk of stroke, diabetes, and retinopathy based on the new category.
hypertension. AVR is calculated by measuring the diameter Existing techniques for vessel detection in retinal images
of the retinal vessels from retinal images; this method are classified into two categories: scanning methods [5] and
requires time and is very operator-dependent. First must be tracking methods [6]. The scanning method requires two-
determined the type of vessels (arteries or veins), then step processing of each pixel image: increase and threshold.
measured the diameter of each blood vessel, and then Additional tracking steps are needed if the application
measured manually. This process not only takes time but requires that the vessel structure be identified. Instead, the

VOLUME 20(2), 2021 221

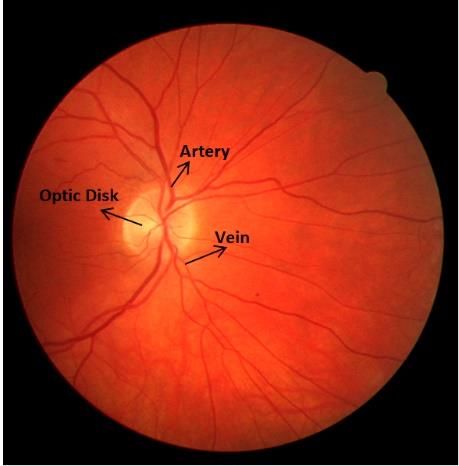
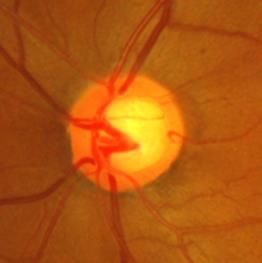
Bambang Krismono Triwijoyo et al. / International Journal of Computing, 20(2) 2021, 221-227

tracking approach uses local image properties to track
vessels from the starting point. This approach is faster
because it only processes pixels that are close to the vessel.
In boundary detection, vessel edges are detected by edge
detectors [7], morphological methods [8], or deformable
models [9]. Mounting edges that minimize the distance
between the original data and the predetermined model are
used in vessel extraction [5, 10]. It was stronger because it
extracted the vessel as a whole.
 Various models have been designed to create vascular
profiles: regular [11], triangular [12], Elliptical [13], and
Gaussian [5, 14]. However, all of these models do not
consider the reflection of central light on the vessel [15].
AVR estimation is a challenging task and requires the Figure 1. The Stages of the proposed method
detection of optical disks in segmented blood vessels.
Optical disk detection is needed to determine the area of B. DATASET
interest (ROI) when measuring the ship. The semi-automatic We use secondary data of retinal image dataset from open
method using wavelet Gabor and morphological operations source database Messidor. This database was consisting of
was proposed by Ortiz et al. [16]. This method was tested on 1200 retinal images of 1440 x 960 pixels in TIFF format
a clinically obtained database of 30 images with an accuracy downloaded on the page http://www.adcis.net/en/Download-
of 57%. Agurto et al. [17] presented the method of ship Third-Party/Messidor.html [22]. In this study, we sampled
segmentation based on the improvement of multi-scale linear 100 images from the Messidor database in the “Base11”
structures and the second-order local entropy thresholding. folder, and resized them into image sizes 256 x 256 pixels,
This method was tested on 74 fundus images with 80% respectively using bi-cubic interpolation [23]. Fig. 2 shows a
accuracy. AVR calculations are performed on (0.5-1) optical color retinal image showing artery-vein of the blood vessel
disk (DD) diameters which can give inappropriate results. and optic disk area.
Manikis et al. [18] presented the jute-based vessel
segmentation method along with thresholds and reached an
accuracy of 93.71% and 93.18% for DRIVE and STARE
respectively. In the calculation of AVR, the area of interest
(ROI) is highly dependent on optical disk detection but they
do not provide a clear idea of the optical disk detection
method used in their work. Khitran et al. [19] presented a
new method of AVR calculation. They tested their method
on 58 fundus images from VICAVR and 40 images from the
DRIVE database and achieved an accuracy of 96.5% and
98%, respectively. The limitation of their work is that
sufficient descriptions of their results are not presented by
them. The remainder of this paper is divided into four parts
after this introductory part, the material and method sections.
 Figure 2. The retinal image
Then, the third part discusses the method and results and
discussion. In the last section, we conclude the results of this
 C. RESIZING IMAGE
study.
 The input image is resized to 256 x 256 using the bicubic
II. MATERIAL AND METHODS
 interpolation method [24]. This method was chosen because
 the result is finer at the edges than the bilinear interpolation.
 Bi-cubic uses 4 x 4 pixels neighbors to retrieve information.
A. THE PROPOSED METHOD
The stages of the proposed method, in general, are Bicubic produces sharper images and maybe an ideal
summarized in Fig. 1. The main processes are image combination of quality process and output time. To analyze
resizing, optic disk detection, a region of interest the results of the resizing process, three parameters such as
computation, vessel diameter measuring, scoring, and the Mean Square Error (MSE), Root Mean Squared Error
labeling. (RMSE), and Peak Signal-to-Noise Ratio (PSNR) were used
 to measure the similarity between two images [25]. These
 parameters are used to compare the results of resizing the
 image with the initial image or original image. MSE and

222 VOLUME 20(2), 2021
Bambang Krismono Triwijoyo et al. / International Journal of Computing, 20(2) 2021, 221-227
RMSE do not have unit values, while PSNR have decibels Calculate 4 square corner points around the OD area as
(dB) as a unit value, more similar of the two images, then follows:
MSE and RMSE values are getting closer to zero. Whereas = (( − ), ( − )), (9)
in PSNR, two images have a low level of similarity if the = (( + ), ( − )), (10)
PSNR value is below 30 dB. The equation used to calculate = (( − ), ( + )), (11)
the three parameters is as follows: = (( + ), ( + )). (12)
1
= ∑ −1 −1 2
=0 ∑ =0 [ ( , ) − ( , )] , (1) Create a square by making a connecting line point a to b,
b to c, c to d, and d to a.
= √ , (2)
2552
= 10 10 , (3) F. VESSEL EDGE DETECTION
Read the ROI area of the input image. Perform edge
where m is the image height, n is the image width, f(i, j) is detection using the Canny algorithm [27]. Read the green
the original image, and g(i, j) is the resizing image. To channel of the input image and perform median filtering with
measure the results of resizing, using the bicubic a 5x5 pixel filter size [28]. Perform histogram analysis for
interpolation method, we used 20 sample images and threshold determination. Read the highest intensity value of
calculated the values of MSE, RMSE, and PSNR, and the image and read the number of pixel intensity, if the
compared them with two other methods of resizing bilinear number of pixels less than 10 percent of the total number of
interpolation and nearest-neighbor interpolation. pixel image, read the second highest intensity, and so on until
the number of pixels is more or equal then 10 percent of the
D. OPTIC DISK (OD) DETECTION total number of the pixel image. Finally, read the value pixel
Read the red channel of the input image and calculate the intensity as the threshold value.
average of 1.5 area of OD. Perform histogram analysis for
threshold determination, read the highest intensity value of G. VESSEL PROFILING EXTRACTION
the image, read the number of pixel intensity, read value as Read the ROI area of the input image. Draw a line from the
a threshold value (T). Perform image segmentation using a center point of the ROI (x1, y1) to the point (x2, y2) the far
threshold value. edge toward the edge of the ROI area for angle values (θ)
from 0 to 359, For each line, determine the coordinate points
1 ( , )≥ of the two sides of the left edge of the vessel (Lx, Ly) and the
( , ) = {0 ℎ . (4)
right edge side of the vessel (Rx, Ry).
For each area, the histogram segmentation results,
determine initial coordinate points within the area at random, = 2 − ∗ ( + ), (13)
2
do region growing on eight neighbors [26]. For each area the
= 2 + ∗ ( + ), (14)
segmentation results of the growing region determine the 2
center point of the area from the average of its x-y = 2 − ∗ ( + 3 ∗ ), (15)
2
coordinates circle shape detection using Hough transform.
For each edge pixel area: = 2 + ∗ ( + 3 ∗ ). (16)
2
= + cos( ), (5) Fig. 3 shows Mapping the points on the left side (Lx, Ly)
= + cos( ). (6) and right side (Rx, Ry) of an edge pixel (x2, y2).
Calculate the image gradient:
[ ( , )] = [ , ] = [ , ]. (7)
Finally, select the area closest to the shape of the circle
as the OD area.
E. REGION OF INTEREST (ROI)
Read the input image of OD area detection results, read the
coordinates of the center point of the OD (xi, yi), specify the
ROI area.
Figure 3. Mapping point (x1,y1),(x2,y2),(Lx,Ly) and (Rx,Ry)
= 1.5 8 . (8)
VOLUME 20(2), 2020 223
Bambang Krismono Triwijoyo et al. / International Journal of Computing, 20(2) 2021, 221-227

 Read the green channel of the input image, Do smoothing K. IMAGE GRADING
Gaussian filter and perform average filtering with 3x3 pixel For each input image, read the AVR input image and
filter size. determine the new categories of Retinopathy Hypertension
 based on Keith-Wagener-Barker categories [21].
H. NOISE REDUCTION If (0.67 ≤ AVR ≤ 0.74) then Normal
Read the ROI area of the input image, count the number of If (0.51 ≤ AVR ≤ 0.66) then Borderline 1
edge pixels of each vessel (N), read left edge point intensity If (0.40 ≤ AVR ≤ 0.50) then Grade 1
(IL), read right edge pixels intensity (IR). If IL> IR calculate If (0.34 ≤ AVR ≤ 0.39) then Borderline 2
the number of left edge pixels (NP IL), else If IR> IL If (0.31 ≤ AVR ≤ 0.33) then Grade 2
calculate the number of right edge pixels (IR NP). Calculate If (0.25 ≤ AVR ≤ 0.30) then Borderline 3
the ratio of the number of edge pixels. If (N / (NP IL + NP If (0.23 ≤ AVR ≤ 0.24) then Grade 3
IR)) ≥ 0.95 then the edge of the vessel, else If (N / (NP IL + If (0.20 ≤ AVR ≤ 0.22) then Borderline 4
NP IR))
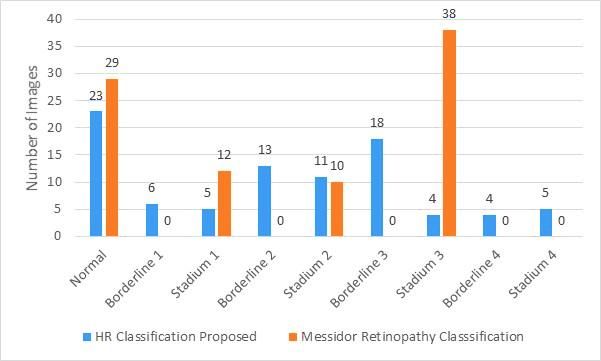
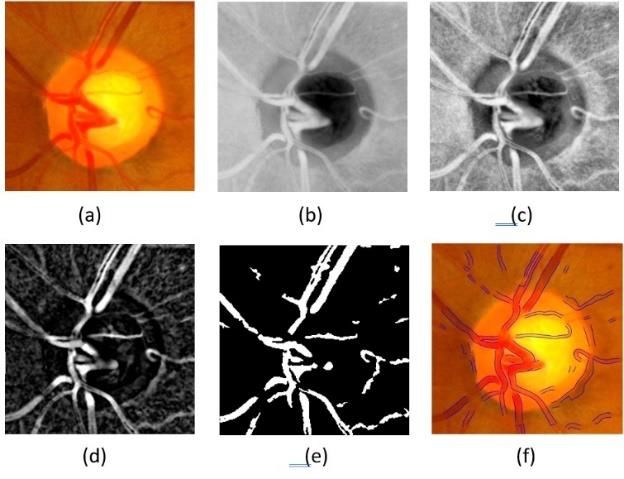
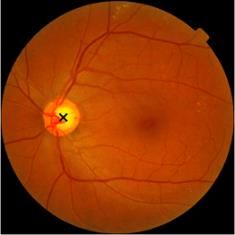
Bambang Krismono Triwijoyo et al. / International Journal of Computing, 20(2) 2021, 221-227

 Fig. 4 shows a graph of the average of Mean Square Error entire vessel segment for arterial and venous categories to
(MSE), Root Mean Squared Error (RMSE), and Peak Signal- obtain the AVR value.
to-Noise Ratio (PSNR) of 20 sample images. The blue line
is the value of the resizing process using the bicubic
interpolation method, the orange color line is the value of the
resizing result using the bilinear interpolation method, and
the green color line is the value of the resizing result using
the nearest neighbor method. The bicubic interpolation
method has the smallest error level for image resizing
compared to the other two methods, bilinear interpolation,
and nearest-neighbor interpolation.
 The second process detected the location of the optic disk
Fig. 5 shows sample images after optic disk detection; we
select the potential OD regions by computing the area of the
retinal image.

 Figure 7. (a) Original Image, (b) Green channel, (c)
 Adaptive histogram equalization, (d) Morphology, (e)
 Segmented, (f) Vessel edge
 Fig. 8 shows a graph of the average of AVR value, The
 horizontal axis is the average value of CRAE, CRVE, and
 Figure 5. Optic Disk detected
 AVR from 89 sample images, and the vertical axis is the
 From 100 samples image, 89 images correctly detected vessel diameter value calculated and artery-vein ratio.
the location of OD and precisely determined the area of ROI,
while 11 images failed to determine the location of OD and
determined the area of ROI, this is because there is an area
in the retina whose brightness level exceeds the average
brightness level of OD.
 The third process computed the region of interest (ROI)
area in the retinal image, The ROI area is determined based
on the optical disk detection point then cropping in the area
around the optical disk with a size of 1.5 the diameter of the
optical disk. Fig. 6 shows the region of interest selected.

 Figure 8. Graph of AVR Value According to the Image
 Samples
 Fig. 9 shows the hypertensive retinopathy stage
 categorized based on the AVR value. The blue bar is the
 result of classification based on the new classification
 proposed of hypertension retinopathy, while the orange bar
 is the result of the retinopathy classification from Messidor.

 Figure 6. Region of Interest area selected
 The fourth step detected the edge of the vessel, extracted
the arterial and venous profiles, and noise reduction to
eliminate the wrong detection of the edge of the vessels.
Fig. 7 shows the results of the edge detection processes.
 The fifth process measured the diameter ratio of arteries
and veins (AVR). AVR measurement begins by categorizing
arteries and veins on all vessel segments. Then each vessel
segment is determined to be the smallest and largest diameter
from the list of diameter measurements; this applies to all
vessel segments of the arterial and venous categories. The Figure 9. The classification Result
last is to determine the smallest and largest diameter of the

VOLUME 20(2), 2020 225
Bambang Krismono Triwijoyo et al. / International Journal of Computing, 20(2) 2021, 221-227

 In Fig. 9, the results of the proposed new classification Image., vol. 17, issue 2, pp. 263–273, 1998.
 https://doi.org/10.1109/42.700738.
produce smoother grades into nine classes compared to the
 [7] M. Lalonde, L. Gagnon, and M. C. Boucher, “Non-recursive paired
Messidor classification of only four classes, namely grade 0 tracking for vessel extraction from retinal images,” Proceedings of the
to grade 3. The results of our testing method for classification International Conference on Vision Interface, 2000, pp. 61–68.
into 4 classes were compared with the Messidor label class, [8] R. M. Haralick, S. R. Sternberg, and X. Zhuang, “Image analysis using
 mathematical morphology,” IEEE Trans. Pattern Analysis Mach.
from a total of 89 sample images 87 images were classified
 Intell., vol. PAMI-9, pp. 532–550, 1987.
to the correct class with an accuracy rate of 97.76%. Table 1 https://doi.org/10.1109/TPAMI.1987.4767941.
shows a comparison of the performance of retinopathy [9] T. McInerney and D. Terzopoulos, “Deformable models in medical
classifications between the proposed methods and those of image analysis: a survey,” Medical Image Analysis., vol. 1, issue 2,
 pp. 91–108, 1996. https://doi.org/10.1016/S1361-8415(96)80007-7.
other previous researchers.
 [10] M. Goldbaum, S. Moezzi, A. Taylor, and S. Chatterjee et al.,
 Table 1. Performance Comparison “Automated diagnosis and image understanding with object
 extraction, object classification, and inferencing in retinal images,”
 Author Dataset Accuracy (%) Proceedings of the IEEE International Conference Image Processing,
 (Images) vol. 3, 1996, pp. 695–698.
 Ortiz et al. [16]. Local (30) 57 [11] O. Chutatape, Z. Liu, and S. M. Krishnan, “Retinal blood vessel
 Agurto et al. [17]. Local (72) 80 detection and tracking by matched Gaussian and Kalman filters,”
 DRIVE 93.71 Proceedings of the 20th Annual Conference. IEEE Engineering. Med.
 Manikis et al. [18] Biol. Soc., 1998, pp. 3144–3148.
 STARE 93.18
 VICAVR 96.5 [12] I. Liu and Y. Sun, “Recursive tracking of vascular networks in
 Khitran et al. [19] angiograms based on the detection-deletion scheme,” IEEE Trans.
 DRIVE 98
 Medical Image., vol. 12, issue 2, pp. 334–341, 1993.
 Proposed Method MESSIDOR 97.76
 https://doi.org/10.1109/42.232264.
 [13] P. Jasiobedzki, C. J. Taylor, and J. N. H. Brunt, “Automated analysis
IV. CONCLUSION of retinal images,” Image Vision Computing, vol. 11, issue 3, pp. 139–
In this paper, we discuss a new technique for determining the 144, 1993. https://doi.org/10.1016/0262-8856(93)90052-I.
stage of hypertension retinopathy based on the ratio of [14] G. Luo, O. Chutatape, and S. M. Krishnan, “Detection and
 measurement of retinal vessels in fundus images using amplitude
arterial-venous diameter (AVR), which can measure the modified second-order Gaussian filter,” IEEE Tran. Biomed. Eng.,
diameter of arteries and veins. The process begins with vol. 49, issue 2, pp. 168–172, 2002.
resizing to 256 x 256 pixels, using bicubic interpolation with https://doi.org/10.1109/10.979356.
better results. Our method applies software to measure the [15] W. H. Spencer, “Ophthalmic Pathology: An Atlas and Text-book.”
 Philadelphia, PA: Saunders, 1996.
diameter of blood vessels of the retina. The determination of [16] D. Ortíz, M. Cubides, A. Suárez, M. Zequera, J. Quiroga, J. Gómez,
arteries and veins is determined by the semi-automatic & N. Arroyo, “Support system for the preventive diagnosis of
method to obtain the AVR value. hypertensive retinopathy,” Proceedings of the 2010 Annual
 The results obtained, with our system, can be used as a International Conference of the IEEE Engineering in Medicine and
 Biology, 2010, pp. 5649-5652.
tool for determining the stage of hypertensive retinopathy https://doi.org/10.1109/IEMBS.2010.5628047.
based on AVR with an accuracy rate of 97.76%. [17] C. Agurto, V. Joshi, S. Nemeth, P. Soliz, & S. Barriga, “Detection of
Furthermore, this method can be developed by adding hypertensive retinopathy using vessel measurements and textural
different parameters such as narrowing of focus, nickel features,” Proceedings of the 2014 36th Annual International
 Conference of the IEEE Engineering in Medicine and Biology Society,
arteriovenous, and other features, to get more accurate 2014, pp. 5406-5409. https://doi.org/10.1109/EMBC.2014.6944848.
results. [18] G. C. Manikis, V. Sakkalis, X. Zabulis, P. Karamaounas, A.
 Triantafyllou, S. Douma, & K. Marias, “An image analysis framework
References for the early assessment of hypertensive retinopathy signs,”
[1] National heart lung and blood institute, The Morbidity and Mortality: Proceedings of the 2011 IEEE E-Health and Bioengineering
 Chartbook on Cardiovascular, Lung and Blood Diseases, US Conference (EHB), 2011, pp. 1-6.
 Department of Health and Human Services, National Institute of [19] S. Khitran, M. U. Akram, A. Usman, & U. Yasin, “Automated system
 Health, Bethesda, MD, 1998. for the detection of hypertensive retinopathy,” Proceedings of the
[2] T. Y. Wong, R. Klein, B. E. K. Klein, and J. M. Tielsch et al., “Retinal 2014 4th IEEE International Conference on Image Processing Theory,
 microvascular abnormalities, and their relation to hypertension, Tools and Applications (IPTA), 2014, pp. 1-6.
 cardiovascular diseases, and mortality,” Survey Ophthalmol., vol. 46, https://doi.org/10.1109/IPTA.2014.7001984.
 pp. 59–80, 2001. https://doi.org/10.1016/S0039-6257(01)00234-X. [20] L. D. Hubbard et al., “Methods for evaluation of retinal microvascular
[3] L. D. Hubbard and R. J. Brothers et al., “Methods for evaluation of abnormalities associated with hypertension/sclerosis in the
 retinal microvascular abnormalities associated with atherosclerosis risk in communities study,” Ophthalmology, vol. 106,
 hypertension/sclerosis in the atherosclerosis risk in communities pp. 2269–2280, 2013. https://doi.org/10.1016/S0161-6420(99)90525-
 studies,” Ophthalmology, vol. 106, pp. 2269–2280, 1999. 0.
 https://doi.org/10.1016/S0161-6420(99)90525-0. [21] L. Downie, S. Rogers, and P. P. Connell, “Hypertensive retinopathy:
[4] T. Y.Wong, L. D. Hubbard, and R. Klein et al., “Retinal microvascular Comparing the Keith-Wagener-Barker to a simplified classification?,”
 abnormalities and blood pressure in older people: the cardiovascular Journal of Hypertension, vol. 31, issue 5, pp. 960-965, 2013.
 health study,” Br. J. Ophthalmol., vol. 82, pp. 1007–1013, 2002. https://doi.org/10.1097/HJH.0b013e32835efea3.
 https://doi.org/10.1136/bjo.86.9.1007. [22] Messidor, Methods for Evaluating Segmentation and Indexing
[5] A. Hoover, V. Kouznetsova, and M. Goldbaum, “Locating blood techniques Dedicated to Retinal Ophthalmology. [Online]. Available
 vessels in retinal images by piecewise threshold probing of a matched at: http://www.adcis.net/en/Download-Third-Party/Messidor.html.
 filter response,” IEEE Trans. Medical Image., vol. 19, issue 3, pp. [23] J. Titus, M. T. S. CSE, and S. Geroge, “A comparison study on
 203–210, Mar. 2000. https://doi.org/10.1109/42.845178. different interpolation methods based on satellite images,”
[6] Y. A. Tolias and S. M. Panas, “A fuzzy vessel tracking algorithm for International Journal of Engineering Research & Technology. vol. 2.
 retinal images based on fuzzy clustering,” IEEE Trans. Medical Issue. 6, pp. 82–85. 2013.

226 VOLUME 20(2), 2021

Bambang Krismono Triwijoyo et al. / International Journal of Computing, 20(2) 2021, 221-227

[24] S. Yuan, M. Abe, A. Taguchi, and M. Kawamata, “High accuracy knowledge. Currently, the books he has written have reached 68
 bicubic interpolation using image local features,” IEICE Transactions titles, mainly in the field of hospital management, and made
 on Fundamentals of Electronics, Communications, and Computer software with a team of 8 IPRs in the form of a Decision Support
 Sciences, vol. 90, issue 8, pp. 1611–1615, 2007. System.
 https://doi.org/10.1093/ietfec/e90-a.8.1611.
[25] H.S. Prashanth, H.L. Shashidhara, & K.N. Balasubramanya Murthy, WIDODO BUDIHARTO is a professor of
 M. “Image scaling comparison using universal image quality index,” Artificial Intelligence at the School of
 Proceedings of the 2009 International Conference on Advances in Computer Science, Bina Nusantara
 Computing, Control, and Telecommunication Technologies, 2009, pp. University, Jakarta – Indonesia. He
 859-863. https://doi.org/10.1109/ACT.2009.218. obtained his bachelor’s degree, major in
[26] A. Bhuiyan, R. Kawasaki, and E. Lamoureux, “Retinal artery – vein physics from the University of Indonesia
 caliber grading using color fundus,” Computer Methods and Programs (UI), Jakarta – Indonesia in 2000. He
 in Biomedicine, vol. 111, issue 1, pp. 104–114, 2013. continued his study in information
 https://doi.org/10.1016/j.cmpb.2013.02.004. technology major at STT Benarif, Jakarta
[27] J. Canny, “A computational approach to edge detection,” IEEE – Indonesia, and obtained his Master in
 Transactions on Pattern Analysis and Machine Intelligence, vol. 8, Information Technology in 2003. He
 issue 6, pp 679–698, 1986. obtained his Ph.D. in Electrical Enginee-
 https://doi.org/10.1109/TPAMI.1986.4767851. ring from the Institute of Technology Sepuluh Nopember (ITS),
[28] R. C. Gonzalez, R. Woods, Digital Image Processing, 3rd ed, Pearson Surabaya – Indonesia in 2012. He took his Ph.D. Sandwich
 Prentice Hall, 2008. Program in Robotics and Artificial Intelligence at Hosei University
 – Japan and Postdoc in Robotics and Artificial Intelligence at Hosei
 University – Japan, and Erasmus Mundus Scholar EU Univer-site
 de Bourgogne – French Indonesia Consortium (FICEM) – French
 BAMBANG KRISMONO TRIWIJOYO is in 2017, in 2016, in 2008, respectively. His research interest is in
 a doctoral candidate in the doctoral intelligence systems, data science, robot vision, and computational
 program in Computer Science, Bina intelligence.
 Nusantara University, Jakarta –
 Indonesia. He obtained a bachelor's EDI ABDURACHMAN obtained the
 degree, majoring in Informatics Professorship of Statistics in 2008 and
 Engineering, STIKI Malang – Indonesia was inaugurated at Bina Nusantara
 in 1992. He continued his master's University in 2009. He graduated from
 degree in Informatics Engineering from Iowa State University, Ames, the USA
 the Sepuluh November Institute of with a doctoral degree in statistics in
 Technology (ITS), Surabaya – Indonesia. 1986. The Master of Science conferred
 He obtained his Masters’s in Computer from the same University in a statistics
Engineering in 2003. The author is an assistant professor at survey in 1983. He also earned a Master
Bumigora University until now. Starting in 2016 he continued his of Science degree in applied statistics
doctoral studies in the doctoral program in Computer Science, Bina from Bogor Agricultural University. He
Nusantara University, Jakarta – Indonesia. He is a member of obtained the Agriculture Engineering
Indonesian pattern recognition (INAPR), Indonesian Informatics Degree (Ir) from IPB (cum laude) in 1978. Since 1986, He has
Expert Association (IAII). His research interests are in image served as a lecturer at Bina Nusantara University, Jakarta. His
processing, pattern recognition, artificial intelligence especially in teaching expertise included Linear Algebra, Discrete Mathematics,
the medical field. Mathematical Statistics, Business Statistics, Operations research,
 Information Systems, Research Methods, and others. He has
 Boy Subirosa Sabarguna was born in professional experience as a statistical consultant for various
 Majaleng-ka, West Java, in 1958. The companies in Indonesia and attends varied national and
 author completed his medical education international statistical courses. He was invited as a speaker at
 at the Faculty of Medicine, University of international conferences and various seminars, e.g., Statistics and
 Indonesia (FK UI) in 1984, completed his data Utilization for Agricultural Policy of Indonesia in Myanmar and
 education in Hospital Administration the Economics Modeling for Agricultural Sector. The case of
 (MARS) at the University of Indonesia Predicting some Agricultural Strategic Commodities; The Office of
 (UI) in 1991, and graduated from the Agricultural Economics (OAE) and JICA ASEAD, in Bangkok,
 Doctor of Postgraduate Program at Thailand. He also published research in statistics. He is also a
 Gajah Mada University in 2001. The member of the American Statistics Association, the International
 author is currently active as a lecturer at Association of Engineers (IAENG), and the honorary member of
 the Public medical science, University of the MU SIMA RHO Society.
Indonesia (IKK-FKUI), TBM-PPSUI, and as a Hospital
Management Consultant. The author is also active in writing books
in the context of developing, improving, and disseminating

VOLUME 20(2), 2020 227


You can also read