Industry Insight New Zealand Ports and Freight Yearbook - Deloitte
←
→
Page content transcription
If your browser does not render page correctly, please read the page content below

Industry Insight
New Zealand Ports and Freight Yearbook
2020
New Zealand ports and freight yearbook 2020 | Contents

Contents

 Introduction                                            3
 Glossary                                                4
 Global Perspectives                                     6
 In Focus                                                17
 The Business of Technology Revolution                   20
 Cyber Security                                          24
 Domestic Environment                                    27
 New Zealand Freight Task                                30
 Port Performance                                        39
 Port Performance Over Time                              49
 Port Summaries                                          53
 Our Infrastructure & Capital Projects Offering          67

                                                              2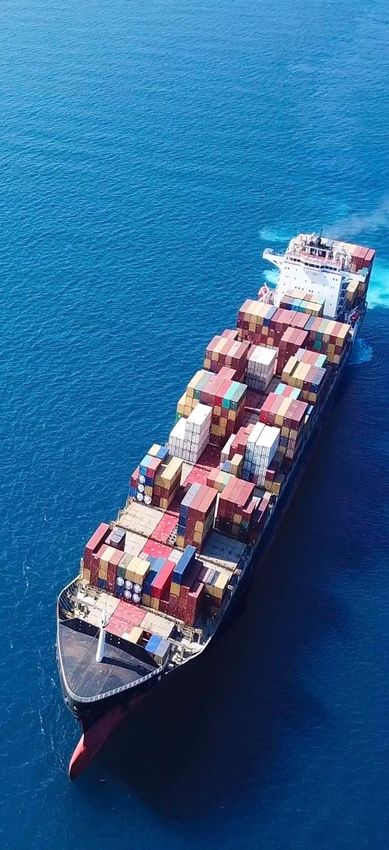
New Zealand ports and freight yearbook 2020 | Introduction

Introduction

 The Deloitte New Zealand Ports and               We are pleased to release this
 Freight Yearbook presents a concise              Yearbook as part of Deloitte’s
 snapshot of macroeconomic and                    Infrastructure & Capital Projects (ICP)
 domestic drivers of New Zealand port             integrated market offering.
 and freight activity. Additionally, we
 include insight pieces on key trends in          Our domestic and global network of
 the shipping industry. We welcome                ICP professionals, allow us to bring
 your feedback and look forward to                together deep skills to provide
 future discussion and engagement.                integrated solutions to all segments of
                                                  the infrastructure industry and across
 The Yearbook has been prepared with              the lifecycle of an asset.
 contribution from Deloitte’s specialist
 economic advisory team, Deloitte                 Our ICP services help clients to:
 Access Economics, who have provided              • Develop investment selection and
 global and domestic economic                       project delivery confidence;
 insights. We are also pleased to                 • Effectively plan, manage and
 welcome ‘In Focus’ pieces from our                 control a project’s cost and delivery
 Consulting, Risk Advisory, and                     schedule;
 Corporate Finance service lines.                 • Better manage and optimise
                                                    existing assets, and
 Our Consulting service line provides a           • Introduce digital transformation
 perspective on the role of technology              opportunities across the asset
 in supply chain industries and how                 lifecycle.
 these ‘shifts’ will shape the adoption
 and implementation of digital
 technologies. Risk Advisory provide a
 case study on the Maersk cyber
 security breach, Deloitte’s role in
 remedying the breach, and some
 lessons learned. Our Corporate
 Finance team also provide insights
 into value based asset management
 developments.

 The Yearbook also presents recent
 data on the New Zealand freight task
 alongside operational and financial
 performance data for New Zealand’s
 major ports.

                                                                                            3
New Zealand ports and freight yearbook 2020 | Glossary

Glossary

Brexit                      United Kingdom’s Exit from the European Union    NZTA    New Zealand Transport Agency
CCFI                        China Containerised Freight Index                OCR     Official Cash Rate
CNG                         Compressed Natural Gas                           OECD    Organisation for Economic Co-operation and Development
EBIT                        Earnings Before Interest and Tax                 ONE     Ocean Network Express
EIA                         Energy Information Administration                PPP     Public Private Partnership
FEU                         Forty-foot Equivalent Unit                       RBNZ    Reserve Bank of New Zealand
FIGS                        Freight Information Gathering System             RCD     Remote Container Device
FTA                         Free Trade Agreement                             RCM     Remote Container Management
GDP                         Gross Domestic Product                           RORO    Roll-on Roll-off
GFC                         Global Financial Crisis                          T&L     Transport and Logistics
GT                          Gross Tonnes                                     TEU     Twenty-foot Equivalent Unit
HFO                         Heavy Fuel Oil                                   TPP     Trans Pacific Partnership
ICP                         Infrastructure & Capital Projects                TWI     Trade Weighted Index
IMF                         International Monetary Fund                      ULSFO   Ultra Low Sulphur Fuel Oil
IMO                         International Maritime Organisation              USMCA   United States-Mexico-Canada Free Trade Agreement
IoT                         Internet of Things                               WTO     World Trade Organisation
LNG                         Liquefied Natural Gas
LPG                         Liquefied Petroleum Gas
MoT                         Ministry of Transport
NFDS                        National Freight Demands Study
NPAT                        Net Profit after Tax
NZIER                       New Zealand Institute of Economic Research Inc

                                                                                                                                              4
New Zealand ports and freight yearbook 2020 | Glossary

Glossary

 COUNTRIES                                                                 PORTS
 BRA                        Brazil                                         AKL     Ports of Auckland
 CHN                        China                                          BLU     Southport (Bluff)
 DEU                        Germany                                        EST     Eastland Port
 IDN                        Indonesia                                      LYT     Lyttelton Port of Christchurch
 IND                        India                                          MLB     Port Marlborough
 JPN                        Japan                                          NPE     Napier Port
 KOR                        South Korea                                    NPL     Port Taranaki
 MYS                        Malaysia                                       NSN     Port Nelson
 SAU                        Saudi Arabia                                   NTH     Northport
 THA                        Thailand                                       POE     Port Otago
 USA                        United States of America                       TIU     PrimePort Timaru
 VNM                        Vietnam                                        TRG     Port of Tauranga
 TRADE ROUTES                                                              WLG     CentrePort (Wellington)
 AS-ME                      Asia to Middle East Trade Route
 AS-Med                     Asian to Mediterranean Trade Route
 AS-NA                      Asia to North America Trade Route
 AS-NE                      Asia to Northern Europe Trade Route
 AS-SA                      Asia to South America Trade Route
 AUS-FE                     Australia to Far East Trade Route
 NA-SA                      North America to South America Trade Route
 NE-NA                      Northern Europe to North America Trade Route
 NE-SA                      Northern Europe to South America Trade Route

                                                                                                                    5
Global Perspectives

                      6
New Zealand ports and freight yearbook 2020 | Global Perspectives

        Global perspectives – Deloitte Access Economics
        Global economy                                   Domestic demand in China is easing back as        Elsewhere, global monetary policy            Overall the global outlook for 2020 is
                                                         the economy shifts to a more sustainable          stimulus has increased in order to offset    more of a ‘muddle through’ view as major
        Growth in the global economy continued
                                                         growth model and starts to rein in debt           weaker economic demand. The US Federal       political conflicts and issues are
        to slow over 2019. Geo-political
                                                         levels. The economy expanded by 6.1% in           Reserve has cut the Federal Funds rate       (hopefully) resolved over the year ahead.
        uncertainty has dominated over the past
                                                         2019 and is expected to grow by just under        three times over 2019 to a current range     Beyond 2020, growth is expected to pick
        year, prompting decreased trade flows,
                                                         6% YoY in 2020 and 2021.                          of 1.50-1.75%, unwinding almost all of       up again gradually in response to
        heightened business uncertainty and
                                                                                                           the interest rate hikes it made in 2018.     increased certainty as well as monetary
        lower business investment. The IMF               One of the main political threats in 2019
        estimates that global growth was just            was Brexit, which added significant               In September 2019, the European Central      and fiscal support. Growth in advanced
        below 3% YoY in 2019, the lowest global          uncertainty to the UK’s economic outlook,         Bank (ECB) lowered its deposit facility      economies is forecast to rise to 1.9% YoY
        growth rate seen since 2009 in the midst         which was already weak. Growth in the UK          rate by 10bps to -0.5%. The ECB also         in 2020, while emerging market
        of the global financial crisis. The latter       is expected to be around 1.5% YoY for the         restarted its asset purchase programme       economies are expected to expand at a
        half of 2019 was characterised by global         next few years as business investment             from November, with a monthly purchase       pace of 4.8% YoY.
        trade tensions, Brexit uncertainty and           remains weak and consumer confidence              target of €20bn.
        geo-political events.                            low. The UK officially left the EU on January
                                                                                                           While these efforts from major central
                                                         31, 2020. However, a transition period will
        At the start of 2020, there were signs that                                                        banks will help offset some of the recent
                                                         be in place until the end of 2020. During
        the slump in growth might be bottoming                                                             demand weakness, monetary policy
                                                         that time the UK will still be part of the EU
        out. Monetary policy easing has helped                                                             settings are getting close to their lower
                                                         bloc for the purposes of the single market
        provide support for many major                                                                     bounds. As such, there is also increasing
                                                         and customs rules. The main priority now is
        economies. Global growth is expected to                                                            pressure on governments to step in with
                                                         for a new trade deal to be negotiated
        pick up somewhat to 3.3% in 2020 and                                                               fiscal support to help prop up demand in
                                                         between the UK and EU as soon as possible.
        3.4% in 2021.                                                                                      major economies.

                      Global economic policy uncertainty over time                                                               Global growth - actual and projections
                                                                                                           4%
         400
                                                                                                                                                                                  3.5%
                                                                                                                         3.8%                    3.6%
         350                  Global economic policy uncertainty
                                                                                                                                                               3.0%
                                                                                                           3%
         300

         250
Index

         200                                                                                               2%

         150

         100                                                                                               1%

          50

           -                                                                                               0%
               2002    2004   2006    2008    2010      2012       2014   2016   2018                                     2017                   2018     2019 (forecast)     2020 (forecast)
                                                                                                                                                                                                    7
Source: RBNZ Financial Stability Report November 2019                                                    Source: World Economic Outlook October 2019
New Zealand ports and freight yearbook 2020 | Global Perspectives

 Global perspectives – Deloitte Access Economics
  Global trade                                  In exchange the US has halted plans to        Coronavirus was discovered in the Wuhan            The Baltic Dry index – an index of
  Since 2018 there has been a noted shift in    impose another US$156bn of tariffs on         district of China in mid-January and has           shipping rates for raw materials across 20
  global trade policies toward a more           China and agreed to reverse tariffs           spread at a faster pace than the SARS              of the major global shipping routes –
  protectionist stance - led by trade tensions  introduced in September on around             outbreak that occurred in 2003. While it is        showed strong gains in the middle of
  between the US and China. Trade wars are      $120bn of Chinese imports. In addition        too early to gauge the extent of damage            2019 after a weak start to the year. The
  now seen as one of the biggest risks to the   the two countries agreed not to               the virus could cause, early estimates             index has since fallen back to a more
  global economic outlook. Where globalisation implement any further tariffs.                 suggest that it could reduce Chinese GDP           moderate level but remains higher than
  had been the dominant theme in recent                                                       by about 1 percentage point over 2020.             the average seen over 2017 and 2018.
                                                Global trade growth has slowed in 2019.       While a large share of this would be due
  decades, the past couple of years have seen                                                                                                    This implies that demand remains robust
                                                According to the IMF, the volume of trade     to lower travel and tourism services,
  a rise in ’decoupling’ of global economies.                                                                                                    and global trade may have bottomed out.
                                                is expected to have risen by a meagre 1%      consumption is also expected to decline.           However, risks to trade remain to the
  Trade discussions between the US and China over 2019. The IMF is forecasting global         This could negatively impact demand,               downside.
  improved somewhat at the end of 2019 after trade volumes will pick up considerably in       particularly for some of New Zealand’s
  the two countries came to a first-stage trade 2020, rising by 2.9% YoY, and then 3.7%       premium exports such as seafood and
  agreement. The agreement commits China to YoY in 2021. However there remains                high-value meat products, with NZ log
  buying more than US$40bn of US agricultural considerable uncertainty around these           exports already being impacted. Following
  goods annually and tightens up US             forecasts due to geo-political risks,         the SARS outbreak in 2003, beef and
  intellectual property protections.            ongoing trade talks and coronavirus           lamb prices fell 15-20% as demand fell.
                                                outbreak.

             World Trade Volume - Actual and Projections                                                                                Baltic Dry Index

                                          Imports: Advanced Economies                               5,000
  6%
                                                                                                    4,500
                                          Imports: Emerging Market and
                                          Developing Economies                                      4,000
  5%
                                          Exports: Advanced Economies
                                                                                                    3,500
                                                                                            Index

  4%                                                                                                3,000
                                          Exports: Emerging Market and
                                          Developing Economies
                                                                                                    2,500
  3%
                                                                                                    2,000
  2%                                                                                                1,500

                                                                                                    1,000
  1%
                                                                                                     500
  0%                                                                                                   0
                     2018                          2019                  2020                               2009   2010   2011   2012    2013   2014   2015   2016   2017    2018   2019
                                                                                                                                                                                              8
Source: World Economic Outlook October 2019                                                   Source: Reuters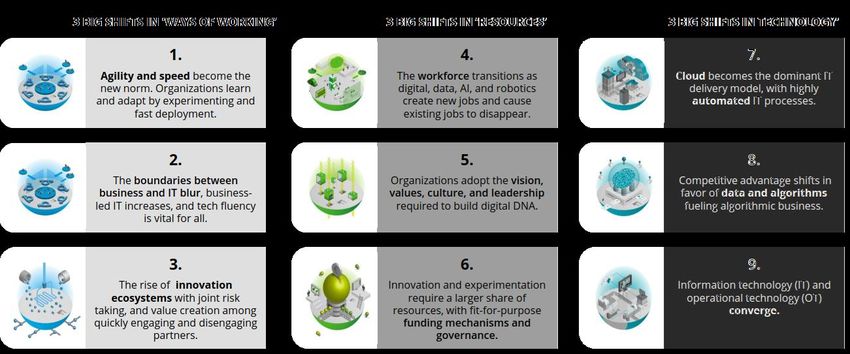
New Zealand ports and freight yearbook 2020 | Global Perspectives
Global perspectives
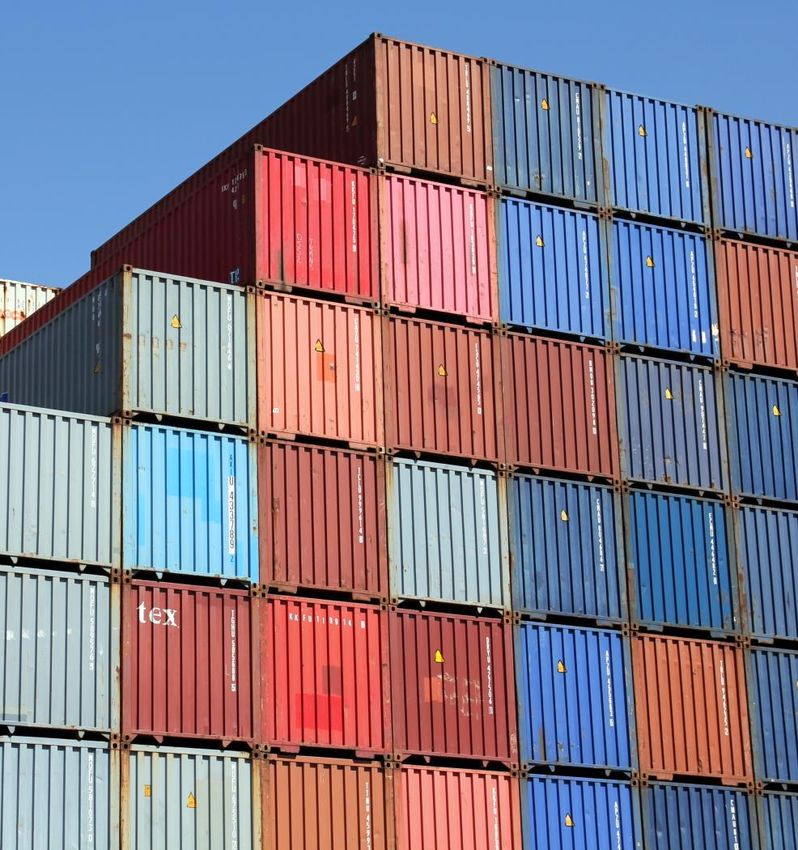
Container shipping A significant contributor to the 2020
sector outlook, is the implementation of
The shipping industry plays a pivotal role
the International Maritime Organisation’s
within the global economy. Since the
(IMO) 2020 sulphur cap.
1960’s the industry has been shaped by
the two mega trends of globalisation and This cap took effect on January 1st.
containerisation. Compliance will incur costs, with options
such as installment of scrubbers,
The international shipping industry carries
switching to low-sulphur fuels or acquiring
80% of world trade in goods, making free
new vessels.
global trade vital to the shipping industry.
If companies do not pass on these costs
The shipping industry is constantly
through the supply chain, profit margins
evolving, striving for increased efficiency
in the container shipping industry will be
through innovation with new larger ships
reduced, a failure to recover the costs
specialised for each trade and adopting
may even result in bankruptcies.
emerging technologies to boost efficiency
and improve environmental outcomes. To combat these negative factors, the
sector continues to consolidate in an
Despite these innovations, a recent report
effort to gain productivity efficiencies and
by Fitch Ratings predicts a negative
reduce financial losses. This is seen as
outlook for shipping in 2020. This is due
key to achieving sustainable freight rates
to forecast reduced global economic
that support profitability.
growth, trade tensions and geopolitical
risks adversely impacting shipping
demand.
Despite strong performance in recent
years, 2020 is expected to see more
subdued results for the industry. This can
be attributed to factors such as rising fuel
costs, declining container rates, an
oversupply of vessels, and the increasing
capital expenditure (CAPEX) required to
service ultra-large vessels within the
global fleet.
9
New Zealand ports and freight yearbook 2020 | Global Perspectives

Global perspectives
Container freight trends                                                                            Global freight task
Since 2000 the proportion of total global        The Asia-North America trade route sees                           60,000                                                                                      18.0%
freight that is containerised has steadily       the majority of Twenty-foot Equivalent
                                                                                                                                                                                                               16.0%
increased and, as of 2017, containerised         Units (TEU) shipped East bound, to North                          50,000
                                                                                                                                                                                                               14.0%
goods made up 15.7% of total freight             America from Asia.
(billion tonne-miles). The container share

                                                                                             Billion tonne-miles
                                                                                                                   40,000                                                                                      12.0%
                                                 China’s status as the world’s dominant
declined during 2018 as container tonne-                                                                                                                                                                       10.0%
                                                 exporter, is reflected in these container
miles decreased and an increase in total                                                                           30,000
                                                 freight trends. The West bound trade                                                                                                                          8.0%
freight was recorded. The container
                                                 between Asia and Northern Europe                                  20,000                                                                                      6.0%
portion of the global freight task is
                                                 reinforces this notion.
expected to remain at 14.7% throughout                                                                                                                                                                         4.0%
                                                                                                                   10,000
2019-2020.                                                                                                                                                                                                     2.0%
The top four container trade routes                                                                                               -                                                                              -
                                                                                                                                      2001 2003    2005 2007     2009 2011 2013         2015     2017 2019
illustrate the importance of Asia’s                                                                                                    Container     Other Dry      Oil/Gas/Chemicals          Container Share (RHS)
(especially China) participation in the                                                          Source: The Shipbuilders Association of Japan
container freight sector.

                                                                                                    Top trade routes

                                                                                                                                 30
                                                                                                                                 25

                                                                                                                   Million TEU
                                                                                                                                 20
                                                                                                                                 15
                                                                                                                                 10
                                                                                                                                  5
                                                                                                                                 -

                                                                                                                   West Bound             East Bound   North Bound   South Bound
                                                                                                 Source: Worldshipping

                                                                                                                                                                                                                       10
New Zealand ports and freight yearbook 2020 | Global Perspectives
Global perspectives
Consolidation Top 20 container lines (2019)
The global shipbuilding industry saw order The top five container shipping lines 4.5
4.0
books halve in value during 2019. This control nearly 60% of the global container
3.5
particularly impacted companies in China, ship capacity in a market where
Million TEU
3.0
South Korea and Japan, which account for economies of scale are considered vital. 2.5
2.0
more than 90% of the market.
The global containership supply is 1.5
1.0
China has been encouraging consolidation dominated (~80%) by: 0.5
among state-owned shipbuilders to reduce
X-Press…
0.0
• 2M Alliance (Maersk and MSC),
Antong Holding
Yang Ming
CMA CGM
Zim
COSCO
Evergreen
SITS
MSC
HMM
Zhonggu logistics
IRISL Group
KMTC
TS Lines
ONE
APM-Maersk
PIL
Hapag-Lloyd
Wan Hai
SM Line
overcapacity and stem losses. As such,
mainland China had its two biggest • the Ocean Alliance (CMA CGM, COSCO
shipbuilders, China State Shipbuilding and Evergreen) and
Corporation (CSSC) and China
• THE Alliance (ONE, Hapag-Lloyd and
Shipbuilding Industry Corporation (CSIC) Source: Alphaliner
Yang Ming)
merge in November 2019. This new group
reportedly accounts for half of China's These alliances carry influence among
overall capacity and employs over competitors globally, and also own many
300,000 people. CSSC has announced of the ultra-large container vessels. These
orders over US$4 billion. big ships have the ability to create scale
economies.
Further consolidation among shipbuilders
are occurring globally, driven by a tougher
profitability outlook for the sector.
Thomson Reuters reports “Two of South
Korea's largest builders, Hyundai Heavy
Industries and Daewoo Shipbuilding and
Marine Engineering are working on a
merger. Japan's two largest shipbuilders,
Japan Marine United Corporation and
Imabari Shipbuilding, are also planning a
merger.”
11New Zealand ports and freight yearbook 2020 | Global Perspectives
Global perspectives
Environmental Compliance options include: If fuel tariffs result in weaker demand,
sustainability we anticipate shippers will be
• Switching from high-sulphur fuel oil
incentivised to take ships out of
Global maritime transport companies have (HSFO) to marine gas oil (MGO) or
service for scrubber retrofits.
become concerned with environmental distillates. Distillate fuel will have
sustainability policy in recent years. higher fuel costs, and may require Maersk Line, MSC (Mediterranean
additional fuel treatment upgrades Shipping Company), CMA CGM, and
Fuel economy and environmental to vessels. Hapag-Lloyd have suggested that the
sustainability were prominent issues IMO 2020 regulation change will
during 2019. • Switching to very-low sulphur fuel
increase individual bunker fuel costs
or other compliant fuel blends
The International Maritime Organization between $1 million - $2 million p.a.
(0.50% sulphur). Some uncertainty
(IMO) 2020 regulation will reduce the cap exists for compliant new fuel costs
on sulphur in marine fuel from 3.50% to and availability. Further environmental
0.50% for human health and the considerations
environment. The most commonly used • Switching to Liquid Natural Gas
(LNG) or sulphur-free fuels. LNG as The IMO are also looking at further
marine fuel has a 2.7% sulphur content.
fuel is costly due to retrofitting, changes to reduce the level of CO2
This regulation came into effect on
regional variations in fuel price, emissions from the industry.
January 1st 2020 and is expected to raise
sector costs. space requirements for storage, One way of helping reduce emissions
and may need additional systems would be to implement speed limits on
The IMO 2020 regulation raises challenges installed (dependent on engine ships. This would clearly have important
for the shipping industry. Potential issues type). consequences for delivery times.
may include an increase in operating fuel
costs and price volatility, and a reduction • Installing scrubbers (exhaust gas
in supply capacity and vessel availability cleaning systems), which extract
as ships are taken out of service to fit the sulphur from HSFO as part of
scrubbers. the fuel burning process.
Installation of scrubbers with the
In an effort to maintain margins in the use of HSFO will increase costs.
face of higher operating costs, shippers’ Scrubbers typcially increase fuel
may introduce new bunker fuel consumption by 2-3% during the
surcharges and/or other means to recoup cleaning process. Furthermore
these operational costs. there are high installation and
maintenance costs, as well as space
requirements to house scrubber
towers and systems.
12New Zealand ports and freight yearbook 2020 | Global Perspectives
Global perspectives
Scrapping and ship supply It is forecast that global container
volumes will grow by about 2.5% in
Forecasts for scrapping in 2019 were
2020. This is well below the 4.5%
estimated at 26 million dwt (dead-weight
average annual growth rate
tonne) and 44 million dwt in 2020. There
experienced over the past eight years,
are expectations that scrapping of old
but represents a small increase from
vessels with smaller tonnage may
2019.
increase to avoid upgrade investments.
Initial forecasts for 2019 (IHS Markit)
Increased demand coupled with lower
expected modest fleet growth, with the
scrap prices resulted in lower than
global fleet increasing to 23.6 million
expected scrapping volumes for 2018
TEU. Despite increasing ship sizes, the
where scrapping dropped to a seven year
average vessel within the 2019 global
low of 27.6 million dwt.
fleet has grown just 2% in TEU capacity
During 2018, a total of 19 million dwt had from 2018.
been delivered in the total VLCC (very
Dry-bulk trading volumes grew 1.4% in
large crude carriers) fleet, whereas only
2019, with an expectation of 3%
four ships, were demolished in the same
growth during 2020 – due to higher
period, setting the industry up for a hard
iron ore and other commodity volumes.
supply and demand balance in the future.
Global tankers’ supply and demand are
While the scrapping of ships remained likely to grow by 2.5% and 3.5%,
relatively low during 2019, there is the respectively, in 2020, supporting a
possibility of increased scrapping during better supply-demand balance.
2020. A primary driver being new IMO
regulation which requires vessels to
switch to low-sulphur fuel or install
scrubbers to comply with sulphur
reductions.
13New Zealand ports and freight yearbook 2020 | Global Perspectives
Global perspectives
Ship size The current order book emphasises the
pursuit of scale with orders for ultra-large
The first container ship was introduced
container vessels continuing to be added.
in 1956. The Ideal X carried 58
containers. Within eight years the As expected, the Mediterranean Shipping
Associated Steamship company had Company (MSC) developed a new class of
introduced ships with a capacity of ultra-large ships with capacities of
nearly 1,000 TEU. Since then the 23,000+ TEU in 2019.
capacity of container ships has
MSC currently holds the record for TEU
continued to increase at a rapid rate.
capacity with MSC Gulsun capable of
The largest ships currently in service are
carrying 23,756 TEU. This ship is currently
now almost 400 metres in length and
the world’s largest container ship and
have a capacity of more than 23,000
brings with it new environmental and
TEU.
performance standards.
The continuous pursuit of economies of
CMA CGM will also receive nine ships in
scale is the rationale behind the ever-
the 22,500 TEU class from December
increasing size of container ships. Larger
2019. There are also rumours that OOCL,
vessels provide cost efficiencies in fuel,
recently acquired by COSCO, has ordered
crew and greenhouse gas emissions per
six ships at 23,000 TEU each.
container. However, there is a question
as to how long this trend of increasing Bunker fuel price plays an important role
ship size can continue. For a start, the in the economies of scale achieved by
world’s shipping lanes may simply not larger ships. The largest savings are due
be wide or deep enough to handle to the reduced cost of fuel per container
vessels significantly larger than those shipped. The implementation of the IMO
already under construction. 2020 regulations is also likely to have
consequences around realised economies
of scale. It is notable that nine new CMA
CGM ships are to be powered by Liquefied
Natural Gas (LNG). This is a much cleaner 2019 23,756
burning fuel source, emitting almost no
sulphur.
14New Zealand ports and freight yearbook 2020 | Global Perspectives
Global perspectives
Bunker Fuel Prices During September 2019 there was a Container Rates
drone strike on Saudi Arabian oil facilities.
One of the most significant determinants Container rates have proven relatively
This played a significant role in the 20%
of container line profitability is fuel prices. stable throughout 2019, experiencing a
spike in brent crude oil prices which
high of US$891 in Q1 and a low of
The price of HSFO bunker fuel (ClearLynx resulted in bunker fuel prices following.
US$777 Q3.
Bunker Fuel Oil 380 CST Singapore) was
In 2018 the average price for a tonne of
volatile over the last year. Rising as high The Chinese Containerised Freight Index
HSFO fuel had increased to US$348.
as US$589 in August 2019 and dropping (CCFI) has experienced an overall
During 2019, the average price of bunker
to US$279 in December 2019. increase from US$766 in 2016 to US$823
fuel rose to US$405, due to the spike in
in December 19.
The price peak can be attributed to September 2019. HSFO fuel is expected
intense buying interest and oil stockpiling to decline in response to reduced demand. The chart below illustrates the relatively
in the face of shrinking supply. unchanging container rates during 2019
Low Sulphur fuel demand and prices are
and the recent uplift to US$823 in Q4.
Suppliers are experiencing a market, anticipated to rise during 2020, with ICE
where near term prices are higher than Europe Low Sulphur Gasoil pricing sitting
longer-dated prices. As such, it is at US$606 during Q4 2019. The IMO 2020
unprofitable to ship new cargoes of fuel regulation, will drive up demand and
which are likely to lose value during prices for low sulphur and LNG fuels while
voyage. supply and prices for HSFO fuels are
expected to decline.
Bunker Prices Containerised Freight Index
900 900
800
850
700
US$ per tonne
600
800
500
400
750
300
200 700
Dec-16 Apr-17 Aug-17 Dec-17 Apr-18 Aug-18 Dec-18 Apr-19 Aug-19 Dec-19 Dec-16 Apr-17 Aug-17 Dec-17 Apr-18 Aug-18 Dec-18 Apr-19 Aug-19 Dec-19
Cost per metric tonne (PMT)
Source: Eikon, Deloitte analysis Low Sulphur Fuel HSFO Fuel Source: Eikon, Deloitte analysis 15New Zealand ports and freight yearbook 2020 | Global Perspectives
Global perspectives
International ports
The global container port and terminal
Top 20 ports
industry is also facing sustainability
pressures, as shippers are expected to
make greener choices. 45
These considerations are likely to have
40
cost implications and require additional
funding, reporting, capability and 35
technology developments to support
improved environmental outcomes. 30
To accommodate the ever-growing size of
Million TEU
25
containerships, ports will also need to
continue to invest in providing more 20
capacity and new technology, driving up
capital expenditure requirements and 15
operating costs. This is true not just for
major ports on the main trade routes 10
which are required to service ultra-large
5
container ships, but also ports on
secondary routes that are faced with a
-
cascade of larger vessels from main
Guangzhou
Hamburg
Antwerp
Los Angeles
SIngapore
Hong Kong
Xiamen
Rotterdam
Dalian
Shanghai
Busan
Qingdao
Kaohsiung
Laem Chabang
Shenzhen
Ningbo-Zhoushan
Tianjin
Tanjung Pelepas
Jebel Ali
Port Klang
routes that have been replaced.
Larger ships are segmenting container
terminals into those that can handle
larger ships versus those that cannot.
These ships make fewer visits, creating
2014 2015 2016 2017 2018
higher peak workflows, while demanding
Source: Annual Reports, Deloitte Analysis
faster handling.
16In Focus
Asset Management
17New Zealand ports and freight yearbook 2020 | In Focus
Asset Management
Maturing the approach Technology is a clear enabler for value Value Based Asset Management
based asset management and our ‘In
Asset management capability is maturing
Focus’ piece, ‘The Business of Technology
in asset intensive organisations around
Revolution’, illustrates how appropriate
the world, with an increasing trend Few
technology can support asset organisations
towards the adoption of a strategic view
management activities.
of asset management that effectively
balances value and risk, and aligns to best Improvements in data capture and Most
practice standards. algorithmic analysis through the Internet organisations
of Things (IoT) and digital planning
Value based asset management is about The Strategic
platforms, such as Anaplan, can help View
ensuring the highest level of value
infrastructure owners mature their asset
creation from the asset portfolio. Value The Economic View • A holistic view of the
management practices. asset’s lifecycle to
creation takes place over the entire
• Effective capital plan the optimal
lifecycle, and is optimised through the fact Taking a strategic view of asset Few rationing through
organisations (balanced)
based management of cost, risk and management is thought of as ‘nirvana’ to robust financial investments,
performance. some organisations, however it’s not an assessment of options operational and
unachievable state, it simply requires the (hurdle rates, NPVs maintenance
Most organisations have progressed from The Technical View etc.)
right approach and framework, and a strategies required to
a purely technical view of asset • Building and • Financial driven - maximise strategic
clear implementation and transition plan adolescent practice,
management, to recognising the maintaining physical value
to get there. infrastructure to being integrated in
importance of financial assessments when • Supported by
ensure high some asset intensive integrated processes
investing in their asset base. These Deloitte’s value-based asset management
performance (e.g. companies and Information
financial assessments (e.g. NPVs, whole- methodology delivers a tailored approach
reliability, quality of Management Systems
of-life cost analysis) can help asset that provides client’s with the ability to supply, safety) (well informed)
owners to optimise their investments mature the organisation’s strategic view • Engineering driven - • Fact Based (using
through the assessment of options. of asset management that can be scaled mature practice and asset analytics and
over a period of time. common basis in portfolio management
To progress toward the strategic view of many asset intensive techniques)
asset management, infrastructure owners companies • Business driven
need to put in place the management (ISO55000)
systems that ensure factual decision
making across all stages of the asset
lifecycle.
18New Zealand ports and freight yearbook 2020 | In Focus
Asset Management
A holistic decision making
process Holistic decision making framework
A core aspect of value based asset Identifying the key considerations in
management is the ability to take a holistic decision making
holistic view. The holistic view allows an
organisation to understand how the asset
base relates to organisational strategy
and requirements. Organisational strategy
• How do our assets help support the delivery of
However, this view point goes beyond a strategy?
solely internal organisational view of • How does our strategy impact how we operate
value. Instead it considers the needs of and maintain our assets?
the organisation’s customers and other
stakeholders of the asset to adopt a level Customer requirements
of service approach. • What do our customers require from our
assets?
Executing a holistic view and decision • How do our assets contribute to the
making process requires an asset organisation delivering the customer
management solution that enables a data requirements? TOTEX (Opex and Capex)
driven evaluation of optimised asset • What is the whole-of-life cost of our assets?
strategies based on customer, • How much capex do we need to budget for
Intervention schedules
organisational, and financial objectives. over the next 10 years?
• When will our assets require replacement?
• How much opex do we need to budget for over
• What impact do our operating and maintenance
Once adopted, the holistic view of asset the next 10 years?
strategies have on our assets’ availability?
management can enable organisations to:
• Understand their ability to meet Trade-off prioritisation and optimisation
Asset condition, criticality, degradation and decisions
customer requirements based on predictive analytics • Can we sweat an asset and if so, what impact
planned asset management strategies • What is the current condition of our assets vs will that have on our ability to meet our
expectations? customer requirements and the financial
• Optimise asset replacement through • Do we have adequate redundancy / resilience? forecasts?
data drive decision making • How are our assets degrading over time vs • Is it more financially and operationally optimal to
expectation bring forward asset replacement?
• Identify potential asset issues through
• Are we collecting data that can help us predict • Is a disproportionate amount being spent on less
predictive analytics future issues? critical assets?
19In Focus: Consulting Digital
The Business of Technology
Revolution
20New Zealand ports and freight yearbook 2020 | In Focus
The ‘9’ Big Shifts
“All businesses are
technology businesses
now”
IT is undergoing a revolution. We are
shifting from a paradigm of tech-enabled
business transformation to technology-led
business transformation.
All businesses are technology businesses
now. So if you aren’t driving change into
your business, you are falling behind your
competition and customer expectations.
Gartner predict that “by 2020, 80% of IT
organisations still aligned around
traditional technology domains will
replace their senior Technology leader.”
Deloitte research has identified 9 ‘Big
Shifts’. Shifts in these disciplines have
‘revolutionised’ the Business of
Technology – Going Digital.
Going Digital – A Strategic Connected Planning and IoT are key
initiatives to consider as an approach
Decision for increasing your digital capabilities
Going digital can protect you against future and enabling some of these Big Shifts
challenges you are not yet aware of. in your organisation.
By increasing your digital capabilities, you
create an agile organisation that is better
prepared for these challenges, offering
additional relevant information to support
the operational decision-making processes.
21New Zealand ports and freight yearbook 2020 | In Focus
Connected Planning and Going Digital
Maturity The siloed & untrusted organisation The smart insight driven enterprise
Most supply chain businesses already have asset CAPEX FINANCE
management capabilities to support operational
decision making, but how do you mature these XLS XLS XLS
CAPEX
capabilities to a more “connected planning” view
of your organisation? XLS XLS XLS
OPERATIONS Connected
HR OPERATIONS
VS.
HR XLS XLS XLS Planning
Connected Planning Tools
XLS XLS XLS
Connected planning tools (such as Anaplan) are
one way of ‘going digital’ and becoming a IT MARKETING
XLS XLS XLS XLS XLS XLS
proactive business.
IT MARKETING ERP CRM HCM FINANCIALS OTHER
Inefficient planning tools create a disconnect
between business leaders’ desire for frequent • No Trust in Data • Rigid • Real time • Mobile
and faster course-corrective action against their • Misaligned Plans • Siloed Operations • User driven • Collaborative
ability to quickly revise plans. In comparison, • Limited scale & • Resource Intensive • Connected across the • Cloud based
Collaboration • No Audit & Controls enterprise • Scalable
insight-driven organisations can benefit from • Modeling & Predictive • Processing power
• Global vs. Regional
their foresight in making business decisions. Capabilities • IoT
Moving towards a Connected Enterprise
Where can Connected Planning be Leveraged?
Supply Chain Human Resources Finance
• Connect HR, Finance, and Business plans to • Enable Finance to drive financial
• Realign supply, inventory, and demand plans to
optimise talent needs required to support the performance through accurate forecasts and
proactively respond to market changes
business reduced planning cycle times
• Optimise supply chain planning through
• Plan and optimise resources to match demand • Reduce Finance’s reliance on spreadsheet
predictive analytics to improve profitability
and need modelling and IT support for legacy systems
22New Zealand ports and freight yearbook 2020 | In Focus
IoT - Start now and connect your business
Case study – Australian Freight Operator
Fleet management through IoT enablement
Issue
The client engaged Deloitte to deliver a multi-year fleet transformation program
primarily aimed at building a new and safer driving culture.
Think big, start small, Further data analysis may reveal better Solution
ways of working and operating, providing
scale fast
even greater insights. And when IoT taps • Market Scan, Technology and Vendor Selection: comprehensive
Although real-time decision making across into other technologies, it simultaneously evaluation of organisation’s fleet connectivity (telematics) capabilities,
an enterprise once felt ‘a world away’, it is grows from and powers the Fourth driver behavior data and fleet analytics requirements
now a reality - through technology like
Industrial Revolution – or Industry 4.0. As
IoT. • Technology Design, Procurement, and Commercials: designed secure
sensors collect data, machines get
Harnessing IoT (think: machine learning, vehicle connectivity solution to enable a safer driving culture,
smarter, leveraging advances in artificial
real-time data, and location awareness) is underpinned by significant economic benefits
intelligence (AI).
the most powerful way to help companies
transform their digital journey and bring • In-Vehicle Monitoring System (IVMS): implemented in-vehicle tracking
Cloud compute and storage technologies
their biggest ambitions to life. IoT not grow exponentially in response to devices – leveraging IoT Telematics – across the client’s fleet of 1500
only helps you get ahead today, it can vehicles, distributed in over 30 locations, including remote areas
demand. IoT is one of the fundamental
provide the infrastructure and data to
help propel business far into the future. enabling technologies powering the • Analytics-Driven Safety and Fleet Optimisation: data mining and
Business of Technology Revolution. exploration of integrated data sources to generate answers for key
For businesses, the IoT is having a safety and economic questions, along with delivery of driving behavior
Even though early adopters face the risk
profound impact on manufacturing and reports, enterprise dashboards, and coaching tools to empower
of immature technologies and
supply chain operations of all kinds. leadership
unpredictable technological advances,
Products can be tracked from creation to
innovation leaders should start off their
consumption to help understand buying
IoT projects now in order to ensure
Impact
patterns.
competitive advantage. • 9-17% reduction in fleet costs through fuel economy, idling reduction, and
What used to be a series of events is now improved purchase habits
all part of a value chain and IoT is the
• Greater than 90% reduction in safety events and breaches
great connector. But the impact of IoT
doesn’t stop there.
23In Focus: Risk Advisory
Cyber Security
24New Zealand ports and freight yearbook 2020 | In Focus
Cyber Security
All hands on deck It does not appear that Maersk was
specifically targeted, but the attack came
A.P. Møller-Mærsk, also known as
through a piece of software all companies
Maersk, has been the largest container
use to file their tax returns in Ukraine.
ship and supply vessel operator in the
According to Western intelligence
world since 1996. The company is based
agencies, the attack was likely committed
in Copenhagen, Denmark, with
by a group of Russian military hackers and
subsidiaries and offices across 130
was seen as part of the ongoing struggle
countries and over 80,000 employees.
between Russia and the Ukraine. NotPetya The recovery effort required the reinstall The teams managed to locate backups of
This ‘In Focus’ piece tells the story of a
corrupted machines owned by other of 4,000 new servers, 45,000 new PCs, all servers, apart from one essential
major global cyber-attack Maersk
multinational companies and even spread and 2,500 applications. IT experts would component of the company network: its
encountered and how they were able to
back to Russia. When the attack first hit, normally estimate six months for this domain controllers. These are the servers
successfully recover from it.
Maersk was unable to determine exactly amount of work, but it was done in a that map the network and determine
On 27 June 2017, Maersk's screens what was occurring and it took several heroic effort over ten days. access for all employees. The team
started going black and presenting a hours to establish the cause of the attack, located a singular copy of the domain
ransom message to employees saying along with the wide-spread impact. In five weeks, we had successfully
controller which, due to a power outage
“Ooops, your important files are supported Maersk in rebuilding its core IT
Leaders at Maersk quickly set up a several days before the attack, had been
encrypted”. The instructions stated that capability, including 60,000+ laptop
recovery centre at its IT headquarters in unable to connect to the network and
for $300 USD worth of Bitcoin, they builds, a global upgrade to Windows 10,
Maidenhead, England. They flew in remained untouched by the malware.
would be able to decrypt an infected reconstruction of its server
regional experts, housed them in every Unfortunately, it was located in Ghana,
machine. The global cyber-attack, infrastructure, access to world class
available hotel, and engaged Deloitte to where the bandwidth was so limited that
involving a piece of malware dubbed security monitoring, and restarting the
rebuild its global network. We were able to a digital transfer would have taken days.
NotPetya, had infected Maersk’s world's most automated terminal in nine
put together a top team and be on the Furthermore, none of the Ghanaian team
network across ports and offices in over days.
ground within hours. Over the coming had the required visas to travel with the
120 countries. Since the malware had Dan McMillan, one of the first Deloitte hard drive to the UK. Although the
days and weeks this team grew to over
hit nearly all of their infrastructure, this team members on the ground, said: “The existence of the offline backup was not
130 professionals working in shifts 24/7.
ransom would be impossible to pay. most important things to do in such a intentional in this case, it demonstrates
As a united team, we restored systems
Laptops stopped working and the situation are to first understand what the importance of one particular aspect of
and got the organisation back up and
world's largest shipping distribution you’re dealing with, and second, to call resilience against cyberattack,
running rapidly. We combined our global
company – transporting 15% of all for the right kind of help. Maersk did redundancy. Building redundancy into
and local teams that comprised skills in
global trade – came to a halt. Data from both. They handled the situation network security adds an extra layer of
crisis response, cybersecurity, the dark
its terminals across the world was professionally from day one.” protection should anything go wrong. The
web, large-scale infrastructure delivery,
wiped, which meant ships could not incidental existence of an otherwise
risk advisory, consulting, forensics, and
unload and new orders could not be unnecessary copy of the domain
financial services to restore control to
taken. controllers saved millions of dollars.
central IT systems. 25New Zealand ports and freight yearbook 2020 | In Focus
Cyber Security
Dangerous duo The other bit of code that the hackers Many of the computers infected by While Deloitte worked with Maersk’s IT
deployed in their malware was designed NotPetya were running older versions of team to restore its systems, we also
NotPetya was named due to its to spread automatically, rapidly, and Windows. Microsoft says that Windows 10 focused on reverse engineering the virus.
resemblance to the ransomware called indiscriminately. NotPetya’s authors was better able to fend off NotPetya We provided security intelligence within
Petya, a piece of malware that surfaced in combined the initial spreading attacks, not just because most installs hours of being on site, giving critical
early 2016 and extorted victims to pay for mechanism with an older exploit kit auto-updated to fix the vulnerability that insights on how to stop the virus from re-
a key to unlock their files. The methods known as Mimikatz. Mimikatz was was exploited, but because improved infecting and thus damaging any recovery
used by both viruses were similar but, originally released to demonstrate that security measures blocked some of the effort. Our support helped ensure
NotPetya’s ransom messages were a hoax. Windows left users’ passwords in other ways NotPetya spread from machine Maersk’s network was protected against a
It irreversibly encrypted computers’ master memory and could be stolen. Once the to machine. This exemplifies the similar virus attack and enabled recovery
boot records, the deep-seated part of a NotPetya creators gained initial access importance of keeping systems up to date of business service operations. There was
machine that tells it where to find its own to a computer, Mimikatz could pull to help protect our digital assets. It is not also a joint UK, Dutch, and India team
operating system. NotPetya’s ultimate goal usernames and passwords out of always possible to upgrade every system providing security validation for all new
was purely destructive. A ransom payment memory and use them to hack into in an organisation, but an effort toward it server builds, processing over 1,200
to the malware’s creators would have done other machines accessible with the goes a long way. servers across the globe within 10 days
no good because a decryption key did not same credentials. Microsoft had after the attack occurred.
even exist to reorder the scrambled noise released a patch for the EternalBlue
of their computer’s contents. vulnerability, but the dangerous
Although the malware that hit Maersk was combination of EternalBlue and
similar to a previous virus, the propagation Mimikatz together made patching less
methods utilised were never seen before effective. Essentially, computers could
the June 2017 attack. The malware moved be infected that were not patched and
from machine to machine quickly through then the passwords collected from
two powerful exploits working in tandem. infected computers could be used to
One was a penetration tool known as infect computers that were patched.
EternalBlue, which was created by the US Cybersecurity professionals have said it
National Security Agency (NSA), but was the fastest-propagating malware
leaked in a disastrous breach of the they had seen to date. If the malware
agency’s ultra-secret files earlier in 2017. was found on a company network and
EternalBlue takes advantage of a the organisation had not patched
vulnerability in a particular Windows against EternalBlue yet, you could
protocol, allowing hackers the ability to assume it was already destroying their
remotely run their own code on any data centre before teams could do
unpatched vulnerable machine. anything to stop it.
26Domestic Environment
27New Zealand ports and freight yearbook 2020 | Domestic Environment
Economic environment
Reserve Bank Monetary Policy Despite softer global demand, NZ The labour market remains strong, with NZIER – Quarterly Survey of Business
Statement November 2019 commodity prices have improved with the unemployment rate at 4.2% - close to Opinion, Predictions, September 2019
strong dairy and meat prices over the the estimated level of full employment for
The RBNZ surprised markets in November by Headline business confidence fell further in
past year. The terms of trade (the ratio the NZ economy. The RBNZ estimates that
leaving the Official Cash Rate (OCR) on hold the September quarter, with a net 35% of
of export prices to import prices) is unemployment will remain around 4% out
at 1.00%. In the accompanying Monetary firms feeling pessimistic about the next six
expected to rise over the next few years to 2022 despite softer growth in the
Policy Statement (MPS), the RBNZ months. This is the lowest level of
as global inflation remains low and oil interim.
highlighted that further stimulus after the confidence seen since March 2009 during
prices are forecast to remain around
dramatic 50bps cut to the OCR in August was NZIER – Quarterly Predictions, the height of the Global Financial Crisis
US$60/barrel. On the volumes side, the
not warranted at this stage. Since then, the December 2019 (GFC).
RBNZ is forecasting export volumes to
downside risks to the outlook have abated
remain at around current levels. This is In line with most NZ economic forecasters, More concerning is that business activity
slightly with several economic indicators
partly on the back of a mild slow-down NZIER has softened its growth outlook. measures have deteriorated again, with a
pointing toward a stronger start to 2020.
in tourist numbers, but also more GDP growth in NZ is now expected to net 11% of firms reporting lower demand
The outlook for NZ’s major trading partners subdued agricultural production as global average just 2% over the next five years. over the September quarter. The
has softened and political uncertainty growth remains soft. Imports on the Global uncertainty is weighing on manufacturing sector is the most downbeat
continues to weigh on the outlook for global other hand are expected to pick-up as confidence and creating caution when it on the economic outlook with export
demand. A lower NZ dollar is helping to domestic growth starts to improve from comes to investment decisions. Tighter demand softening as global growth slows.
offset some of the negative impact from 2021 and beyond. credit conditions are also having an impact
weaker global demand on our export sector on investment plans in some sectors of the
and a weaker exchange rate is expected to economy.
continue to provide support over the next
couple of years.
General business outlook and domestic trading activity
Official Cash Rate (OCR) actual and forecast
60 over time
9
40
8
7 20
Net % of firms
6 Actual Forecast
0
OCR (%)
5
4 -20
3 -40 General business outlook
2
-60 Domestic trading activity
1
- -80
2002 2004 2006 2008 2010 2012 2014 2016 2018 2020 2022 2005 2007 2009 2011 2013 2015 2017 2019
Source: NZIER Quarterly Survey of Business Opinion - October 2019 28
Source: RBNZ Monetary Policy Statement November 2019New Zealand ports and freight yearbook 2020 | Domestic Environment
Economic environment
China remains NZ’s largest trading partner
At the start of November, the NZ Government announced a refreshed trade deal with
China remains our biggest trading partner, accounting for 23% of our export demand China. Once fully implemented this should mean 98% of NZ’s exports to China will
and 16% of our imports. Hence a large chunk of New Zealand's trade fortunes are receive preferential treatment. Over the next ten years, the agreement will remove
tied in with the Chinese economy. Our second biggest trading partner, Australia, is tariffs for an additional 12 lines of wood and paper products. Two-way trade with
similarly exposed to the fortunes of the Chinese economy (with close to 30% of China has increased in value from $28bn in 2018 up to close to $33bn over the year
Australian exports going to China). With Australia accounting for about 17% of our to September 2019. The upgraded trade agreement is also aimed at making it easier
exports, the impact for NZ of a downturn in China would be further amplified through for Chinese imports coming into NZ and also the delivery of NZ electrical products into
this channel. China. The recent outbreak of coronavirus poses a threat to trade exports to China,
but it remains too early to gauge the full impact.
China has been talking about a managed ‘cooling’ in its economy for some time now,
acknowledging that previous 7%+ growth rates were not sustainable forever. In Commodity prices
reality, GDP growth in China slowed to 6% YoY in the September 2019 quarter and is
Prices for NZ’s major commodities have remained robust over the past year. Dairy has
expected to average around that level over the next couple of years. While this is a
benefitted from strong demand and weaker global supply. In response, Fonterra raised
marked slowdown from double-digit growth seen 10-15 years ago, it remains a
its forecast milk price range for the 2019/2020 season from $6.55 - $7.55 per kgMS
comparatively healthy growth rate by global standards. Furthermore, the ongoing
to $7.00-$7.60 per kgMS in December. Lamb and beef export prices also reached new
rise of China’s middle class population continues to provide demand for soft
record highs in the September 2019 quarter, rising 6.0% and 5.4% QoQ respectively.
commodity exports – of which NZ is a major supplier. In this regard, we are luckier
The price for forestry products has declined in recent months, down almost 10% over
than our neighbours across the ditch who largely export hard commodities to China
the September quarter, following on from a small decline the previous quarter.
such as iron ore, for which demand is more dependent on investment spending.
New Zealand's Top 10 Export Destinations New Zealand's Top 10 Import Origins
2.1% 1.9%
1.9% European Union
China, People's Republic of
2.7% 3.5% 3.0%
3.7% China, People's Republic of
Australia
5.4% Other 17.8% Australia
22.8% 4.8%
United States of America Other
5.1%
10.7% United States of America
European Union
Japan 11.1% 16.0% Japan
Korea, Republic of Singapore
11.0% 16.6%
Hong Kong (Special 13.6% United Arab Emirates
Administrative Region) 15.7%
India Thailand
15.3%
Singapore Korea, Republic of
Source: Statistics New Zealand Source: Statistics New Zealand 29New Zealand Freight Task
30New Zealand ports and freight yearbook 2020 | New Zealand Freight Task
New Zealand freight task
New Zealand freight task The primary sector is New Zealand’s key
NFDS 2017 freight forecast vs 2017/18 actuals
generator of domestic freight, much of it
The information in this section is drawn
destined for export.
from the National Freight Demand Study 120
(NFDS). The first National Freight In general, with the exception of logs, the 100
Million tonnes
Demand Study (2008) guided freight volume of agricultural products have not 80
infrastructure and investment and land- increased substantially since 2012. This 60
use planning decisions across the public reflects slowing growth in the production 40
and private sectors. of dairy and meat products in particular. 20
The NFDS was partially updated in 2014 Growth in agricultural product volumes is -
with data to 2012, and in 2019 with data forecast to be limited to 2042, with
to 2017/18. volumes expected to remain stable over
this period. Favourable export conditions
Total freight volumes were 278 million
and a buoyant construction sector have
tonnes in 2017/18, compared to forecast
supported strength in forestry, while 2017 forecast (NFDS 2014) 2017/18 actual
freight volumes of 260 million tonnes for
growth in horticulture in terms of value
2017, in the 2014 study. This indicates Source: NFDS 2014 & 2017/2018
and volume is also anticipated.
growth in freight volumes was higher than
anticipated over the period between the Petroleum and coal freight are NFDS 2012 vs 2017/18 actuals
two studies (top right). concentrated in a few key regions where 100
the resources are located and extracted,
Since 2012 the overall freight task has 80
coal from the West Coast and Waikato,
Million tonnes
grown by 10.5% (bottom right). Growth
petroleum from Taranaki and Northland 60
occurred primarily in forestry, building
where it is imported and refined. Results
and other construction materials and 40
for coal and petroleum are mixed, with a
retail / general freight.
drop in export coal volumes offsetting 20
Road remains the dominant mode for growth in petroleum since 2012. -
freight movements in terms of both
Building and other materials (i.e.
tonnes and tonne-kms. Rail has declined
aggregate and cement), are also
as a proportion of freight moved, due to
produced in high volumes, although
the Kaikoura earthquakes and a reduction
generally close to domestic markets given
in coal movements.
their bulk and relatively low unit value. 2012 actual 2017/2018 actual
Manufactured and retail goods, whether
Source: NFDS 2014 & 2017/2018
domestically made or imported, are
usually smaller, of greater unit value and
are transported greater distances. 31New Zealand ports and freight yearbook 2020 | New Zealand Freight Task
Regional freight generation
Regional freight This is similar for forestry, where warm New Zealand regions
generation climate and lower-value land have
attracted substantial plantings in:
Clear patterns are evident in domestic
Northland; Waikato; Bay of Plenty;
freight flows. Primary producing areas Northland
Gisborne; Hawkes Bay; and Tasman /
generate flows to export ports, typically
Nelson / Marlborough.
via processing facilities. Population is a
major driver of both consumption and Crude oil flows are either a direct export
Auckland Bay of Plenty
manufacturing activity. (from Taranaki) or direct import (to
Marsden Point in Northland). Domestic
The “Golden Triangle” (Auckland,
transport of petroleum products is Waikato
Waikato, Bay of Plenty) combines both
primarily from the Northland refinery via Gisborne
population and primary industry
pipeline and coastal distribution, with a
production (forestry and dairy) to
rising direct import share, and then by
account for 45% of all freight tonnage
truck to the nation’s service stations. Taranaki Hawke’s Bay
produced.
Cement is manufactured at a plant in
Canterbury is the dominant freight Manawatu
Northland for distribution by coastal ships
generator in the South Island producing
and then road and rail. Cement was also
15% of the national freight task.
manufactured in the West Coast of the
Manufacturing and retail freight tonnage South Island but this has been Wellington
correlate strongly with population, superseded by direct import.
notably in Auckland and Canterbury, Tasman Nelson Marlborough
Southland hosts the Tiwai Point West Coast
which host manufacturing hubs, large
Aluminium Smelter which generates
scale distribution centers, and receive
import and export flows. Canterbury
consumer goods through their ports.
The primary sector is located in regions
offering favourable topography, climate,
and soil.
Waikato, Taranaki, Manawatu, and
Southland are well-suited to dairy Otago
Southland
production, as is Canterbury if suitable
irrigation is available.
32You can also read