Currency OUTLOOK - FONDS professionell

Page created by Edna Griffith
 
CONTINUE READING
Currency OUTLOOK - FONDS professionell
Currency

  OUTLOOK                                                                            Macro
                                                                          Currency Strategy
                                                                              January 2012

  2012 – the euro is here to stay
  Euro – here to stay
  We have brought together four reports on the euro to give insights into
  the forces currently acting on the euro and some indications of where it
  may go next. In short we believe the euro is here to stay.

  RMB – less appreciation
  Lower inflation and a move close to equilibrium mean that RMB will
  see less appreciation and more volatility in 2012. Internationalisation
  will be the key focus of RMB policy. RMB is still more attractive than
  many peers and remains a core favourite.

  Best and worst of 2012
  We give our views on our most and least favourite currencies in 2012.

  Long-term forecasts
  We publish our long-term forecasts up to 2018.

Disclosures and Disclaimer This report must be read with the disclosures and analyst
 certifications in the Disclosure appendix, and with the Disclaimer, which forms part of it
Currency OUTLOOK - FONDS professionell
Macro
   Currency Strategy                                                                                         abc
   January 2012

Summary

Euro – here to stay                                                                              (pg 3)
We have brought together four reports on the euro to give insights into the forces currently acting on the
euro and some indications of where it may go next. In short we believe the euro is here to stay.

    1. Lessons from the past                                                                       (pg 4)
         The process of monetary integration in Europe has a long and chequered history. Here we give a
         brief outline of the developments from the Werner Report of 1970 to the current sovereign debt
         crisis and try to draw out some lessons from this history for the current situation.

    2. EUR resilience                                                                             (pg 10)
         Recent developments strongly suggest that the crisis is deeper and politically more intractable
         than was apparent in 2010 and yet the EUR has proved remarkably resilient. We look at two
         principal reasons why the EUR is holding up and why, in our view, it is more likely to rise than
         to fall in coming months.

    3. Valuing EUR-USD                                                                            (pg 17)
         The Eurozone debt crisis has raised questions about the FX value of the euro. Here we construct
         a valuation model for EUR-USD in terms of the prospective repayment of sovereign debt. We
         have constructed a spreadsheet which allows users to enter their own expected values and
         probabilities to get an implied valuation for the euro.

    4. Where core-EUR might have been                                                             (pg 22)
         How would a split euro have performed since 2010? Assuming a core euro would have remained
         relatively stable against the CHF, then monetary conditions in the core Eurozone would also
         have been significantly tighter, and the central bank would perhaps not have decided to tighten
         policy in 2011. There seems little doubt that a euro-periphery currency would by now be
         significantly weaker than the EUR.

RMB – Less appreciation, more volatility in 2012                                               (pg 26)
Less inflation and a move close to equilibrium means that RMB will see less appreciation and more
volatility in 2012. Internationalization will be the key focus of RMB policy. RMB is still more attractive
than many peers and remains a core long.

Best and worst of 2012                                                                         (pg 32)
We give our views on our most and least favourite currencies in 2012.

                                                                                                               1
Macro
     Currency Strategy                                                                                                         abc
     January 2012

Precious metals in 2012                                                                                         (pg 35)
Our predictions for the precious metals market in 2012. We also present our updated forecasts for gold,
silver and the PGMs.

Long-term forecasts                                                                                             (pg 37)
Given the problems of forecasting out even one year, many are understandably reluctant to venture a view
for further out. However, we are aware that a number of our customers have a need for some indication of
the likely FX market direction over a longer-term horizon for planning purposes. So again, with some
trepidation, we publish these longer-term forecasts.

Dollar Bloc                                                                                                     (pg 40)
AUD – Global contagion – We believe the backdrop for the currency has weakened, and with risk on-
risk off dynamics being the main driver of price action, we retain our bearish bias on the AUD.

NZD – Can’t escape RORO – The outlook for New Zealand economy looks relatively good, but as long as
the RORO paradigm remains the dominant force in the market, global stresses will push the NZD lower.

Key events
Date                                            Event
12 January                                      BoE rate announcement
12 January                                      ECB rate announcement
17 January                                      BoC rate announcement
21 January                                      21st OECD Global Forum on Public Debt Management
24 January                                      BoJ rate announcement
25 January                                      FOMC rate announcement
25 January                                      World Economic Forum Meeting (to 29 Jan)
26 January                                      RBNZ rate announcement
7 February                                      RBA rate announcement
9 February                                      BoE and ECB rate announcements
Source: HSBC

Central Bank policy rate forecasts (end quarter)
                                                                         Last                      Q1 2012(f)     Q4 2012(f)

USD                                                                    0-0.25                          0-0.25         0-0.25
EUR                                                                      1.00                            0.50           0.50
JPY                                                                    0-0.10                          0-0.10         0-0.10
GBP                                                                      0.50                            0.50           0.50
Source: HSBC forecasts for Fed funds, Refi rate, Overnight Call rate and Base rate

Consensus forecasts for key currencies vs USD
                                                                                     3 months                     12 months
EUR                                                                                     1.310                         1.325
JPY                                                                                     76.68                         78.01
GBP                                                                                     1.532                         1.576
CAD                                                                                     1.031                         1.010
AUD                                                                                     0.970                         0.995
NZD                                                                                     0.758                         0.789
Source: Consensus Economics Foreign Exchange Forecasts December 2011

2
Macro
   Currency Strategy                                                                                        abc
   January 2012

Euro: here to stay
 Chapter 1: Lessons from the past
 Chapter 2: Euro resilience
 Chapter 3: Valuing EUR-USD
 Chapter 4: Where core-EUR might have been

Euro: Where next?                                    Our conclusions
The euro has been at the centre of financial
                                                     Chapter 1: Lessons from the past
market developments since the sovereign debt
crisis intensified anew in July 2011. Gyrating       The political will to make the euro a long-term
expectations about the prospects for crisis          success is very strong and the response to crisis is
resolution have placed the euro as central to the    to forge closer integration within the Eurozone,
“risk on-risk off” dichotomy that continues to       not less
drive financial market prices. When prospects for
a long-term solution improve the markets move        Chapter 2: Euro resilience
into “risk on” mode with rising equities,            The euro is likely to continue showing resilience
commodities, peripheral bonds and ‘growth’           as its external position is strong, and the
currencies (such as EUR, SEK and AUD). When          speculative market is already very short
prospects for a solution fade, the markets move to
“risk off” mode with falling equities, falling       Chapter 3: Valuing EUR-USD
commodities, and rises in ‘safe havens’ such as
                                                     Unless one is prepared to assign a high probability
US treasuries and defensive currencies (such as
                                                     to euro break-up and default, it is difficult to see
USD, JPY and NOK).
                                                     EUR-USD weakening much in coming months
The early months of 2012 again look likely to be
dominated by developments in the Eurozone, so        Chapter 4: Where core EUR might have
here we have brought together four reports on the    been
euro to give insights into the forces currently      The behaviour of CHF in 2011 is indicative of the
acting on the euro and some indications of where     violent currency appreciation that ‘core’
the euro may go next.                                Eurozone countries might experience should the
                                                     euro break up. This is likely to make Eurozone
                                                     leaders even more determined to work towards a
                                                     long-term solution

                                                                                                              3
Macro
      Currency Strategy                                                                                                                 abc
      January 2012

1. Lessons from the past

The long and winding road                                                     became even more important once the Bretton
                                                                              Woods system collapsed in the early 1970s
The process of monetary integration in Europe has
a long and chequered history. Here we give a brief                            The idea of monetary integration in the EEC was
outline of the developments from the Werner                                   seen as a natural consequence of the development
Report of 1970 to the current sovereign debt crisis                           of the common market, and an economic and
and try to draw out some lessons from this for the                            monetary union (EMU) became a formal policy
current situation.                                                            goal in 1969. The Werner Report of 1970
                                                                              envisaged a three-stage process over 10 years that
When the European Economic Community (EEC)
                                                                              would end with the locking of exchange rates, or
was established by the Treaty of Rome in 1957,
                                                                              perhaps a single currency.
there was little focus on exchange rates and
monetary integration, because the currencies of                               Oil price shock intrudes
the six founding members (Germany, France,                                    The Werner plan was never implemented, partly
Italy, Belgium, the Netherlands and Luxembourg)                               because of US objections, but mostly because of
were locked in the Bretton Woods system which                                 the impact of the oil price shock of 1973. The
pegged currencies to gold via the dollar. This                                Yom Kippur war of October 1973 saw an Arab oil
changed as the Bretton Woods system came under                                embargo against those in the West seen as
increasing strain in the late 1960s with a                                    supporting Israel and resulted in a fourfold
revaluation of the Deutschmark and a devaluation                              increase in oil prices (chart 1).
of the French franc. Exchange rate volatility

    1. Oil price jumps of 1973 and 1979

    USD/bbl                                                   Crude oil price 1970-1985                                       USD/bbl
    45                                                                                                                             45
    40                                                                                                                             40
    35                                                                                                                             35
    30                                          1973:                                                                              30
    25                                    Arab oil embargo                                                                         25
    20                                                                                                                             20
    15                                                                                              1979:                          15
    10                                                                                        Iranian rev olution                  10
     5                                                                                                                             5
     0                                                                                                                             0
     Jan-70               Jan-72               Jan-74        Jan-76         Jan-78        Jan-80            Jan-82   Jan-84

    Source: HSBC, Thomson Reuters Datastream

4
Macro
   Currency Strategy                                                                                                                                 abc
   January 2012

 2. Different policy responses to the oil shocks meant very different inflationary experiences

                                                                 European inflation 1965-1990
 25%                                                                                                                                          25%
                            Belgium                France                Germany                Italy                 Lux            Neths
 20%                                                                                                                                          20%

 15%                                                                                                                                          15%

 10%                                                                                                                                          10%

  5%                                                                                                                                          5%

  0%                                                                                                                                          0%

 -5%                                                                                                                                          -5%
          1965

                     1967

                                 1969

                                            1971

                                                        1973

                                                               1975

                                                                          1977

                                                                                   1979

                                                                                            1981

                                                                                                         1983

                                                                                                                  1985

                                                                                                                             1987

                                                                                                                                     1989
 Source: HSBC, Thomson Reuters Datastream

With European economies heavily energy                                           movements between European currencies (the
dependent, the oil price rise had a dramatic                                     ‘snake’ and the ‘snake in the tunnel’).
impact. Inflation rose and economic output fell.
                                                                                 On no, not again...
The inflationary response varied substantially
across Europe with German inflation reaching                                     In the late 1970s European leaders tried again to
7% and Italian inflation reaching nearly 20%                                     create ‘a zone of monetary stability’ in Europe
(chart 2).                                                                       with the establishment of the European Monetary
                                                                                 System (EMS). Central to this was the Exchange
The wide divergence in inflation rates generated                                 Rate Mechanism (ERM), which set tight limits for
substantial exchange rate volatility (chart 3).                                  exchange rates (±2.25% except Italy, which was
Between mid 1971 and the end of 1976 the Italian                                 ±6%) around a central parity. Intervention and
lira lost more than half its value against the DEM                               bilateral loans were to be used to keep currencies
and the French franc fell by 30%. These moves                                    within their bands. The ERM was established in
came despite EEC attempts to limit exchange rate                                 March 1979 and was immediately hit by the

 3. The breakdown of Bretton Woods and the impact of the first oil shock saw large FX moves in Europe

                                                   European ex change rates v ersus DEM, Jan 1970=100
 Index                                                                                                                                       Index
                                                   FRF                ITL                 BEF                   NLG
 110                                                                                                                                           110
 100                                                                                                                                           100
  90                                                                                                                                           90
  80                                                                                                                                           80
  70                                                                                                                                           70
  60                                                                                                                                           60
  50                                                                                                                                           50
  40                                                                                                                                           40
    Jan-70                  Jan-71             Jan-72           Jan-73             Jan-74               Jan-75              Jan-76

 Source: Bundesbank, HSBC

                                                                                                                                                       5
Macro
        Currency Strategy                                                                                                     abc
        January 2012

    4. The Bundesbank tightened policy aggressively in response to the second oil shock

    %                                                 Bundesbank discount rate 1979-1982                                 %
    8                                                                                                                     8

    7                                                                                                                     7

    6                                                                                                                     6

    5                                                                                                                     5

    4                                                                                                                     4

    3                                                                                                                     3

    2                                                                                                                     2
        Jan-79           Jul-79     Jan-80          Jul-80        Jan-81         Jul-81        Jan-82     Jul-82

    Source: Bundesbank

second oil shock resulting from the Iranian                             movements against the DEM are shown in chart 5.
revolution and the Iran/Iraq war. This resulted in a                    Compared with the early 1970s, exchange rates
further doubling of oil prices (see chart 1 again).                     were less volatile, but the regular step changes in
                                                                        parities still meant that countries such as France
Intent on limiting the inflationary consequences of
                                                                        and Italy had to operate with a significant risk
the oil price rise, the Bundesbank tightened policy
                                                                        premium in terms of higher interest rates
aggressively (chart 4). European inflation again
                                                                        compared to those in Germany.
diverged significantly (chart 2 again), and the
ERM came under intense pressure.                                        From 1987 to 1991, the commitment to nominal
                                                                        exchange rate stability increased the belief that a
The response to this was to keep the ERM
                                                                        strong currency policy would permanently
framework, but agree regular ‘realignments’ at
                                                                        eliminate inflationary pressures (epitomised by
week-end meetings when new central parities
                                                                        France’s ‘franc fort’ policy). This process was
were set. There were 12 realignments between
                                                                        helped by the 1985 oil price fall following an
1979 and 1987. The resulting exchange rate

    5. The early years of the ERM saw regular ‘realignments’

                                               ERM ex change rates v ersus DEM, Jan 1979=100
    Index                                                                                                             Index
                                                  FRF             ITL           BEF            NLG
    110                                                                                                                 110
    100                                                                                                                 100
     90                                                                                                                 90
     80                                                                                                                 80
     70                                                                                                                 70
     60                                                                                                                 60
     50                                                                                                                 50
     40                                                                                                                 40
        Jan-79           Jan-80     Jan-81         Jan-82        Jan-83        Jan-84      Jan-85       Jan-86

    Source: Bundesbank, HSBC

6
Macro
     Currency Strategy                                                                                                    abc
     January 2012

 6. The Bundesbank tightened again in response to the ‘reunification boom’

 %                                                   Bundesbank discount rate 1989-1993                            %
 9                                                                                                                  9

 8                                                                                                                  8

 7                                                                                                                  7

 6                                                                                                                  6

 5                                                                                                                  5

 4                                                                                                                  4

 3                                                                                                                  3
  Jan-89          Jul-89   Jan-90      Jul-90      Jan-91      Jul-91        Jan-92   Jul-92   Jan-93   Jul-93

 Source: Bundesbank

increase in Saudi production which reduced                          problems and the collapse of the Soviet Union)
inflation across Europe. Risk premia declined and                   forced them to devalue in 1991 in the first signal
interest rate differentials narrowed. During this                   that nominal exchange rate stability in Europe was
period there was also a large increase in capital                   by no means certain to continue. This new sign of
flows within Europe, with sharply increased                         instability came despite the fact that the
borrowing in DEM to fund assets in higher                           Maastricht Treaty, which set out a roadmap for
yielding currencies.                                                monetary union in Europe, was signed in
                                                                    January 1992.
New Germany, new strains
German reunification introduced new strains into                    Contagion, Crisis and Response
the system. The fall of the Berlin wall in 1989 led                 Strains continued to build in 1992 until September
rapidly to reunification (October 1990) and had a                   when both Sterling (a member only since 1990)
big impact on the German economy in terms of                        and Italy were forced to leave, and other
large infrastructure spending in the East and                       currencies were devalued. Strains did not subside,
new consumption spending by East Germans who                        especially as it was far from clear that the
had most of their Ostmarks converted to DEM at                      Maastricht Treaty would be ratified in referenda
1:1 when the black market rate was between 5 and                    in Denmark and France, and in August 1993 the
10 to 1.                                                            ERM bands were widened from ±2.25% to ±15%
                                                                    (chart 7).
The Bundesbank tightened policy again in
response to the ‘reunification boom’ and the rising                 The political response to this crisis was to push
fiscal deficit. Rates were pushed up from 4% in                     ahead with renewed determination towards EMU.
1989 to a peak of 8.75% in 1992. Other European                     Exchange rate instability was seen as so disruptive
central banks followed suit and this put new                        to economic performance that all efforts should be
strains both on the ERM and on those currencies                     made to eliminate it. By the late 1990s the
that had been shadowing the system. The Finns                       economic recovery and the policy drive towards
had been following a strong currency policy in the                  EMU had helped stabilise exchange rates again
late 1980s and in 1991 they pegged the markka to                    and in 1999 the euro was launched with the
the ECU. However, economic weakness (banking

                                                                                                                            7
Macro
      Currency Strategy                                                                                                          abc
      January 2012

    7. Successive crises hit the ERM in 1992 and 1993

                                             European ex change rates v ersus DEM, Jan 1991=100
    Index                                                                                                             Index
                                              FRF               ITL              FIM              ESP
    110                                                                                                                    110
    100                                                                                                                    100
     90                                                                                                                    90
     80                                                                                                                    80
     70                                                                                                                    70
     60                                                                                                                    60
     50                                                                                                                    50
     40                                                                                                                    40
      Jan-91             Jan-92     Jan-93          Jan-94        Jan-95        Jan-96        Jan-97    Jan-98

    Source: Bundesbank, HSBC

locking of exchange rates and then the                                  2. Contagion is a genuine risk
replacement of national currencies with the euro.                       Some have suggested that it might be possible for
                                                                        one country to leave the euro without there being
Lessons from the past
                                                                        major problems for the remaining members.
The brief history of European monetary                                  However, as we saw with the Finnish devaluation
developments since 1970 outlined has three                              in 1991, a seemingly small change can be a signal
important lessons that are relevant for the                             that leads to a radical change in expectations
current situation:                                                      about what is possible, and to changes in
1. Monetary stability in Europe has been a                              behaviour that make much bigger changes
driving objective for 40 years, and will not be                         inevitable. The same effect was also seen during
abandoned                                                               the Asian crisis, when the problems in Thailand
The development of a single market in Europe has                        rapidly spread across the region.
been the driving force behind European political                        If one country were to leave the euro then the risk
co-operation since the formation of the EEC, and                        would be that the pressures on others would build
monetary stability within Europe is seen as                             to such an extent that further exits become much
essential to the operation of this market. Through                      more likely. For this reason, we would not expect
a variety of crises generated by a number of                            to see any euro members leaving.
internal and external shocks European leaders
have maintained their commitment to this. The                           3. Competitiveness problems have not been
response to crises has been to draw together and                        solved by EMU
try to promote stability. Having established EMU,                       During the period of floating exchange rates, and
we should expect everything to be done to                               during the period of fixed but adjustable pegs, the
maintain it, despite the depths of the problems that                    nominal exchange rate acted much as a fault line
Europe faces. It seems extremely unlikely that                          between tectonic plates. When relative
there will be a disintegration of the euro, even if                     competitiveness imbalances built they could be
the sovereign debt crisis gets worse.                                   relieved (at least temporarily) by exchange rate
                                                                        changes. Since 1999 such adjustments have not
                                                                        been possible, yet changes in relative

8
Macro
   Currency Strategy                                                                                                                abc
   January 2012

 8. Divergences in competitiveness have not been eliminated in the Eurozone

                                                 Unit Labour Cost Indices, Q1 1998=100
 Index                                                                                                                   Index
                                       Germany                France                 Italy             Spain
 140                                                                                                                          140

 130                                                                                                                          130

 120                                                                                                                          120

 110                                                                                                                          110

 100                                                                                                                          100

  90                                                                                                                          90
       1998     1999   2000     2001     2002      2003     2004    2005      2006       2007   2008     2009   2010   2011

 Source: OECD, HSBC

competitiveness have not been entirely eliminated.                     Conclusion
Chart 8 shows OECD unit labour cost indices for                        The objective of European economic integration
the major euro area economies based on 1998                            was born out of a response to the horrors of the
(when nominal exchange rates were fixed).                              two world wars. What started as co-operation in
As can be seen from the chart, there has been a                        the coal and steel industries became a common
significant relative rise in unit labour costs in                      market and then a tighter political union.
Italy, Spain and France compared with Germany                          Monetary integration has long been seen as
over the period. These divergences could be                            essential to making overall European integration
overlooked in an environment of easy access to                         work, and the response to a variety of crises over
credit, but will be much more important in a                           the past thirty years has been to move towards
period of fiscal retrenchment and will need to be                      ever closer integration. The response to the latest
addressed if the long-term stability of the euro is                    crisis should be seen in this context – a move
to be assured.                                                         towards closer fiscal integration (at least for most
                                                                       EU members).

                                                                                                                                      9
Macro
      Currency Strategy                                                                                                              abc
      January 2012

2. EUR resilience

Introduction                                                            2     Crisis resolution is in the interests of all
                                                                              concerned. The potential economic
When the Eurozone sovereign credit crisis first
                                                                              consequences of allowing the crisis to go
emerged in 2010, the EUR fell by about 10%
                                                                              unresolved are so dire for all the Eurozone
trade weighted and by 14% against the dollar
                                                                              economies (and beyond) that some sort of
from (1.37 to 1.19). Recent developments strongly
                                                                              ‘solution’ seems very likely. While there have
suggest that the crisis is deeper and politically
                                                                              been moves towards closer fiscal coordination,
more intractable than was apparent in 2010 and
                                                                              this may need to be supplemented by increased
yet the euro has proved remarkably resilient.
                                                                              ECB bond buying in the short term and some
There are two principal reasons why the EUR is                                form of common bond issuance longer term.
holding up and why, in our view, it is more likely
                                                                        In the worst case scenario of one or more
to rise than to fall in coming months:
                                                                        members being forced, or choosing, to leave, the
1         The EUR has a strong ‘external’ position.                     revised euro would have a stronger internal and
          Viewed as a whole, the Eurozone has a current                 external position. Any euro exit would no doubt
          account that is close to balance, and positive                be accompanied by intense uncertainty which
          portfolio and M&A inflows. In addition,                       would see investors retreat to the dollar initially,
          speculative positions (as measured by CFTC                    but once the situation became clearer the revised
          data) are record short. Should the ‘internal’                 euro would likely strengthen. While we would
          problems begin to be resolved, the EUR would                  assign a low probability to a euro exit, the risk has
          likely come under upward pressure.                            to be factored into current market prices.

    1. EUR weakness in 2010 has not been repeated this time…
                                                         EUR effectiv e ex change rate
    108                                                                                                                        108
    106                                                                                                                        106
    104                                                                                                                        104
    102                                                                                                                        102
    100                                                                                                                        100
     98                                                                                                                        98
     96                                                                                                                        96
     94                                                                                                                        94
     92                                                                                                                        92
     90                                                                                                                        90
      May -06      Nov -06 May -07   Nov -07   May -08    Nov -08 May -09      Nov -09   May -10   Nov -10 May -11   Nov -11
    Source: IMF, HSBC

10
Macro
   Currency Strategy                                                                                                                          abc
   January 2012

 2. …despite a deepening crisis

 %                                                    European Gov ernment 10y r Bond Yields                                             %
 16                          Spain (LHS)               Portugal (LHS)                Italy (LHS)             Greece (RHS)                35
 14                                                                                                                                      30
 12
                                                                                                                                         25
 10
                                                                                                                                         20
  8
                                                                                                                                         15
  6
                                                                                                                                         10
  4
  2                                                                                                                                      5

  0                                                                                                                                      0
  Jan-09          May -09        Sep-09      Jan-10       May -10           Sep-10      Jan-11     May -11      Sep-11          Jan-12

 Source: Bloomberg, HSBC

The bond, equity and credit markets have been                                Resilient euro
heavily influenced by developments in the                                    When the European sovereign bond crisis started
Eurozone, but the FX market has remained                                     in 2010 with Greece admitting that its public
comparatively stable. Many have been looking for                             sector deficit was much larger than previously
the euro to fall heavily in response to the crisis.                          reported, the euro fell hard. Between the middle
However, we think that the euro will more likely                             of March and the end of June 2010, the euro fell
move higher again as there are moves to address                              by 10% on a trade-weighted basis, and by 14%
the fiscal issues in Europe and as the market                                against the dollar (chart 1). Recent developments
focuses again on the problems of public finances                             strongly suggest that the public finance problem
in the US.                                                                   in some Eurozone countries is much more serious
                                                                             and intractable than had originally been thought.

 3. EUR has been trading in a surprisingly ‘normal’ way

                     Change in Euro trade w eighted v ersus w eighted change in 2y r sw ap spread Jan 2011-Dec 2011
                                                               2.0%         EUR Index

                                                               1.5%

                                                               1.0%

                                                               0.5%
 Spread (bp)
                                                               0.0%
 -15                       -10                 -5                       0                     5                  10                      15
                                                              -0.5%

                                                              -1.0%                                              y = 0.0007x - 7E-05
                                                                                                                 R 2 = 0.3281
                                                              -1.5%

 Source: Bloomberg, HSBC

                                                                                                                                                11
Macro
     Currency Strategy                                                                                                         abc
     January 2012

 4. The euro is still trading above ‘fair value’

                                                      OECD EUR PPP                EUR-USD
 1.70                                                                                                                  1.70
 1.60                                                                                                                  1.60
 1.50                                                                                                                  1.50
 1.40                                                                                                                  1.40
 1.30                                                                                                                  1.30
 1.20                                                                                                                  1.20
 1.10                                                                                                                  1.10
 1.00                                                                                                                  1.00
 0.90                                                                                                                  0.90
 0.80                                                                                                                  0.80
 0.70                                                                                                                  0.70
      Dec-00      Dec-01    Dec-02     Dec-03      Dec-04   Dec-05   Dec-06   Dec-07   Dec-08   Dec-09   Dec-10   Dec-11

 Source: Bloomberg, HSBC

While austerity measures will help reduce new                         At the same time, it has been trading in a ‘normal’
borrowing requirements, they will do nothing to                       way. Chart 3 shows the relationship between daily
help service the existing very large outstanding                      changes in the euro and daily changes in the 2
stocks of debt. These are manageable as long as                       year swap spread (both trade-weighted) since the
yields remain low, but debt dynamics rapidly                          beginning of the year. The relationship is strong
become unsustainable as yields rise. The more                         and shows a relative move higher in euro rates is
debt looks unsustainable, the less investors want                     associated with a move up in the euro.
to hold the bonds, and the higher the yields move.
                                                                      The strength of this relationship may reflect the
In addition, fiscal austerity measures are more
                                                                      dominance of the ‘risk on-risk off’ phenomenon.
likely to mean that the economy is unable to grow
                                                                      When the markets are ‘risk on’ they expect the
rapidly enough to service the debt. Fears of debt
                                                                      ECB to continue to normalise rates and both swap
unsustainability have driven bond yields to
                                                                      rates and the euro move higher. When the markets
unprecedented levels (chart 2).
                                                                      are ‘risk off’ they fear a continued reversal of
The deepening fiscal crisis has been met with                         course by the ECB and both swap rates and the
what are widely regarded as, thus far,                                euro move lower.
unconvincing policy responses from Eurozone
                                                                      Finally, the euro is still trading in ‘overvalued’
officials (see, for example, How to solve the
                                                                      territory, despite the crisis. Chart 4 shows EUR-
euro’s problems, 30 September 2011 and The
                                                                      USD compared with the OECD PPP level. The
euro: from ‘too big to fail’ to ‘too big to save’,
                                                                      fact that the euro still manages to trade above ‘fair
9 November 2011). Nevertheless, the euro as a
                                                                      value’ is either saying something very negative
currency has performed relatively well. On a
                                                                      about the dollar (which is possible) or that the FX
trade-weighted basis the euro is down only about
                                                                      position of the euro is not as dire as it is popularly
5% since mid-July, though it is down nearly 10%
                                                                      assumed to be.
against the dollar.

12
Macro
   Currency Strategy                                                                                                                    abc
   January 2012

 5. Eurozone current account is close to balance

   Eur bn                                                  Eurozone Current Account balance (EUR bn)                     EUR bn
  10                                                                                                                              10

   5                                                                                                                              5

   0                                                                                                                              0

  -5                                                                                                                              -5

 -10                                                                                                                              -10

 -15                                                                                                                              -15

 -20                                                                                                                              -20
    Jan-05 Jul-05 Jan-06 Jul-06 Jan-07 Jul-07 Jan-08 Jul-08 Jan-09 Jul-09 Jan-10 Jul-10 Jan-11 Jul-11

 Source: Bloomberg, HSBC

Given the depth and severity of the fiscal crisis in                            that matters, not its component parts. On this
the Eurozone, the resilience of the euro and the                                basis, the euro is in a strong position. As can be
normality of its trading behaviour are notable.                                 seen from chart 5, the current account position of
How can this be explained and will it continue?                                 the euro is close to flat.
There are two main reasons for the euro’s
                                                                                Chart 6 shows the extent of the internal imbalances
performance and they suggest the euro is more
                                                                                in the Eurozone, by showing the current account
likely to rise than to fall in coming months.
                                                                                balances of the major Eurozone countries. While
1. The euro has a strong external                                               Germany has a current account surplus of over 5%
position                                                                        of GDP, France, Italy and Spain have deficits of
From an external point of view, the euro is                                     between 2% and 4% of GDP. The challenge for
indivisible. It is impossible to buy or sell a ‘Greek                           the Eurozone policymakers is to manage these
euro’ or a ‘German euro’. For the FX market,                                    internal imbalances through transfers or changes in
then, it is the position of the Eurozone as a whole                             relative competitiveness.

 6. The imbalances are internal rather than external

                                           Major Eurozone countries current account balances (% GDP)
   8%                      Germany                 Spain                                                                      8%
   6%                                                                                                                         6%
                           France                  Italy
   4%                                                                                                                         4%
   2%                                                                                                                         2%
   0%                                                                                                                         0%
  -2%                                                                                                                         -2%
  -4%                                                                                                                         -4%
  -6%                                                                                                                         -6%
  -8%                                                                                                                         -8%
 -10%                                                                                                                         -10%
 -12%                                                                                                                         -12%
            1999       2000         2001    2002       2003      2004    2005     2006    2007    2008   2009   2010   2011

 Source: IMF, HSBC

                                                                                                                                          13
Macro
      Currency Strategy                                                                                                                        abc
      January 2012

 7. Portfolio inflows have picked up in recent months

                                              Euroz one BoP Portfolio Inv estm ent Balance (EU R bn, 12m m a)
 35.0                                                                                                                                   35.0
 30.0                                                                                                                                   30.0
 25.0                                                                                                                                   25.0
 20.0                                                                                                                                   20.0
 15.0                                                                                                                                   15.0
 10.0                                                                                                                                   10.0
     5.0                                                                                                                                5.0
     0.0                                                                                                                                0.0
 -5.0                                                                                                                                   -5.0
          J an-05   J ul-05 J an-06   J ul-06 Jan-07     Jul-07 J an-08 Jul-08 J an-09   J ul-09 J an-10   J ul-10 Jan-11    Jul-11

 Source: Bloomberg, HSBC

While the current account balance is close to flat,                          Timely data on direct investment flows are not
net portfolio flows into the Eurozone are positive                           available, but a proxy can be constructed using net
and have been trending higher in recent months                               announced cross-border M&A deals. These show
(chart 7).                                                                   a direct investment outflow in 2008, but this has
                                                                             become flat to slightly positive in recent months
Positive portfolio flows
                                                                             (chart 8).
Some have argued that the strength of the euro
merely reflects banks repatriating capital to shore                          If current account flows are flat and longer-term
up their balance sheets, and that it will fall once                          capital flows (portfolio and direct investment) are
this is complete. While it is difficult to                                   positive, then short-term money flows must be
disentangle the portfolio flows, there is no clear                           negative. If the euro were being supported
                                                                             primarily by bank repatriation, then this should be
sign that inflows only reflect bank capital
                                                                             seen in money inflows, but this is not the case.
repatriation. Even if the repatriation argument was
holding the euro up, it is difficult to argue that it
will end soon.

 8. Net cross border M&A flows are mildly positive
 EU R bn                                          Eurozone Net Announced C ros s-Border M &A 3m M A                                   EUR bn
     10                                                                                                                                  10
      5                                                                                                                                  5
      0                                                                                                                                  0
     -5                                                                                                                                  -5
 -10                                                                                                                                     -10
 -15                                                                                                                                     -15
 -20                                                                                                                                     -20
 -25                                                                                                                                     -25
 -30                                                                                                                                     -30
      J an-08           J ul-08         J an-09           Jul-09       Jan-10         J ul-10         J an-11       Jul-11

 Source: Bloomberg, HSBC

14
Macro
   Currency Strategy                                                                                                                                                                                             abc
   January 2012

 9. Speculative market is short EUR
      C ontrac ts ('000)                                                          IM M net non-c om m erc ial futures positions                                                       C ontrac ts ('000)

 150                                                                                                                                                                                                    150

 100                                                                                                                                                                                                    100

   50                                                                                                                                                                                                   50

      0                                                                                                                                                                                                 0

  -50                                                                                                                                                                                                   -50

 -100                                                                                                                                                                                                   -100

 -150                                                                                                                                                                                                   -150
      Jan-08                J ul-08                     Jan-09                J ul-09               J an-10                 J ul-10               J an-11                  J ul-11

 Source: Bloomberg, HSBC

Chart 9 shows the net non-commercial IMM                                                                     2. A resolution is in the interests of all
futures positions in the euro. The market is                                                                 While the politicians around the Eurozone have to
currently net short by record amounts (about                                                                 respond primarily to the demands placed on them
115,000 contracts or USD 20bn). Given the very                                                               by their domestic electorates, they are well aware
rapid growth in volumes in the futures market it is                                                          that the interdependencies are such that a
reasonable to assume that this reflects the wider                                                            resolution must be found. It cannot simply be a
market, and suggests that ‘speculators’ have                                                                 choice between ‘bailing out profligate
already sold the euro, looking for it to weaken as                                                           governments without limit’ (the Northern
the public finance crisis develops.                                                                          European fear) and ‘killing the economy with
The combination of positive longer-term flows                                                                austerity’ (the Southern European fear). As
and a ‘short’ speculative market suggests that the                                                           Stephen King and Janet Henry argued in How to
euro may come under strong upward pressure                                                                   solve the euro’s problems, 30 September 2011,
should the news flow become less negative.                                                                   the costs involved in fixing the institutional
                                                                                                             weaknesses of the Eurozone are far lower than the
                                                                                                             costs of failure. For this reason, we expect a
                                                                                                             lasting resolution to be found. However, political

 10. ECB bond buying may be expanded
 EU R bn                                                                     EC B S e c u ritie s M a rke t P ro g ra m m e a m o u n ts                                                          EU R bn
 50                                                                                                                                                                                                         50
 45                                                                                                                                                                                                         45
 40                                                                                                                                                                                                         40
 35                                                                                                                                                                                                         35
 30                                                                                                                                                                                                         30
 25                                                                                                                                                                                                         25
 20                                                                                                                                                                                                         20
 15                                                                                                                                                                                                         15
 10                                                                                                                                                                                                         10
  5                                                                                                                                                                                                         5
  0                                                                                                                                                                                                         0
                                                           Oct-10

                                                                               Dec-10

                                                                                                                                                                             Oct-11

                                                                                                                                                                                               Dec-11
                   Jun-10

                            Jul-10

                                      Aug-10

                                               Sep-10

                                                                                        Jan-11

                                                                                                 Feb-11

                                                                                                          Mar-11

                                                                                                                   Apr-11

                                                                                                                                       Jun-11

                                                                                                                                                Jul-11

                                                                                                                                                         Aug-11

                                                                                                                                                                  Sep-11
          May-10

                                                                    Nov-10

                                                                                                                              May-11

                                                                                                                                                                                      Nov-11

 Source: Bloomberg, HSBC

                                                                                                                                                                                                                   15
Macro
     Currency Strategy                                                                                                   abc
     January 2012

 11. Fed balance sheet has expanded much more than the ECB

 Index                                       Fed and ECB balance sheets End 2007=100                            Index

 350                                                                                                              350
                                                          Fed            ECB
 300                                                                                                              300

 250                                                                                                              250

 200                                                                                                              200

 150                                                                                                              150

 100                                                                                                              100

     50                                                                                                           50
      Dec-07               Jun-08   Dec-08           Jun-09          Dec-09            Jun-10     Dec-10

 Source: Bloomberg, HSBC

decisions like this will almost certainly take far               leaving, it is a theoretical possibility. We do not
more time than the markets will be willing to                    attach a very high probability to such a move, but
wait, so an interim solution involving a reluctant               we have already analysed the possible market
ECB seems inevitable.                                            implications of a euro split into a ‘core’ and a
                                                                 ‘periphery’ (see Chapter 4).
The ECB has already been engaged in sterilised
government bond buying (chart 10). However, it                   Any euro exit would undoubtedly be surrounded
would be possible for it to do much more.                        by severe market uncertainties that would cause a
                                                                 ‘risk off’ retreat into the dollar in the short term,
The ECB could do more
                                                                 but the revised euro may then begin to rise.
Chart 11 shows the size of the Fed balance sheet
and of the ECB balance sheet indexed to 100 at                   Conclusion
the end of 2007. In response to the financial crisis,            The Eurozone fiscal crisis has deepened
both central banks have increased the size of their              substantially in recent months, and politicians
balance sheets substantially, but the Fed has done               have been slow and faltering in their response.
much more with its QE programme. If the ECB                      However, while Eurozone bonds and equities
were to increase its balance sheet in the same                   have been badly affected, the euro has proved
proportion, this would imply a potential EUR2tr                  resilient. This reflects the strong external position
of additional bond buying would be possible.                     of the euro, and expectations that a lasting
While such an enormous change in ECB activities                  resolution will have to be found. In our view, a
seems very unlikely, it suggests that the ECB does               gradual move towards a resolution is the most
have room to do more while a longer-term                         likely outcome, and as the news flow becomes
solution is found.                                               less negative then the euro is more likely to rise
What if countries leave the euro?                                than to fall in coming months.

The ‘worst case’ scenario of members choosing or
being forced to leave the euro has been given
more credence by Chancellor Merkel’s reaction to
the prospect of a Greek referendum. While there
is nothing in the EMU treaty about a country

16
Macro
    Currency Strategy                                                                                        abc
    January 2012

3. Valuing EUR-USD

A debt repayment model                                 borrowing in the market, in which case we assume
                                                       EUR-USD will settle at OECD ‘fair value’ of 1.25.
An investor buying say 5-year US or Eurozone
government bonds faces four possible outcomes          In order to assist thinking on this issue we have
in terms of the repayment of principal:                constructed a spreadsheet (click here to download),
                                                       which allows users to enter their own expected
1    Borrow: Repayment is made by renewed
                                                       values and probabilities and which then calculates
     market borrowing. While it has normally been
                                                       their implied valuation for EUR-USD.
     assumed that governments will always be able
     to roll over debt by issuing new bonds, recent    Our own best guesses at the values and
     developments in the Eurozone show that this       probabilities result in an implied valuation of
     may not always be the case.                       EUR-USD of 1.34, which supports the idea that
                                                       the euro is unlikely to suffer large falls in the
2    Surplus: Repayment is made as debt is
                                                       coming months despite the Eurozone bond crisis.
     retired. If fiscal policies start generating
     budget surpluses then the bond can be repaid      Valuing EUR-USD
     out of net tax receipts.
                                                       How will you get your money back?
3    Print: Repayment is made as the central bank      While there are many ways in which prices in the
     buys government debt from the market. If the      FX market may be analysed, one useful way of
     central bank is pursuing a long-term QE           thinking about the appropriate valuation for EUR-
     policy, then repayment is essentially             USD is to consider the way in which a
     backstopped by the central bank.                  government bond investor may expect to get
                                                       repaid at the end of the bond’s term. While
4    Default: Repayment is not made in full.
                                                       focusing only on government bonds omits
     ‘Default’ could come in the form of a
                                                       consideration of equity and non-government bond
     ‘haircut’ or by being repaid in a (depreciated)
                                                       flows, government bond markets are the biggest
     new national currency.
                                                       investment sector and questions over fiscal
The appropriate market value of EUR-USD can be         sustainability currently dominate investor thinking
thought of as a function of its expected value under   for both the Eurozone and the US. We are
each of the 16 possible combinations of outcomes       essentially trying to construct an FX answer from
for the US and Eurozone weighted by the                a series of bond market questions.
probability of each outcome. In order to make the
                                                       There are four possible outcomes that an investor
problem tractable, we look at each outcome
                                                       has to consider for bond repayment, each of which
relative to the ‘business as usual’ case of both the
                                                       may be associated with a different likely outcome
US and Eurozone being able to continue
                                                       for the currency at the point of repayment. We

                                                                                                               17
Macro
     Currency Strategy                                                                                                   abc
     January 2012

consider each of these in turn and try to assign                 governments rather than by individual countries.
both values and probabilities to each outcome.                   While this does not look likely in the short term,
This can then be used to generate an implied                     it may be something that becomes more likely
valuation for EUR-USD.                                           over time.

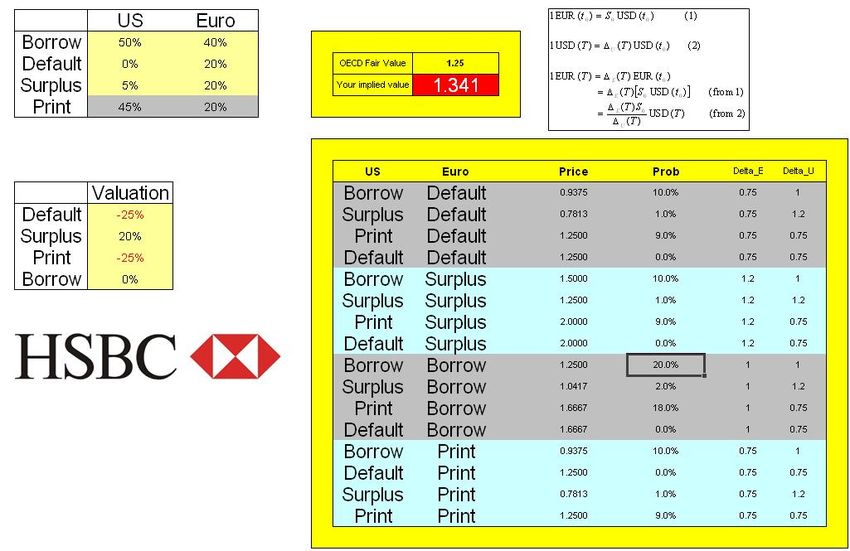
1. Borrow – Business as usual                                    The ‘business as usual’ case is the starting point
In normal circumstances, government debt                         for the analysis, but we have assigned a
management policies involve the regular                          probability of only 50% for the US, and 40% for
issuance of new bonds in the market to refinance                 the Eurozone. Users can input their own values in
existing debt and to finance any required new                    the spreadsheet.
borrowing. As long as debt is perceived as                       In the other possible outcomes, one would expect
sustainable then the market will function                        the currency valuation to be either higher or lower
smoothly. As we have seen in various countries in                than the fair value level. The second case we
the Eurozone, however, the public debt markets                   consider is the seemingly unlikely case where
can become effectively closed to new issuance, in                governments start running budget surpluses, and
which case governments are forced to rely on                     bonds are repaid out of net tax receipts.
support from elsewhere.
                                                                 2. Surplus – Fiscal deficits eliminated
If in say five years’ time, both the US and the                  Given the scale of budget deficits being
Eurozone have debt and deficit positions that are                experienced in the US and in Europe it seems to
perceived as sustainable, then there seems no                    strain credibility to imagine that either will be
strong reason on this basis why EUR-USD should                   running surpluses in the next five years.
deviate much from long-term ‘fair value’ as                      However, there are historical cases where large
measured by the OECD PPP value (chart 1).                        government deficits have been eliminated in a
Another way in which the ‘borrow’ option may be                  five-year period, though this probably does rely
available in the Eurozone is if governments agree                on stronger economic growth than seems likely in
on sufficient fiscal co-ordination that it becomes               the near future.
possible to issue common bonds which are backed
by joint and several guarantees from all Eurozone

 1. ‘Fair value’ for EUR-USD is about 1.25

                                                 OECD EUR PPP                EUR-USD
 1.70                                                                                                             1.70
 1.60                                                                                                             1.60
 1.50                                                                                                             1.50
 1.40                                                                                                             1.40
 1.30                                                                                                             1.30
 1.20                                                                                                             1.20
 1.10                                                                                                             1.10
 1.00                                                                                                             1.00
 0.90                                                                                                             0.90
 0.80                                                                                                             0.80
 0.70                                                                                                             0.70
      Dec-00      Dec-01   Dec-02    Dec-03   Dec-04   Dec-05   Dec-06   Dec-07   Dec-08   Dec-09   Dec-10   Dec-11

 Source: Bloomberg, HSBC

18
Macro
   Currency Strategy                                                                                                        abc
   January 2012

 2. UK government had surpluses in the late 1990s

  % of GDP                                   UK general gov ernment net lending/borrow ing                     % of GDP
   2                                                                                                 HSBC forecasts   2

   0                                                                                                                  0

  -2                                                                                                                  -2

  -4                                                                                                                  -4

  -6                                                                                                                  -6

  -8                                                                                                                  -8

 -10                                                                                                                  -10

 -12                                                                                                                  -12
        1980
        1981
        1982
        1983
        1984
        1985
        1986
        1987
        1988
        1989
        1990
        1991
        1992
        1993
        1994
        1995
        1996
        1997
        1998
        1999
        2000
        2001
        2002
        2003
        2004
        2005
        2006
        2007
        2008
        2009
        2010
        2011
        2012
 Source: HSBC, IMF

Chart 2 shows the UK government borrowing or                        by both the Fed and the Bank of England provide a
lending as a percent of GDP back to 1980. Having                    backstop for the government bond markets by
run a deficit of nearly 8% of GDP in 1993, the                      being a regular buyer of bonds. Should economic
deficit was eliminated by 1998 and the                              activity remain sufficiently weak that austerity
government even ran small surpluses between                         measures to cut government borrowing are
1999 and 2001. Of course, UK public finances                        perceived as counter-productive, then it is possible
were helped by the strong growth that followed                      to imagine the scale of central bank bond buying
sterling’s devaluation in 1992 and the robust                       being increased further and becoming a more or
growth in export markets at the time.                               less permanent feature of the market.

Should there be a realistic prospect of fiscal                      The ECB has thus far been reluctant to engage in
surpluses in the future, then one would expect this                 large-scale QE, believing that the ECB is only
to be reflected in a higher currency valuation.                     responsible for price stability and that it is the
While it is difficult to assess how much the                        national governments that should be responsible
currency valuation would be boosted by a move                       for ensuring that debt and deficits are sustainable.
towards fiscal surpluses, we have assumed a 20%                     In effect, the ECB wants to reduce the probability
premium over fair value. Users can incorporate                      of the ‘print’ option in the hope that it increases
their own estimates between zero and plus 100%                      the probability of the ‘surplus’ option.
in the spreadsheet. We have assigned a 5%
                                                                    Long-term and continuous intervention by the
probability for this outcome for the US and a 20%
                                                                    central bank to buy government debt on an
probability for the Eurozone.
                                                                    outright basis would most likely result in a weaker
3. Print – the central bank acts as                                 currency over time. We have assumed that this
backstop                                                            option would result in a currency 25% weaker
The third possible outcome for the bondholder is                    than the base case. Again, users can incorporate
that repayment is effectively, if indirectly, made by
the central bank. While we have not seen extreme
forms of monetisation by any post-war developed
world central bank, the QE policies being pursued

                                                                                                                              19
Macro
     Currency Strategy                                                                                              abc
     January 2012

3. Eurozone government debt outstanding
                                                              Debt (EURbn)                  Pct of Eurozone total

France                                                               1,309                                  21%
Germany                                                              1,263                                  20%
Greece                                                                 345                                   5%
Ireland                                                                110                                   2%
Italy                                                                1,593                                  25%
Portugal                                                               163                                   3%
Spain                                                                  654                                  10%
Others                                                                 941                                  15%
Total                                                                6,379                                 100%
At risk'                                                             2,865                                  45%
Source: Bloomberg, HSBC

their own numbers (between zero and -99%) in              equivalent to about a 25% overall currency
the spreadsheet. We have assigned only a 20%              decline. Users can incorporate their own
probability of this for the Eurozone and a 45%            numbers (between zero and -99%) in the
probability for the US.                                   spreadsheet. We have assigned a zero probability
                                                          of this outcome for the US, and a 20% probability
4. Default – bond ‘haircuts’ or
                                                          for the Eurozone.
currency devaluation
The final possibility is a failure to return the entire   Putting it all together
principal at the end of the bond’s life. This could       On the basis of the assumptions made, it is
occur either by traditional default or through the        possible to calculate an implied valuation for
introduction of a new national currency in which          EUR-USD once probabilities are applied to the
case the principal is returned in this currency, but      possible outcomes. Chart 4 is a screen shot of the
the value of the currency is significantly below          spreadsheet with our sample probabilities
that of the original currency.                            included (click here to download the spreadsheet).
                                                          For both the US and the Eurozone a probability of
Default by the US (in the sense that the dollar
                                                          borrow, default, surplus and print are input in the
value of a bond is not returned at the end of its
                                                          top left. The ‘print’ probability is calculated by
life) would seem inconceivable, but in the case of
                                                          the sheet once the other three are input to ensure
the Eurozone we have already seen a proposal for
                                                          the total is 100%. Valuation variations from ‘fair
haircuts on Greek bonds, and the possibility of
                                                          value’ are input below that. The sheet then
one or more country choosing or being forced to
                                                          calculates an implied valuation.
leave the Eurozone is not unimaginable.
                                                          For simplicity, we have assumed that all the four
What would happen to the bond investor in this
                                                          possible outcomes are mutually exclusive. While
case? If we assume that bond investors hold
                                                          ‘borrowing’ and ‘default’ seem unlikely to be
Eurozone bonds in proportion to the total
                                                          seen at the same time, and ‘surplus’ would mean
outstanding debt, then a case can be made that
                                                          ‘borrowing’ is unnecessary, it is possible that
about 45% of debt is ‘at risk’ (Greece, Ireland,
                                                          there could be a combination of ‘printing’ and
Italy, Portugal and Spain). Total outstanding
                                                          ‘borrowing’ at the same time. As this would
government debt in the major Eurozone
                                                          probably result in an FX value somewhere
economies is shown in table 3. If the recovery rate
                                                          between the two outcomes, the results are unlikely
on this proportion were 50% in the event of either
                                                          to be much affected by this.
type of default, then the overall impact would be

20
Macro
   Currency Strategy                                      abc
   January 2012

 4. Valuing EUR-USD using the spreadsheet

 Source: HSBC

Conclusion
The analysis presented here is very much an attempt
to put the current sovereign debt and deficit
problems in the Eurozone and the US into an FX
context. It creates a framework in which it is
possible to think about FX market values in the
context of several radically different possible future
outcomes. The resulting implied valuation depends
crucially on the probabilities that are assigned to
each outcome. Those who believe that Eurozone
governments will have a good chance of regaining
control of their fiscal policies while the US relies on
the Fed will get an implied EUR-USD valuation
much higher than those who believe the Eurozone
has a high risk of default while the US will be able to
cut its deficit. The value of EUR-USD in the market
can be thought of as the outcome of a wide range of
views about a very uncertain future.

                                                            21
Macro
     Currency Strategy                                                                                                                                                                  abc
     January 2012

4. Where core-EUR might have been

CHF and EUR                                                                                                      CHF move together, this correlation is very high,
                                                                                                                 as it was for most of the 1999-2009 period. The
As can be seen in chart 1, Swiss interest rate
                                                                                                                 correlation did fall to some extent during the
policy has mirrored that seen in the Eurozone for
                                                                                                                 financial crisis, but it was fully re-established
most of the past ten years. Relative inflation
                                                                                                                 during the early part of the recovery in 2009,
experience, however, suggests that historical
                                                                                                                 before falling sharply once the sovereign credit
relationships in monetary policy are no longer valid.
                                                                                                                 issues emerged.
Whilst Swiss CPI is currently 0.6% year on year,
Eurozone inflation is currently 2.7% (chart 2). Core                                                             A further demonstration of the changed
inflation in the Eurozone is lower, at 1.5% year on                                                              relationship between EUR and CHF can be seen
year, but it is flat in Switzerland.                                                                             in implied options volatility. As we argued in
                                                                                                                 “Swiss Franc – the last safe haven”, Currency
Currency performance is the key
                                                                                                                 Weekly 4 April 2011, central bank intervention in
The main driving force behind this inflation                                                                     USD-JPY made CHF the only viable safe haven
divergence is the performance of the currency.                                                                   currency, which made it more susceptible to
From the beginning of the sovereign credit                                                                       swings in ‘risk on-risk off’ sentiment and
problems in the Eurozone in 2010 until the low in                                                                therefore more volatile. Chart 5 shows implied 3-
EUR-CHF in August 2011, the EUR lost about                                                                       month EUR-CHF compared with the average of
25% against the CHF, having spent much of the                                                                    other euro crosses (NOK, SEK, PLN, HUF, and
previous 10 years in a 1.45-1.65 range (chart 3).                                                                CZK). Until the crisis and again in 2009, EUR-
The new exchange rate environment can be seen                                                                    CHF volatility was below 5%. Since 2010, it has
even more clearly in chart 4. This shows the six-                                                                moved above 10% and peaked above 20% until
month rolling correlation of daily changes in                                                                    the SNB set the EUR-CHF floor.
EUR-USD and USD-CHF. When the EUR and

 1. ECB and SNB policies have historically moved together                                                         2. Swiss and Eurozone inflation has diverged

 %                                EUR and CHF policy rates                                                 %                          Sw iss and Eurozone inflation
                                                                                                                  % y -o-y                                                  % y -o-y
 5.0                                                                                                       5.0     5                          Sw iss            Eurozone           5
 4.0                                                                                                       4.0     4                                                               4
                                                                                                                   3                                                               3
 3.0                                                                                                       3.0
                                                                                                                   2                                                               2
 2.0                                                                                                       2.0     1                                                               1
 1.0                                                                                                       1.0     0                                                               0
                                                                                                                  -1                                                               -1
 0.0                                                                                                       0.0
                                                                                                                  -2                                                               -2
       Jul-01
                Jul-02
                         Jul-03
                                   Jul-04
                                            Jul-05
                                                     Jul-06
                                                              Jul-07
                                                                       Jul-08
                                                                                Jul-09
                                                                                         Jul-10
                                                                                                  Jul-11

                                                                                                                       1999

                                                                                                                               2001

                                                                                                                                            2003

                                                                                                                                                       2005

                                                                                                                                                              2007

                                                                                                                                                                     2009

                                                                                                                                                                            2011

 Source: Bloomberg, HSBC                                                                                          Source: Bloomberg, HSBC

22
Macro
   Currency Strategy                                                                                                                                                                     abc
   January 2012

 3. EUR-CHF stability broke down in 2010                                          4. The correlation between EUR and CHF movements has
                                                                                  fallen sharply

 1.80                                EUR-CHF                              1.80             EUR-USD and USD-CHF - 6m rolling correlation
                                                                                  100%                                                                                            100%
 1.60                                                                     1.60
                                                                                   80%                                                                                            80%

 1.40                                                                     1.40     60%                                                                                            60%

                                    Sov ereign credit                              40%                                                                                            40%
 1.20                                                                     1.20
                                           problems                                20%                                                                                            20%
 1.00                                                                     1.00      0%                                                                                            0%
        Jan-00
                 Jan-01
                 Jan-02
                 Jan-03
                           Jan-04
                           Jan-05
                                     Jan-06
                                     Jan-07
                                              Jan-08
                                              Jan-09
                                                        Jan-10
                                                        Jan-11
                                                                 Jan-12

                                                                                           Jun-99
                                                                                           Jun-00
                                                                                           Jun-01
                                                                                           Jun-02
                                                                                           Jun-03
                                                                                           Jun-04
                                                                                           Jun-05
                                                                                           Jun-06
                                                                                           Jun-07
                                                                                           Jun-08
                                                                                           Jun-09
                                                                                           Jun-10
                                                                                           Jun-11
 Source: HSBC, Bloomberg                                                          Source: HSBC, Bloomberg

For Swiss monetary policy, the implications of                                   Chart 6 shows an MCI for Switzerland using
this new CHF behaviour can best be analysed by                                   April 2002 as a benchmark and giving an 80%
using monetary conditions indices.                                               weight to changes in real interest rates and a 20%
                                                                                 weight to changes in the effective exchange rate.
Monetary Conditions Index
                                                                                 As can be seen, there was relatively little change
A monetary conditions index (MCI) aims to                                        in the MCI between 2002 and 2009, but from then
measure the effect of both real interest rate changes                            until July 2011 conditions tightened by the
and exchange rate moves on the economy. If the                                   equivalent of about 750bp in interest rates. Given
exchange rate is strengthening then, other things                                this, it is not too surprising that the SNB took the
being equal, monetary conditions will be                                         dramatic step of setting a floor under EUR-CHF
tightening, and vice versa. An MCI can be used to                                and promising unlimited intervention to sustain it.
gauge whether (relative to some benchmark period)
monetary conditions are boosting or restraining the                              Where core EUR might have been
economy by combining the effect of interest rate                                 The behaviour of the EUR and CHF in 2010 and
and exchange rate movements.                                                     2011 and the tightening of monetary conditions in
                                                                                 Switzerland have interesting implications for the
                                                                                 Eurozone. Imagine that the EUR had been split

 5. EUR-CHF implied volatility spiked                                             6. Swiss monetary conditions tightened dramatically
                                                                                  because of currency appreciation

 %                         Av erage EUR-Europe v ol                        %                              Sw itzerland - MCI (Apr 2002= 0)
 25                        EUR-CHF v ol                                    25     8%                                                                                               8%

 20                                                                        20     6%                                                                                               6%

                                                                                  4%                                                                                               4%
 15                                                                        15
                                                                                  2%                                                                                               2%
 10                                                                        10
                                                                                  0%                                                                                               0%
  5                                                                        5
                                                                                  -2%                                                                                              -2%
  0                                                                        0
                                                                                        Apr-02
                                                                                                 Apr-03
                                                                                                          Apr-04
                                                                                                                   Apr-05
                                                                                                                            Apr-06
                                                                                                                                     Apr-07
                                                                                                                                              Apr-08
                                                                                                                                                       Apr-09
                                                                                                                                                                Apr-10
                                                                                                                                                                         Apr-11

  Jan-99 Jan-01 Jan-03 Jan-05 Jan-07 Jan-09 Jan-11

 Source: HSBC, Bloomberg                                                          Source: HSBC, Bloomberg

                                                                                                                                                                                           23
Macro
     Currency Strategy                                                                                                                                                                   abc
     January 2012

 7. Swiss and German economies tend to move together

                                                                   German IFO and Sw iss KOF Indices
 113                                                                                                                                                                              3.5
                                                                           IFO (LHS)                    KOF (RHS)
 108                                                                                                                                                                              2.5
 103
                                                                                                                                                                                  1.5
     98
                                                                                                                                                                                  0.5
     93
                                                                                                                                                                                  -0.5
     88

     83                                                                                                                                                                           -1.5

     78                                                                                                                                                                           -2.5
          Dec-94

                   Dec-95

                            Dec-96

                                     Dec-97

                                              Dec-98

                                                       Dec-99

                                                                Dec-00

                                                                           Dec-01

                                                                                     Dec-02

                                                                                              Dec-03

                                                                                                        Dec-04

                                                                                                                 Dec-05

                                                                                                                          Dec-06

                                                                                                                                     Dec-07

                                                                                                                                              Dec-08

                                                                                                                                                       Dec-09

                                                                                                                                                                Dec-10

                                                                                                                                                                         Dec-11
 Source: HSBC, Bloomberg

into two currencies in 2009, call them EUR-core                                                    What would be the value of EUP-USD? There are
(EUC) and EUR-periphery (EUP) where EUC                                                            several possible ways of estimating this, but the
members were those that had no significant public                                                  simplest assumes that the current EUR is just a
sector funding problems. Given the close                                                           simple average of the values of the hypothetical
association between the behaviour of the Swiss                                                     EUC and EUP. This would mean EUP-USD of
economy and the German economy (chart 7), it                                                       about parity. The theoretical trajectories of EUC
would not be unreasonable to suggest that EUC-                                                     and EUP are shown in chart 8.
CHF would have remained fairly stable.
                                                                                                   What would this mean for economic performance?
Assuming EUC-CHF had remained at 2009 EUR-
                                                                                                   With a much weaker currency, EUP area exports
CHF levels (1.50) this would imply a peak EUC-
                                                                                                   would probably have been performing better and
USD of above 2.00 in September 2011(about 45%
                                                                                                   fiscal consolidation may have been slightly easier if
higher than EUR) and a current level of about 1.60.
                                                                                                   there was the prospect of stronger activity. Inflation
                                                                                                   in the EUC area would probably be very subdued

 8. Had the euro been split, the currency performance probably would have been very different

                                                                         'EUC' and 'EUP' in 2011
 2.20                                                                                                                                                                             2.20
                                                                                    EUC                EUP
 2.00                                                                                                                                                                             2.00
 1.80                                                                                                                                                                             1.80
 1.60                                                                                                                                                                             1.60
 1.40                                                                                                                                                                             1.40
 1.20                                                                                                                                                                             1.20
 1.00                                                                                                                                                                             1.00
 0.80                                                                                                                                                                             0.80
 0.60                                                                                                                                                                             0.60
      Jan-11           Feb-11 Mar-11          Apr-11 May -11              Jun-11          Jul-11       Aug-11      Sep-11          Oct-11     Nov -11 Dec-11

 Source: HSBC, Bloomberg

24
Macro
   Currency Strategy                                                                                                              abc
   January 2012

 9. German and Greek real effective exchange rates would look very different

                                     Real effectiv e ex change rates (BIS, rebased 1995=100)
                              Sw iss REER                     Germany REER                        Greece REER
 120                                                                                                                        120
 115                                                                                                                        115
 110                                                                                                                        110
 105                                                                                                                        105
 100                                                                                                                        100
  95                                                                                                                        95
  90                                                                                                                        90
  85                                                                                                                        85
  80                                                                                                                        80
    Jan-95        Jul-96   Jan-98   Jul-99   Jan-01     Jul-02    Jan-04       Jul-05   Jan-07   Jul-08   Jan-10   Jul-11

 Source: HSBC, Bloomberg

and the EUC central bank may not have felt the                        Conclusion
need to raise rates as the ECB did in 2011. Inflation                 The sharp change in behaviour of EUR-CHF since
in the EUP area would probably be higher but,                         the beginning of the Eurozone sovereign debt
rather like the UK, the impact would be mostly felt                   problems raises the question of how a split euro
on real incomes and the EUP central bank may also                     would have performed since 2010. Assuming a
have been reluctant to tighten. EUC area holders of                   core euro would have remained relatively stable
EUP bonds would, of course, have suffered a big                       against the CHF, then monetary conditions in the
currency loss (assuming they were not hedged) in                      core Eurozone would also have been
the same way EUR holders of gilts did in 2007/08.                     significantly tighter, and the central bank would
Relative competitive positions in the Eurozone                        perhaps not have decided to tighten policy in
would have been very different. Chart 9 shows the                     2011. There seems little doubt that a euro-
BIS real effective exchange rates for Greece,                         periphery currency would by now be significantly
Switzerland and Germany. With higher domestic                         weaker than the EUR.
inflation, Greece’s REER has moved steadily                           Would two EURs have been better than one? This is
higher but Germany’s has fallen, implying a                           impossible to say given the counter-factual nature of
stronger competitive position. With a split EUR or                    the argument. The relationship between the EUR
a situation where the peripheral Eurozone deflated                    and the CHF does, however, suggest how things
internally, Germany’s REER would have been                            might have been different for the Eurozone.
higher and the Greek REER would have been
significantly lower. Although the financial cost of
the sovereign debt problems may be high for the
core countries, they have gained a competitiveness
boost from having a currency much less strong
than it otherwise could have been.

                                                                                                                                    25
Macro
     Currency Strategy                                                                                        abc
     January 2012

RMB: Less appreciation,
more volatility in 2012
 Lower inflation and a move close to equilibrium means that RMB
     will see less appreciation and more volatility in 2012
 Internationalization will be the key focus of RMB policy
 RMB still more attractive than many peers and remains a core
     favourite

We reiterate our RMB forecast for around 3%               A secondary effect of these shifting pressures is
appreciation in 2012. These expectations are              that RMB policy will be focused on more
based on both a decline in the inflation risk and         internationalization in 2012, rather than on
the fact that the RMB is now closer to an                 appreciation.
equilibrium valuation. With less fundamental
                                                          RMB story less structural,
appreciation pressure, net flows will continue to
                                                          more cyclical now
become more volatile which will translate into
greater volatility in RMB spot. Despite this, we          Recent evidence suggests that RMB is
view the RMB as one of our preferred Asian                approaching equilibrium. When we first flagged
currencies in 2012, especially since other Asian          this in 18 months ago (see “RMB… game change”,
currencies are at risk of trading with even               4 June 2010), it appeared to be a new and
greater volatility.                                       minority view. However, trends in the hard data

 1. RMB valuations back at all-time highs…                 2. …while the trade surplus make new lows

 130                                                       10%
                                                                     % GDP
 120
                                                            8%
 110
 100
                                                            6%

     90                                                     4%
     80
                                                            2%
     70
                                                            0%
     60
      Jan-94      Jan-98   Jan-02     Jan-06    Jan- 10        Jan-06 Jan-07 Jan-08 Jan-09 Jan-10 Jan-11
                                                                               Trade balance, nsa, 12mma
                           CNY REER       LTA

 Source: HSBC, CEIC                                        Source: HSBC, BIS

26
Macro
   Currency Strategy                                                                                                                     abc
   January 2012

means that this view will become increasingly                depreciation pressure the currency has been facing
mainstream among policymakers. The trade-to-                 since the end of September.
GDP surplus continues to decline (chart 1), REER
                                                             We first flagged the net outflows when the 3Q
valuations are making new highs (chart 2), while
                                                             2011 reserves report showed a September drop in
growing outward investment is recycling the
                                                             reserves (chart 3). This has appeared to continue
dwindling trade surplus. The recent phenomenon
                                                             through the fourth quarter, with recent press stories
of the near-term RMB depreciation pressures only
                                                             highlighting declines in various measurements of
served to reinforces this sentiment.
                                                             official FX reserves through November (see
This suggests cyclical considerations will                   Appendix C: “Deciphering intervention data”, in
dominate structural ones in determining FX                   the full version of this report).
policy, as there is no longer a need to engineer a
                                                             These net outflows have led spot USD-CNY to
sustained revaluation of the currency over time.
                                                             trade above the midpoint fixings for much of the
For this reason, we had long expected RMB
                                                             fourth quarter of 2011, persistently testing the
appreciation to decline back to a 3% pace
                                                             band ceiling at times (chart 4). This has caused
following a peak in inflation earlier this year (see
Asian FX Focus: Faster appreciation for now,                 unusual behaviour in the management of the FX
4 May 2011).                                                 regime (an issue we address separately in
                                                             “Appendix A: FX regime under siege?” the full
Meanwhile, FX policy may resume delivering                   version of this report)
more two-way volatility in USD-CNY, as it did in
2H 2010, and the basket may start playing a                  Shifting expectations and position
bigger role as well. RMB volatility will not only            adjustment…
increase because of FX policy, but because these             To us, what is happening is a system-wide process
structural trends themselves will increase the               of reduction in long RMB positioning across the
volatility of net flows.                                     economy, due to reduced appreciation
Net flows are becoming more                                  expectations (chart 5). The broader market since
                                                             the second half of last year has substantially
volatile
                                                             scaled back its RMB expectations (chart 5).
The most notable development for the RMB
recently has been the almost persistent

 3. FX reserve indicators have recently shown net outflows    4. The FX regime dynamics have changed under capital
                                                              outflows

 150                                                          6.45
         USDbn
 100
                                                              6.40
  50
                                                              6.35
   0

 -50                                                          6.30

    Jan-07                    Jan-09              Jan-11
                                                              6.25
                           estimated interv ention                Sep-11            Oct-11           Nov -11           Dec-11
                           PBoC B/S Foreign Assets FX
                                                                          USD-CNY                     Trading Band                 Fix

 Source: Bloomberg, HSBC                                      Source: HSBC estimates based on data from Bloomberg, Reuters, CEIC

                                                                                                                                           27
You can also read