WHAT WILL BE THE NEW NORMAL FOR VIETNAM? - The economic impact of COVID-19 - TAKING STOCK - ReliefWeb
←
→
Page content transcription
If your browser does not render page correctly, please read the page content below
Public Disclosure Authorized

                               TAKING STOCK                             JULY 2020
Public Disclosure Authorized
Public Disclosure Authorized

                                                  WHAT WILL BE
                                              THE NEW NORMAL
                                                 FOR VIETNAM?
Public Disclosure Authorized

                                              The economic impact of COVID-19

                                                                Taking Stock July 2020   1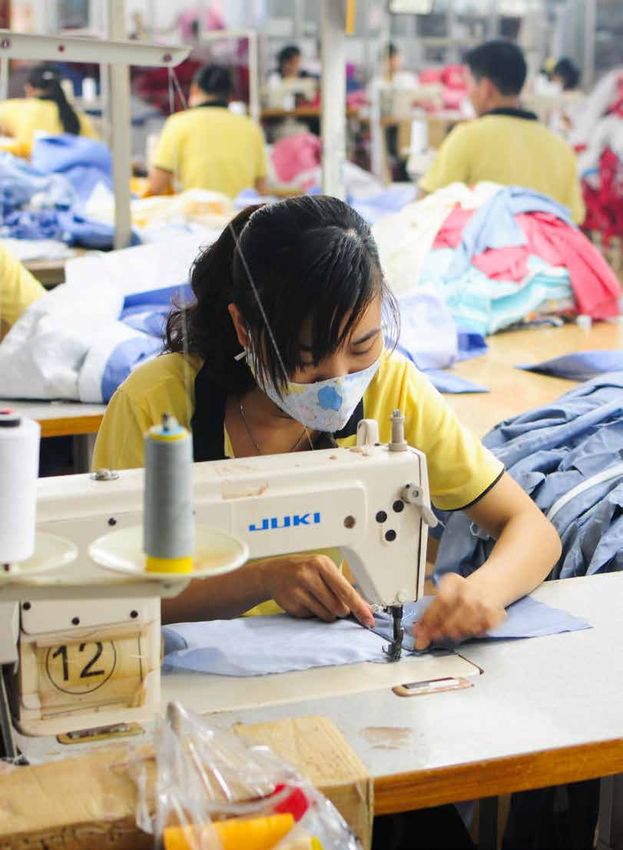
TAKING STOCK                         JULY 2020

               WHAT WILL BE
           THE NEW NORMAL
              FOR VIETNAM?
               The economic impact of COVID-19
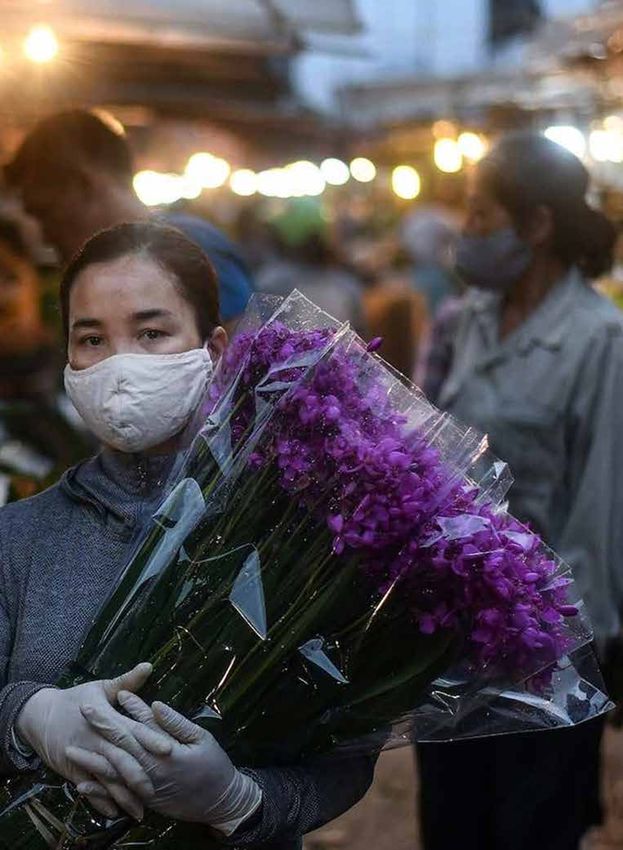
@2020 The World Bank

1818 H Street NW, Washington DC 20433

Telephone: 202-473-1000; Internet: www.worldbank.org

This work is a product of the staff of The World Bank with external contributions. The findings, interpretations and
conclusions expressed in this work do not necessarily reflect the views of The World Bank and its Board of Executive
Directors. The World Bank do not guarantee the accuracy of the data inclued in this work. The boundaries, colors,
denominations and other information shown on any map in this work do not imply any judgement on the part of The
World Bank concerning the legal status of any territory or the endorsement or acceptance of such boundaries.

Nothing herein shall constitute or be considered to be a limitation upon or waiver of the privileges and immunities of
The World Bank, all of which are specifically reserved.

All queries on rights and licenses shoud be addressed to the Publishing and Knowledge Division, The World Bank, 1818
H Street NW, Washington DC 20433, USA; fax: 202-522-2625; email: pubrights@worldbank.org.

Cover photo: Manan Vatsyayana/gettyimages.com; photos inside: Linh Pham /info@linh-pham.com; Shutterstock.
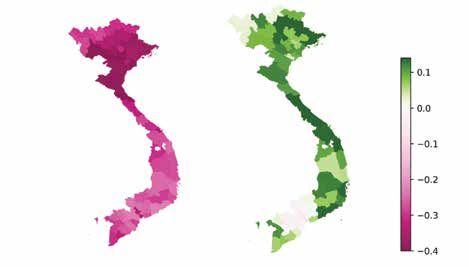
TABLE OF CONTENTS

Acknowledgments................................................................................................................................................ v

Abbreviations....................................................................................................................................................... vi

Key Messages..................................................................................................................................................... vii
   COVID-19 has plunged the planet into a deep recession............................................................................. vii
   Vietnam’s economy has been hurt but remains resilient.............................................................................viii
   Positive short- to medium-term outlook with great uncertainties................................................................ ix
   Transforming the crisis into an opportunity.................................................................................................... x

Introduction........................................................................................................................................................... 1

COVID-19 in the world........................................................................................................................................ 14

The impact of COVID-19 on the Vietnamese economy.................................................................................. 17
     Who have been the most economically affected by the COVID-19 crisis?................................................ 24
     What has been the government’s response so far?.................................................................................... 27
     The government’s response is justified by the statistical value of life...................................................... 30

Short- and medium-term economic prospects............................................................................................... 31
     In the search of new drivers to jump start the recovery.............................................................................. 31
     Baseline scenario for 2020–22....................................................................................................................35
     Managing risks.............................................................................................................................................. 36

Main opportunities – no-regret policies for Vietnam...................................................................................... 37

What will be the new normal for Vietnam?....................................................................................................... 41

Main references.................................................................................................................................................. 42

Boxes
Box 1. The pulse of the COVID-19 crisis as indicated by households in Vietnam.......................................... 25

Box 2. Three examples of how the government has combined pragmatism and foresight in
        its COVID-19 response:........................................................................................................................... 30

                                                                                                                                Taking Stock July 2020                      v
Figures
Figure 1. Vietnam’s economic activity has slowed amid the COVID-19 pandemic........................................ 20
Figure 2. ...weighed down by lower services, while agricultural output remained resilient........................... 20
Figure 3. External sector growth is slowing while domestic activities are rebounding................................. 20
Figure 4. Inflation is decreasing but food prices are on the rise...................................................................... 20
Figure 5. Credit expansion is decreasing…........................................................................................................ 20
Figure 6. …while revenue collection is falling quickly....................................................................................... 20
Figure 7. The level of international reserves increased up to end-March 2010…........................................... 22
Figure 8. …while the exchange has remained stable in recent months (Dong per US$)................................ 22
Figure 9. Most export categories declined except for computers and rice (%, y/y)....................................... 22
Figure 10. …while foreign demand weakened, with the exception of China and the U.S. (%, y/y).................22
Figure 11. Imports contracted (%, y/y).............................................................................................................. 22
Figure 12. FDI inflows (U.S. million, commitment)........................................................................................... 22
Figure 13. Fall in almost all tax revenue, during the first semester (%, y/y).................................................... 23
Figure 14. Reasons for reduction in household income................................................................................... 26
Figure 15. Variation in activity of the industrial sector, first semester 2020 (y/y).......................................... 27
Figure 16. Regional variations in people mobility (% change compared to baseline).................................... 28
Figure 17. Recent trends in international and domestic flights and policy stringency index for Vietnam ...29
Tables
Table 1. GDP growth by region, 2017–2021...................................................................................................... 16
Table 2. Timeline of Vietnam’s actions in the battle against COVID-19.......................................................... 18
Table 3. List of social protection measures...................................................................................................... 29
Table 4. Selected economic indicators, Vietnam, 2017–22............................................................................. 36
Table 5. Summary of no-regret opportunities................................................................................................... 39
vi What will be the new normal for Vietnam?ACKNOWLEDGMENTS
This report was written by Jacques Morisset and Viet Tuan Dinh with inputs from colleagues of the World
Bank, including Quang Hong Doan, Duc Minh Pham, Dorsati Madani, Obert Pimhidzai, Kai Kaiser, Dung Viet
Do, Alwaleed Fareed Alatabani, and Judy Yang.
Ngan Hong Nguyen and Anh Thi Quynh Le provided communication support. Administrative assistance
was provided by Khanh Linh Thi Le.
This report provides an evaluation by the World Bank team of recent economic trends in Vietnam. It builds
on several analytical efforts that were recently published by the World Bank, including Global Economic
Prospects, which provides the most recent views on the state of the world economy (https://www.worldbank.
org/en/publication/global-economic-prospects). On Vietnam, monthly macroeconomic monitoring notes
as well as a series of five policy notes are also available, retracing the evolution of the COVID-19 crisis
and its impact on the economy over the past few months (http://documents.worldbank.org/curated/en/
docsearch/collection-title/COVID-19%2520Policy%2520Response%2520Notes?colT=COVID-19%2520Poli
cy%2520Response%2520Notes).
The team is grateful for the overall guidance of Deepak Mishra (Practice Manager), Ousmane Dionne
(former Country Director for Vietnam), and Carolyn Turk (Country Director for Vietnam).
Taking Stock July 2020 viiCentral Exchange Rate of the State Bank of Vietnam: US$ = 23,225 dong
Government Fiscal Year: January 1–December 31
ABBREVIATIONS
EU European Union
GDP gross domestic product
GSO General Statistics Office
IMF International Monetary Fund
MOF Ministry of Finance
MOLISA Ministry of Labor, Invalids, and Social Affairs
SBV State Bank of Vietnam
SMEs small and medium-sized enterprises
VAT value-added tax
y/y year-over-year
viii What will be the new normal for Vietnam?Taking Stock July 2020 ix
x What will be the new normal for Vietnam?
KEY MES SAGES

A
              s of early July 2020, life in Hanoi          new role for fiscal policy. Yet, by being ahead of
              appears to be back to normal or close to     the curve, Vietnam has a unique opportunity to
              what it used to be before the COVID-19       increase its footprint in the world economy and
              pandemic. Traffic jams, construction         to push ahead with its agenda of reforms so it
              noise, and people sipping a cup of tea       can accelerate its quest to become a high-income
or coffee can all be seen again in the streets of the      economy in the foreseeable future.
capital city. The return of these familiar scenes is
an obvious tribute to the government’s policy that         COVID-19 has plunged the planet into a deep
has helped contain the virus and contributed to            recession
saving human lives. Today, most social distancing
                                                           The global economy has entered into its worst
measures have been lifted, explaining the observed
                                                           recession in recent decades. Global GDP is
recovery of many domestic activities.
                                                           expected to decline by 5.2 percent in 2020 as the
However, this rapid return to normality may prove to       result of the COVID-19 pandemic and the associated
be illusory. Several economic and financial indicators     measures taken to contain it over time. Today, it
have not yet bounced back to their precrisis levels,       is estimated that over half a million people have
including the gross domestic product (GDP) growth          already died from the coronavirus, and 10 million
rate that, at 1.8 percent in the first semester of 2020,   have been infected worldwide – and these figures
was approximately 5 percentage points lower than           are mounting every day.
its historical trajectory during recent years. The
                                                           Not only is the world facing its worst recession, but
pandemic has also left indelible scars, especially on
                                                           almost all countries are expected to be negatively
people and businesses that were the least prepared
                                                           affected by the impact of the pandemic. With the
for such a shock. A closer look at the streets of
                                                           exception of East Asia, all regions will report negative
Hanoi reveals that some hotels and shops remain
                                                           GDP growth rates in 2020. Similarly, only 57 out of
closed, while others have simply disappeared. This
                                                           191 countries are expected to increase their GDP
report argues that Vietnam should not envision a
                                                           from 2019 to 2020, down from 171 a year ago.
return to the old normal, but rather should define
what will be the new normal as the pandemic has
                                                           If the pandemic is gradually controlled, the global
changed in so many ways how people live, work,
                                                           economy will expand again by an average of 4
and communicate.
                                                           percent in 2021. Yet, big uncertainties remain; not
                                                           only might new waves of coronavirus arise in the
The new normal for Vietnam will depend on many
                                                           absence of an effective and generalized vaccine,
factors, but it will be to a large extent shaped by
                                                           but unpredictable economic, political, and social
the way the government manages the exit of the
                                                           changes may also occur in the aftermath of a shock
COVID-19 pandemic. Because the country will
                                                           as severe as COVID-19. If history is a good predictor
operate in a world with a great deal of domestic and
                                                           of the future, the organization of the world in the
international uncertainty for the foreseeable future,
                                                           coming years will most certainly look different from
new drivers of growth will be required, including a
                                                           the way it looks today.

                                                                                      Taking Stock July 2020          xi
Vietnam’s economy has been hurt but remains following four takeaways have been identified:
resilient
yy While many households and businesses have
COVID-19 is a health shock that has forced been affected by COVID-19, most of the impact
governments around the world to make hard has been temporary and is decreasing over time.
choices between saving lives and economic yy Family businesses (over 90 percent of total firms
restrictions. While many countries hesitated in operating in Vietnam) have been affected more
their decision process, Vietnam reacted quickly than wage earners but exhibited a high degree
and boldly. The combination of early measures – of flexibly by rebounding quickly in the last two
targeted testing and tracking as well as innovative months.
information campaigns – has proved to be highly
effective. Despite being located next to the original yy There are significant variations in terms of
epicenter of the pandemic, Vietnam has beaten the impact across and within sectors of activities,
odds since there has been zero community-driven with tourism and transport services as well as
infection since mid-April and no deaths so far while exporting manufacturing activities the most
the world awaits the arrival of a vaccine that has yet affected, while farming has been relatively
to be discovered. isolated.
yy Location matters as both the impact of the
Vietnam’s economy has been hurt by the pandemic lockdown and the easing of restrictions have
as the GDP growth rate recorded in the first semester had differential impacts by region. The northern
of 2020 was the lowest of the three last decades. provinces were most affected by social
Yet, it has remained one of the most dynamic distancing measures, while the central region
economies in the world. This economic resilience recovered faster than others.
can be explained by two factors. First, from
February to April, the foreign sector was the driving Aware of the financial distress caused by the
force as merchandise (net) exports continued to pandemic, the government has been quick to
grow at the exceptional rate of above 10 percent use monetary and fiscal tools to help the most
per month (year-over-year). During this first phase, vulnerable businesses and people, including by
domestic activities declined due to increasing tax relief and direct financial support, which have
social distancing and mobility restrictions, which been relatively well implemented since early April.
culminated in the almost complete national The Vietnamese policy response also relied on a
lockdown in April. Second, from May to the present, combination of foresight and pragmatism. Thanks
domestic activities rebounded when the authorities to the accumulation of significant cash-flow
started to ease most mobility restrictions; as an reserves due to its prudent fiscal management
example, manufacturing production surged by over before the crisis, the authorities were able to
30 percent in the last two months. Meanwhile, the respond immediately both at the central and local
foreign sector has started to lose steam, due to levels, without additional domestic or external
weaker demand by Vietnam’s main trading partners. borrowing. There has been no sense of panic. To
Concurrently, foreign direct investment inflows and counterbalance the projected slowdown in global
remittances from Vietnamese living abroad have trade, the authorities have also reacted quickly by
also shown signs of weakness. instructing that logistical costs of exporters be
reduced, while cutting red tape, reducing fees, and
If, overall, the economy has been resilient, many streamlining procedures in customs and in main
Individual businesses and people have been transport hubs.
exposed to the harsh realities of the pandemic.
Using a combination of several information While it might be too early to assess Vietnam’s
sources, including from the Ministry of Labor, sector performance in its fight against COVID-19, the health
economic data, phone surveys, and big data, the benefits have been evident. Using the statistical
xii What will be the new normal for Vietnam?value of life, these gains can be estimated at technical experts. It will, however, require careful
around US$15 billion, which would be significantly monitoring as opening the economy should not be
higher than the loss in GDP that have occurred so done to the endangerment of the health benefits
far or even forecasted for 2020. The success of the that have accrued so far.
strategy is further corroborated by the high degree
of satisfaction expressed by Vietnamese citizens in The second line of action is to accelerate the
their government’s actions, as over 90 percent in a execution of the public investment program. While
recent survey reported being satisfied. spending faster and better can be an effective tool
to jump start the recovery through its multiplier
Positive short- to medium-term outlook with effect on jobs and the economy, it will require
great uncertainties significant improvements in financial management,
as explained in the report. The focus should be on
Although the Vietnamese economy suffered from priority projects but also on decentralized public
COVID-19 in the first semester of 2020, prospects works programs that are generally effective to
remain positive for both the short and medium create direct and indirect jobs for vulnerable people
term. Assuming a gradual improvement in the in affected areas.
world economy, GDP should rebound in the second
semester of 2020 so that the economy will grow The third line of action is to support the private
around 2.8 percent for the entire year. It should sector, especially the businesses that have been
further expand by 6.8 percent in 2021 (baseline temporarily affected by the crisis. However, this must
scenario). With less favorable external conditions, be done with caution because not all businesses
the economy will expand by only 1.5 percent in have been equally affected by the crisis. Some
2020 and 4.5 percent in 2021 (downside scenario). targeting to the most affected sectors or firms will
Regardless of scenario, Vietnam is expected to be necessary to avoid a waste of public resources.
remain one of the fastest-growing economies in the It might also be pointless to help businesses that
world in 2020. are unlikely to survive the COVID-19 crisis due
to changes in the production and consumption
The main challenge for Vietnam will be to find new structure of the economy. In that case, it would be
drivers that will support the expected recovery in preferable to assist those entrepreneurs or workers
the short to medium term. Over the past decade, to convert to more productive activities.
the Vietnamese economy mainly relied on the rapid
expansion of its exports and of local consumption. Looking ahead, Vietnam’s economic outlook is not
These two drivers are not expected to return to immune to risks. The speed of the recovery will be
their precrisis levels in the immediate future given influenced by the health and economic conditions
the continued uncertainties in the domestic and in the rest of the world. The foreign sector, which
international context. has been the traditional driver of growth, is unlikely
to run at full speed soon (especially if cross-border
To accelerate the short-term recovery of the passenger travel remains restricted). Capital
economy in the aftermath of the COVID-19 crisis, inflows and remittances could also decline further
the government should act on three complementary than anticipated in a depressed environment. There
lines of actions. The first will be to consider are also several domestic risks that will require
removing mobility restrictions on domestic to attention, notably those associated to fiscal and
international travel, starting with other COVID-19 monetary policies. While the government should
safe countries. The objective would be to enhance act decisively to jump start the recovery, such
tourism activities, which account for about 10 support should be short-lived and well targeted to
percent of GDP in Vietnam. Such action will also reduce the risk of excessive borrowing over time.
be important to attract potential investors and
Taking Stock July 2020 xiiiSimilarly, the easing of monetary and credit and collective behaviors toward the more
conditions by the State Bank of Vietnam (SBV) could responsible management of the country’s natural
result in a spike in inflation. The extension of credit resources.
by commercial banks to businesses in difficulty
will most probably increase the proportion of Among the biggest challenges for Vietnam will be
delinquent loans in their portfolios and, potentially, to prevent the surge of inequalities as the impact
lead to significant losses. Overall, these risks are of COVID-19 appears diverse across businesses
manageable considering the relatively good health and people. Indeed, some sectors have been more
of the public and financial sectors at the beginning affected by restrictions, while others have emerged
of the crisis, but they will require close monitoring stronger from the lockdown. Many white-collar
by the authorities. employees whose jobs can be done from home have
received full pay, while low-wage, frontline workers
Transforming the crisis into an opportunity have seen their earnings fall and unemployment
rise.
Almost all cultures have integrated the concept that
opportunities may arise from a crisis. In China, it is These differentiated impacts not only have an
embedded in the graphology of the world “crises” influence in the short term, but they can also
that contains two signs, including one capturing shape future patterns in the job market and the
opportunity. In the Western world, this duality was way businesses operate in Vietnam. In the last few
best expressed by the quote attributed to Albert decades, Vietnam has been successful in almost
Einstein who said that “in the midst of every crisis, eradicating extreme poverty by creating industrial
lies a great opportunity.” jobs and sharing the fruits of growth. Looking ahead,
these gains will need to be preserved by ensuring
The COVID-19 crisis has offered a unique that Vietnamese will continue to have access to
opportunity for Vietnam. The country can build on productive jobs by upgrading and adapting their
several megatrends to consolidate its footprint skills to the new demand from enterprises. The
in the global economy and to enhance its policy government should also design and implement a fair
reform agenda, notably by improving services and effective redistributive policy, notably through
delivery through digitalization. The greater reform of the tax system, which has become even
attention given to human life should also help more pressing in the new post-COVID-19 era.
generate the much-needed changes in individual
xiv What will be the new normal for Vietnam?Taking Stock July 2020 xv
xvi What will be the new normal for Vietnam?
I N T R O D U CT I O N

C
              OVID-19 has spread around the planet, killing hundreds of thousands of people and sending
              billions into lockdown, as health services struggle to cope. Yet, as of early July 2020, Vietnam
              is privileged to belong to a small club of countries that have reported zero deaths caused by
              the pandemic. This result is even more impressive considering that the country is located
              next to China (the epicenter of the pandemic) and is one of the most open economies in the
world, hosting almost 20 million international visitors every year. The extraordinary management of the
health crisis by the government, through the combination of bold and decisive actions as well as smart
testing and tracking, has received deserved attention from local and international media even though the
country remains at risk of new COVID-19 waves as recently reported in other countries in the world.1

The objective of this edition of Taking Stock is to discuss to what extent the COVID-19 pandemic
has affected the Vietnamese economy. While a close correlation should be expected between health
and economic gains, this link is not automatic, as a country could report few COVID-19 cases but face
serious economic damage because of restrictions and a heavy dependence, for example, on tourism and
remittances.2 In Vietnam, while the government’s strategy has provided great health benefits, it has come
with economic costs, since GDP growth dropped by more than 5 percentage points in the first semester of
the year compared to precrisis projections. Furthermore, recent estimates by the government indicate that
as many as 30 million workers, or over half of the labor force, could have been affected by the crisis. The
following set of questions are therefore examined in the report:

yy What has been the impact of the COVID-19 pandemic on Vietnam’s economy during the recent months?
yy What have been the main channels of transmission of the COVID-19 crisis on the domestic economy
   and who have been the main financial victims?
yy To what extent has the health strategy followed by the government, with bold and rapid social distancing
   measures, been justified from an economic point of view?
yy What are the short- to medium-term prospects for the Vietnamese economy and what kind of policies
   could accelerate the economic recovery in the post COVID-19 era?

1   Vietnam’s success in controlling the pandemic has been praised by most international media; see, for example, CNN
    at https://www.google.com/amp/s/amp.cnn.com/cnn/2020/05/29/asia/coronavirus-vietnam-intl-hnk/index.html.
2   For a discussion on the difference between the health and economic crisis brought on by the COVID-19 pandemic
    at the international level, see Noy et al. (2020.)

                                                                                        Taking Stock July 2020          1
We find that the Vietnamese economy has shown considerable resilience to the COVID crisis – much better
than most countries in the world. However, the road to recovery can still be bumpy due to the remaining
and large uncertainties in both the domestic and global environment. The impact of the crisis has also not
been uniform, raising inequalities across sectors and among people. The government has a key role to play
as the COVID-19 crisis offers a unique opportunity to strengthen its policy reforms agenda and so propel
Vietnam toward its goal of becoming a high-income economy in the future.
The report has four sections. The first sets the stage by briefly describing how the COVID-19 pandemic
has changed the world economy, building on the World Bank’s June 2020 Global Economic Prospects
report. The second section emphasizes how Vietnam has not only managed the health crisis exceptionally
well but has also coped with the economic consequences. The third section discusses what the short- to
medium-term prospects are for the Vietnamese economy, exploring how to jump start and maintain the
recovery in a weak and uncertain global environment. The fourth and last section examines how Vietnam
can build on various megatrends emerging in the global economy to accelerate the implementation of its
policy agenda and become a high-income economy in the longer term.
2 What will be the new normal for Vietnam?COVID-19 IN THE WORLD
O
n December 31, 2019, Chinese health officials informed the World Health Organization
(WHO) about a cluster of 41 patients with a mysterious pneumonia. Most were connected
to the Huanan Seafood Wholesale market, a wet market in the city of Wuhan. This was the
beginning of what was subsequently labeled the COVID-19 pandemic. Seven months later, it
is estimated that approximately 550,000 people have died and 10 million cases have been
confirmed in more than 200 countries worldwide.3 While this pandemic has already been more deadly than
the 2003 SARS coronavirus and the 2009 and 2010 swine flu pandemics together, the number of deaths has
not yet reached the figures reported during the 1957–58 Asian flu or the Hong Kong flu pandemics, when
an estimated 1 million people died each time.
The impact of COVID-19 has been particularly brutal on the global economy due to the combination of
health and preventive measures taken to control the pandemic. The stricter the public health measures,
the bigger will be the short-term blow to the economy, even if history has demonstrated that the countries
that expend the greatest effort to control a pandemic are the most likely to recover quicker in the medium
to longer term.4 The mandating of lockdowns and physical distancing by most high-income countries
has saved lives, but also explains why these economies have already reported an average contraction of
almost 1 percent in the first quarter of the year and that has most certainly aggravated during the second
quarter. These countries have faced lower domestic consumption and investment, as well as restricted
labor supply and local production. It also explains why the economic crisis has become global, even in
countries weakly affected by the health crisis, through the cross-border spillovers that have also disrupted
financial and commodity markets, global trade, supply chains, travel, and tourism. Financial markets have
been extremely volatile, reflecting exceptionally high uncertainty and the worsening outlook.
While the ultimate outcome of the coronavirus on the world economy is still uncertain, the global outlook
is somber for 2020.5 The baseline forecast by the World Bank envisions a 5.2 percent contraction in global
GDP in 2020 – the deepest global recession in eight decades (table 1). Per capita incomes in the vast
majority of emerging and developing economies are expected to shrink this year. The global recession
would be deeper if bringing the pandemic under control took longer than expected, or if financial stress
triggered cascading defaults. Beyond its short-term impact, deep recessions triggered by the pandemic are
likely to leave lasting scars through multiple channels, including lower investment, erosion of the human
capital of the unemployed, and a retreat from global trade and supply linkages. These effects may well lower
potential growth and labor productivity in the longer term. If the pandemic does not lead to lasting damage
to financial systems, growth is expected to rebound in 2021. Under the baseline scenario, COVID-19 will
push 71 million people into extreme poverty, measured at the international poverty line of US$1.90 per day.
With the downside scenario, this increases to 100 million people.6
3 Source: John Hopkins University COVID-19 dashboard; https://coronavirus.jhu.edu/map.html.
4 Correa, Luc, and Verner 2020.
5 The global figures presented in this section are based on the World Bank’s June 2020 edition of Global Economic
Prospects (World Bank 2020a); https://www.worldbank.org/en/publication/global-economic-prospects.
6 For details, see Mahler et al. (2020).
Taking Stock July 2020 3The global contraction affects all countries covered by the World Bank’s forecast. As of early July, the
prediction is that there will be only 57 countries with a positive GDP growth in 2020, down from 171 in 2019.
Almost all regions will be in negative territory, with a more pronounced decline in the Euro Area (-9.1 percent)
followed by the United States (-6.9 percent) and emerging markets (-2.1). East Asia will still grow but only by
0.5 percent – or 5.5 percentage points lower than the rate achieved by the region in 2019.
Most countries have provided large-scale macroeconomic support to alleviate the economic blow, which
has contributed to a recent stabilization in the financial markets. Central banks in advanced economies
have cut policy rates and taken other far-reaching steps to provide liquidity and to maintain investor
confidence. In many developing countries, central banks have also eased monetary policy. The fiscal
policy support that has been announced already far exceeds that enacted during the 2008–09 global
financial crisis.
Policy makers face unprecedented challenges from the health, macroeconomic, and social effects of
the pandemic as they need to reaffirm credible commitment to sustainable policies and undertake the
necessary reforms to buttress long-term growth prospects. To limit the harm, it is important to secure
core public services, maintain a private sector, and get money directly to people. This will allow a quicker
return to business creation and sustainable development after the pandemic has passed. During this
mitigation period, countries should focus on targeted support to households and essential public and
private sector services, and remain vigilant to counter potential financial disruptions. During the recovery
period, countries will need to calibrate the withdrawal of public support and should be attentive to broader
development challenges. In addition, a comprehensive reform drive is needed to reduce the adverse impact
of the pandemic on long-term growth prospects by improving governance and business environments
and expanding investment in education and public health. For these actions, global coordination and
cooperation will be critical.
4 What will be the new normal for Vietnam?Table 1. GDP growth by region, 2017–21
% point differences from
January 2020 projections
2017 2018 2019e 2020f 2021f 2020f 2021f
World 3.3 3.0 2.4 -5.2 4.2 -7.7 1.6
Advanced economies 2.5 2.1 1.6 -7.0 3.9 -8.4 2.4
United States 2.4 2.9 2.3 -6.1 4.0 -7.9 2.3
Euro Area 2.5 1.9 1.2 -9.1 4.5 -10.1 3.2
Japan 2.2 0.3 0.7 -6.1 2.5 -6.8 1.9
Emerging market and developing economies 4.5 4.3 3.5 -2.5 4.6 -6.6 0.3
Commodity-exporting EMDEs 2.2 2.1 1.5 -4.8 3.1 -7.4 0.2
Other EMDEs 6.1 5.7 4.8 -1.1 5.5 -6.2 0.3
Other EMDEs excluding China 5.4 4.8 3.2 -3.6 3.6 -7.6 -0.8
East Asia and Pacific 6.5 6.3 5.9 0.5 6.6 -5.2 1.0
China 6.8 6.6 6.1 1.0 6.9 -4.9 1.1
Indonesia 5.1 5.2 5.0 0.0 4.8 -5.1 -0.4
Thailand 4.1 4.2 2.4 -5.0 4.1 -7.7 1.3
Europe and Central Asia 4.1 3.3 2.2 -4.7 3.6 -7.3 0.7
Russia 1.8 2.5 1.3 -6.0 2.7 -7.6 0.9
Turkey 7.5 2.8 0.9 -3.8 5.0 -6.8 1.0
Poland 4.9 5.3 4.1 -4.2 2.8 -7.8 -0.5
Latin America and the Caribbean 1.9 1.7 0.8 -7.2 2.8 -9.0 0.4
Brazil 1.3 1.3 1.1 -8.0 2.2 -10.0 -0.3
Mexico 2.1 2.2 -0.3 -7.5 3.0 -8.7 1.2
Argentina 2.7 -2.5 -2.2 -7.3 2.1 -6.0 0.7
Middle East and North Africa 1.1 0.9 -0.2 -4.2 2.3 -6.6 -0.4
Saudi Arabia -0.7 2.4 0.3 -3.8 2.5 -5.7 0.3
Iran 3.8 -4.7 -8.2 -5.3 2.1 -5.3 1.1
Egypt 4.2 5.3 5.6 3.0 2.1 -2.8 -3.9
South Asia 6.5 6.5 4.7 -2.7 2.8 -8.2 -3.1
India 7.0 6.1 4.2 -3.2 3.1 -9.0 -3.0
Pakistan 5.2 5.5 1.9 -2.6 -0.2 -5.0 -3.2
Bangladesh 7.3 7.9 8.2 1.6 1.0 -5.6 -6.3
Sub-Saharan Africa 2.6 2.6 2.2 -2.8 3.1 -5.8 0.0
Nigeria 0.8 1.9 2.2 -3.2 1.7 -5.3 -0.4
South Africa 1.4 0.8 0.2 -7.1 2.9 -8.0 1.6
Angola -0.1 -2.0 -0.9 -4.0 3.1 -5.5 0.7
Memorandum items:
Real GDP
High-income countries 2.4 2.2 1.7 -6.8 3.8 -8.3 2.3
Developing countries 4.8 4.4 3.7 -2.4 4.7 -6.7 0.2
Low-income countries 5.4 5.8 5.0 1.0 4.6 -4.4 -0.9
BRICS 5.3 5.3 4.7 -1.7 5.3 -6.6 0.4
World (2010 PPP weights) 3.9 3.6 2.9 -4.1 4.3 -7.3 1.0
World trade volume 5.9 4.0 0.8 -13.4 5.3 -15.3 2.8
Commodity prices
Oil price 23.3 29.4 -10.2 -47.9 18.8 -42.5 16.9
Non-energy commodity price index 5.5 1.8 -4.2 -5.9 3.0 -6.0 1.3
Source: Global Economic Prospects, June 2020, World Bank.
Taking Stock July 2020 5THE IMPACT OF COVID-19
ON THE VIETNAMESE
ECONOMY
I
n the gloomy world of COVID-19, Vietnam appears as an exception, as it has so far managed the
pandemic with great success. This achievement has been well covered by local and international media
and many international organizations, including the World Bank.7 Table 2 provides a timeline of the main
actions undertaken by the government since the beginning of the outbreak in late January.
The economic consequences of the COVID-19 pandemic on the Vietnamese economy have received less
attention. Here, again, Vietnam has performed well in comparison to the rest of the world as demonstrated
by the following takeaways:
yy GDP has continued to expand during the first six months of 2020, albeit at a slower pace than in the
recent past.
yy Inflation has been contained despite the easing of monetary conditions by the SBV, which has led to
the expansion of credit by commercial banks to businesses.
yy The country has been able to cope with the impact of COVID-19 on its external accounts by maintaining
a trade surplus and attracting a relatively large amount of foreign direct investment (FDI) inflows even
though exports have contracted in recent months.
yy While the fiscal accounts have deteriorated due to lower revenue, the government was able to absorb
the shock, thanks to the accumulation of reserves and the use of contingent funds, limiting the use of
new borrowing.
The economy has nonetheless been hit by the COVID-19 crisis as the GDP growth rate of 1.8 percent
reported for the first semester of 2020 was the lowest of the past three decades (figure 1). This rate also
represented a 5-percentage point cut compared with the growth trajectory reported by Vietnam in recent
years. The breakdown by sectors indicates that the agroforestry-fisheries sector recorded a growth rate
of 1.2 percent and contributed 11.9 percent to the overall economic growth (figure 2), the industrial sector
expanded by 3.0 percent (equivalent to a contribution of 73.1 percent, while the services sector grew by
only 0.6 percent (or a contribution of 15.0 percent). Compared to the recent historical average, the major
negative impact was concentrated on services (its contribution was 6.3 percentage points lower than last
year), while the agriculture sector was relatively isolated, with its contribution to GDP growth constant
over time.
7 See, for example, https://blogs.worldbank.org/health/containing-coronavirus-covid-19-lessons-vietnam.
6 What will be the new normal for Vietnam?Table 2. Timeline of Vietnam’s actions in the battle against COVID-19
Date Key developments and government actions
Jan 7, 2020 New virus identified, named 2019-nCoV (then COVID-19)
Ministry of Health issued Decision No. 125/QD-BYT stipulating guidelines for diagnosis and
Jan 16, 2020
treatment of acute pneumonia caused by the coronavirus
Vietnam confirmed its first case. Health declaration compulsory for incoming travelers from
Jan 23, 2020
China after Chinese tourist tested positive in Ho Chi Minh City
Jan 23, 2020 Vietnam cancelled all flights to and from Wuhan, China
Jan 29, 2020 First Vietnamese confirmed with COVID-19 who returned to Vietnam from Wuhan
Jan 30, 2020 Government’s steering committee (headed by Deputy Prime Minister) for COVID-19 combat
set up
Feb 1, 2020 Government declared COVID-19 epidemic in Vietnam
Feb 2, 2020 14-day quarantine applied for all incoming travelers from virus-affected areas
Feb 6, 2020 All schools delayed reopening after Tet holidays
Mar 7, 2020 Medical declaration mandatory for all incoming travelers
Mar 11, 2020 The World Health Organization (WHO) declared COVID-19 a pandemic
Mar 17, 2020 State Bank of Vietnam cut policy rate by 100 basis points
Mar 18, 2020 Vietnam suspended granting entry visas to foreign visitors
Mar 21, 2020 14-day quarantine applied for all incoming travelers
Mar 21, 2020 Vietnam suspended all international flights except special and chartered flights
Mar 22, 2020 Vietnam confirmed 100th case
Mar 23, 2020 Vietnam suspended rice exports for food security reasons
Mar 30, 2020 Vietnam confirmed 200th case and closed border with Lao PDR and Cambodia
Mar 31, 2020 Government imposed social distancing (lockdown) nationwide
Apr 8, 2020 Government issued Resolution 41 to defer tax payments for firms and individuals
Government issued Resolution 42 to support vulnerable people, households, and small
Apr 9, 2020
businesses
Apr 23, 2020 Government eased social distancing but continued cross-border entry restrictions
May 1, 2020 Government resumed rice exports
May 11, 2020 All schools reopened and most economic and social activities resumed nationwide
May 12, 2020 State Bank of Vietnam cut policy rate by 50 basis points
May 14, 2020 Vietnam confirmed 300th case
July 21, 2020 Vietnam confirmed 396 infected cases of which 360 cases have been discharged. All new cases
in the last 96 days come from Vietnamese repatriated from abroad and foreigners arrived in
Vietnam. No deaths so far!
Source: World Bank.
Taking Stock July 2020 7The relative resilience of the Vietnamese economy can be explained by two successive phases (figure 3).
The first one was characterized by the good performance of the external sector. Between January and
mid-April, the value of merchandise exports increased on average by 13 percent per month, which was
in line with the country’s historical performance. Meanwhile, domestic activities were negatively affected
by the gradual implementation of mobility and social distancing measures, especially in April, when the
industrial production index and retail sales declined by approximately 20 percent each. The second phase,
which started with the easing of social distancing at the end of April, witnessed the rebound of domestic
manufacturing production – up by over 30 percent between April and June. By contrast, the value of
merchandise exports contracted by 9 percent per month between April and June. In other words, while
the Vietnamese economy has been used to running on two engines of growth in recent years, the foreign
and domestic sectors have not functioned together, but rather sequentially, since the beginning of the
COVID-19 crisis.
The slowdown in economic activity reflects to a large extent the decline in the expansion of domestic
demand during the first semester. At a time of great uncertainty, businesses and households face
cash-flow constraints and limit their investment and consumption plans. The nominal growth of total
investment slowed to 3.4 percent in the first half 2020 from 10.2 percent in the same period last year.
Private investment expansion decelerated from 16.5 percent to only 4.6 percent as many businesses have
started to face cash flow constraints and uncertainties. The state, however, accelerated the execution of
its investment projects, which grew by 7.4 percent in the first half of the year against 2.8 percent during
the same period in 2019. The proxy for household consumption – domestic retail sales – declined by 2.9
percent per month (year-over-year [y/y]) in the second quarter of 2020, after growing by only 7.9 percent
per month during the first quarter, while the average expansion rate was over 12 percent in 2019.
As the result of the slower expansion of aggregate demand, the inflation rate declined to 3.2 percent in
June 2020, down from 6.4 percent in January 2020 (figure 4). Food prices, after a significant hike at the
end of 2019, have not increased anymore but remained high due to the persistent shortage of pork (due
to swine fever) and the relatively elevated price of rice on international markets. The recent rebound of oil
prices also contributed to the upward trend of the Consumer Price Index observed in May and June.
The decline of headline inflation since the beginning of 2020 has allowed the SBV to gradually ease its
monetary policy and mitigate the impact of the COVID-19 crisis (see next section for a description). These
efforts have helped maintain credit expansion at 8.5 percent (y/y) during the first semester (figure 5).
While this rate is significantly lower than in recent years, it was more than four times faster than GDP
growth, indicating that commercial banks have extended credit to firms despite the uncertainties in the
economy. The banking system remains stable and still profitable, but uncertainty and risks of increased
default could increase financial sector stress over time. These risks can be exacerbated by the legacy of
nonperforming loans and the undercapitalization of several banks (at end-May 2020, only 18 of 45 banks
reported a Capital Adequacy Ratio in line with the Basel II requirements). With falling demand, firms and
individuals might find it increasingly difficult to meet their debt service obligations. The SBV estimated
that about 23 percent of total outstanding loans of the entire banking sector could be exposed to the
default risks associated with COVID-19. To mitigate potential risks, the SBV has granted flexibility to
banks on provisioning requirements for loans restructured due to the pandemic and extending flexibility
to borrowers on loan terms based on individual circumstances arising from the crisis.
8 What will be the new normal for Vietnam?Recent trends in Vietnam’s economy
Figure 1. Vietnam’s economic activity has slowed Figure 2. ...weighed down by lower services,
amid the COVID-19 pandemic... while agricultural output remained resilient
Quarterly GDP growth (%, y/y) Contribution to GDP growth (pp)
10
2.9 2.6 2.5 2.8 3.1 1.3
8
0.2
6
4 3.1 3.2 3.6 0.5
3.1 2.9 1.8
2
0.3
0.5 0.3 0.4 0.3 0.2 0.0
0
-2 -0.6
q4-18 q1-19 q2-19 q3-19 q4-19 q1-20 q2-20 q4-18 q1-19 q2-19 q3-19 q4-19 q1-20 q2-20
Agriculture Industry & construction Agriculture Industry & construction
Services Total GDP Services Taxes on products (net)
Figure 3. External sector growth is slowing while Figure 4. Inflation is decreasing but food prices
domestic activities are rebounding are on the rise
60
14
40
12
20 10
0 8
6
-20
4
-40 2
Apr-20
Jun-20
Seb-19
Oct-19
Nov-19
Dec-19
Jan-20
Feb-20
Mar-20
May-20
Jun-19
Jul-19
Aug-19
Jan-19
Feb-19
Mar-19
Apr-19
May-19
0
-2
-4
Index of Industrial production (IIP) 3M-average (Exports)
Jun-16 Jun-17 Jun-18 Jun-19 Jun-20
Exports 3M-average (IIP)
Headline Food Core
Figure 5. Credit expansion is decreasing… Figure 6. …while revenue collection is falling
quickly
25
20
15
10
15.1 28.2
-7.3 -22.7
5 -30.4 -33.8
0
0
20
20
20
0
0
-2
r-2
-2
n-
n-
b-
ay
ar
Ap
Ju
Ja
Fe
Jun-16 Jun-17 Jun-18 Jun-19 Jun-20
M
M
Total credit (y/y growth, %) VND trillion Change (y/y, %)
Total liquidity (M2) y/y growth (%)
Source: GSO, SBV, and MOF.
Taking Stock July 2020 9On the external front, after three successive years of improvements, the balance of payments has
certainly deteriorated, although the authorities have not yet released the level of reserves held by the
SBV since the end of March 2020. However, the external pressure should have been limited as in recent
months the country was able to improve its trade balance (reporting a surplus of US$4 billion in the first
half of 2020). The capital account has also been resilient since (disbursed) FDI inflows decreased by only 5
percent over the past six months compared with the same period a year ago. The main sources of concern
arise from the balances of services and of income, due to lower receipts from tourism and remittances;
however, the magnitude of these deteriorations is not yet known with precision. The good news is that the
level of international reserves held by the SBV was substantial at the end of March (over US$80 billion), and
the value of the local currency has been relatively stable in recent months, offering significant buffers to
absorb the impact of an external shock to the balance of payments (figures 7 and 8).
Vietnam’s trade balance improved during the first semester of the year because merchandise imports
declined faster than exports. The value of Vietnam’s total exports declined by 1.1 percent in the first
six months of 2020 compared to an increase of 7.2 percent during the same period last year (figure 9).
With the exception of computers and parts, all manufacturing exports decreased over the first semester,
including garments and smart phones, which were down by over 20 percent and 8.4 percent, respectively.
Agricultural exports were resilient due to the high price of rice on international markets even if seafood
declined by over 8 percent. In terms of destination markets, Vietnam was able to sustain exports to the
United States (up by 10.3 percent) and China (up by 17 percent) but faced weaker demand from Japan
(down by 2.3 percent), the European Union (down by 8.8 percent), and other Association of Southeast
Asian Nation countries (down by 14.2 percent) (figure 10). Concurrently, the value of merchandise imports
contracted by 3 percent (y/y) during the first six months of 2020, compared to an expansion of 8.9 percent
in the same period of 2019 (figure 11). This decrease was driven by a slower demand for imported fuel,
material, and intermediate goods. Such a decline is partly linked to the slowdown in exports, as a great
share of imported inputs are purchased by FDI firms. Finally, imports of consumer goods fells by nearly 10
percent (y/y), reflecting the decline in demand by households.
Vietnam remained an attractive location for foreign investors as (committed) FDI inflow reached close
to US$16 billion between January and June 2020 (figure 12). Yet, these inflows were 15 percent lower
than during the same period in 2019, which is line with the 20 to 30 percent decline in global capital
flows in 2020 projected by the United Nations Conference on Trade and Development (UNCTAD). Among
18 sectors receiving foreign capital, the manufacturing industry attracted the most, at more than US$8
billion, or 51.1 percent of the total, followed by electricity production and distribution (US$3.9 billion, or
25.2 percent), wholesale and retail (US$1.1 billion), and real estate (nearly US$850 million). The largest
investors were Singapore (US$5.4 billion, equivalent to 34.7 percent of the total), Thailand (US$1.6 billion,
10.1 percent), and China (US$1.6 billion, 10.1 percent).
10 What will be the new normal for Vietnam?Recent trends in Vietnam’s external sector
Figure 7. The level of international reserves Figure 8. …while the exchange has remained
increased up to end-March 2010… stable in recent months (Dong per US$)
Foreign reserves 24.000
90.0 5
4 23.750
60.0
3
23.500
2
30.0
23.250
1
0.0 0 23.000
Q1-16 Q1-17 Q1-18 Q1-19 Q1-20 Jan-20 Feb-20 Mar-20 Apr-20 May-20 Jun-20 Jul-20
Reserves (cumulative, $ bn) Import covers (month, RHS) Parallel market Central rate (SBV) Com. bank
Figure 9. Most export categories declined except Figure 10. …while foreign demand weakened,
for computers and rice (%, y/y) with the exception of China and the U.S. (%, y/y)
20 17.4
40
30 24.20 15
19.30 10.3
20 10
10 2.40 5 2.3
0
0
-10 -6.70 -8.30 -8.40
-20 -5 -2.3
-30 -21.20 -10
-26.60 -8.8
-40 -15
Co
Ric
Fur
Foo
Sea
Ph
Ga
Cru
-14.2
one
mp
rm
e
nitu
de
-20
foo
twe
ent
ute
China The US Korea Japan EU (28) ASEAN
oil
&P
res
d
ar
r&
art
par
s
ts
Figure 11. Imports contracted (%, y/y) Figure 12. FDI inflows (U.S. million, commitment)
Consumer goods
6.000
5.000
Materials and intermediate goods
4.000
Machinery and equipment 3.000
2.000
Fuel 1.000
0
9 9 0 0
Total import value n-1 g-1 t-19 -19 b-2 r-2
0 n-2
Ju Au Oc De
c Fe Ap Ju
-40 -30 -20 -10 0 10 20
Newly committed Capital expansion from
existing projects
6M-2020 6M-2019 Equity investment in local firms Implemented
Source: GSO, SBV, and Vietnam Customs office.
Taking Stock July 2020 11After three years of fiscal consolidation that helped to build significant buffers, the government has
been able to cope with the COVID-19 shock. The prudent fiscal policy followed by the authorities in the
past few years has created some fiscal space and led to the accumulation of substantial cash reserves
of about US$8 billion at the end of 2019. As a result, the government had no pressing need to borrow
from either the domestic or international markets in recent months, in sharp contrast to what has been
observed in most countries in the world. In the first six months of 2020, the Ministry of Finance issued
96.1 trillion dong (about US$4.3 billion) of T-bonds with an average maturity of 14.1 years and an average
annual coupon rate of 3 percent, which is approximately 14 percent lower than in 2019. The government
has not borrowed on the international market or requested budget support from its traditional partners.
However, the negative fiscal impact associated to the COVID-19 crisis should increase in the next few
months due to the combination of two trends. First, on the revenue side, the decline in tax collection was
generalized to almost all taxes and accelerated in the second quarter, when the government collected only
76 percent of the amount recorded during the same period a year ago (figures 6 and 13). Such decline
was explained by the slowdown in economic activity and the implementation of tax deferral measures
that are expected to continue to the end of the year. The reported increase in the personal income tax
was concentrated in the first quarter, when the authorities collected the tax returns from 2019, which was
a very good year for many individuals. Furthermore, in its effort to alleviate the financial burden on the
private sector, the government has further reduced the corporate income tax for small and medium-sized
enterprises, which may cost the budget an additional US$1 billion in the remainder of 2020.
Figure 13. Fall in almost all tax revenue, during the first semester (%, y/y)
Personal income tax 6.2
Environmental protection tax 4.2
Fees, charges and non-tax -8.7
Excise tax -14.8
Corporate income tax -15.3
Value added tax -16.1
Registration tax -18.3
Trade tax -23.3
Land and housing tax -23.4
Natural resouces tax -23.5
-30 -25 -20 -15 -10 -5 0 5 10
Source: MOF.
Second, on the spending side, total expenditure rose by an estimated 9.5 percent between the first six
months of 2019 and 2020. This increase is the combination of COVID-19-related expenses and the greater
effort to accelerate the disbursement of the public investment program.8 Such effort, which has already
led to a 19 percent increase in disbursed investment between the first six months of 2019 and 2020, is
expected to be strengthened in the coming months. It will be only partly compensated by savings on travel
and other recurrent expenditures.
8 COVID-19-related spending was estimated to amount to 15.3 trillion dong of which 4.1 trillion dong was spent on
pandemic protection and prevention (testing, quarantine, devices, and equipment) and 11.3 trillion dong disbursed
to support vulnerable people, households, workers, and firm (about 18 percent of the 62.1 trillion dong package of
Resolution 42).
12 What will be the new normal for Vietnam?Who have been the most economically affected by the COVID-19 crisis?
Beyond the macroeconomic impact of COVID-19, the pandemic has affected many businesses and people
in Vietnam. If almost everyone has been affected at one point in time, it seems that the negative effects
have been generally temporary due to the rebound of the domestic economy since the end of April. Most
family businesses – which account for the vast majority of firms operating in Vietnam – lost money during
the lockdown but were able to recover quickly because of their accumulate savings, operating flexibility and
resilience. However, the impact of COVID-19 on businesses and workers varies greatly across sectors and
locations.
Because it is relatively difficult to assess the magnitude of such impacts with precision and in real time,
four complementary sources of information have been used in this report. The first source is the Ministry
of Labor, Invalids and Social Affairs (MOLISA), which has communicated that approximately 8 million
Vietnamese workers have lost their jobs at one point in time in the last few months, while another 17
million had to cut their working hours or income. The urban unemployment rate also jumped by 33 percent,
reaching almost 4.5 percent at the end of the second quarter, and the number of businesses closures
reached almost 30,000 between January and June, which is one-third higher than recorded a year ago.9
Concurrently, the Government estimates that the average monthly revenue by worker declined by about
5 percent between the second quarter of 2019 and the same period in 2020, with a proportionally bigger
impact on services (-7.3 percent) and industries (-5.1 percent) than on agriculture (-2.9 percent) (figure
14). The magnitude of the decline appears to be linked negatively to the worker’s level of education and
has been bigger for employers and informal workers than for wage employees.10 While these figures are
relatively low by international standards, they are highly unusual for an economy that has been used to full
employment over the past 25 years.11
Figure 14: Average monthly income per person fell in the second quarter of 2020
8000 0.0%
6939
7000 6534 6429 -1.0%
Thousand Dong per month
6201
6000 5517 -2.0%
5238
5000 -2.8% -3.0%
%, y/y
4000 -4.0%
3035 2951
3000 -5.1% -5.1% -5.0%
2000 -6.0%
1000 -7.0%
-7.3%
0 -8.0%
total agriculture industries services
q2 2019 q2020 %, right handed axis
Source: GSO.
The second source is the recent household survey conducted by the World Bank in partnership with the
Government Statistical Office during the second half of June. The main results are summarized in box 1.
They indicate that approximately three-quarters of households have reported an income loss at one time
9 In addition to unemployment, it is estimated that approximately that 1.2 million persons have abandoned the job
market, with a higher proportion of women, in comparison to the second quarter of 2019.
10 For fuller details, https://www.gso.gov.vn/default_en.aspx?tabid=768&ItemID=19678
11 As a comparison, the percentage of workers expected to be laid off in Europe can be as high as 30 percent during
social distancing, which is about twice as high as in Vietman (see Bircan, Koczan, and Plekhanov 2020).
Taking Stock July 2020 13You can also read