NFA 1000 NFA 400 - Gigahertz Solutions
←
→
Page content transcription
If your browser does not render page correctly, please read the page content below
Made in Germany

    NFA 1000                        NFAsoft
                                    Analysis and
    NFA 400                         Configuration
                                    Software
    3D Low Frequency
    Analyser
    with Data Logger

Operating Manual
Version 8.8

The THREE-dimensional potentialfree E-field measurement of the NFA
1000 versus the ONE dimensional E field measurement of the NFA400
is the only significant difference between the two instruments.

© Gigahertz Solutions GmbH                                  April 2020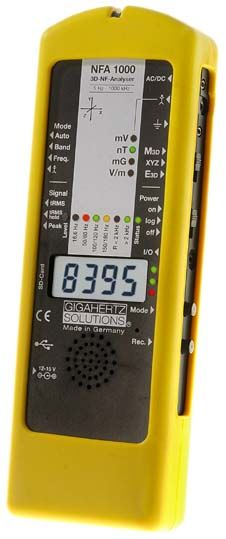
Made in Germany

Thank you!
We thank you for the confidence you have shown by buying this prod-
uct. It allows for a professional analysis of AC electric and AC magnetic
fields according to internationally recognized guidelines and the recom-
mendations of the building biology.
Technical data and specifications are to be found on our website
www.gigahertz-solutions.com.

Contents
1    Quick Start Guide                                                 1
2    NFA 1000 Front Cover                                              2
3    LEDs / Display / Audio Signals                                    3
4    Switches / Push-Buttons / Connectors                              6
5    How to Measure and Data-Log                                     12
6    Power Supply                                                    15
7    „NFAsoft“                                                       17
8    Firmware-Update                                                 24
9    What if… (FAQ)                                                  25

                  Do not wipe or touch display foil !
    After long-term recordings please charge soon in
       order to avoid – harmful – deep discharge !
                        Do not leave in the hot car !
             Protect from humidity or condensing air humidity !

This manual is based on firmware version 88 and NFAsoft version 172.
The firmware and software of the NFA will be continuously improved
and made available via download from our homepage.

April 2020                                          © Gigahertz Solutions GmbH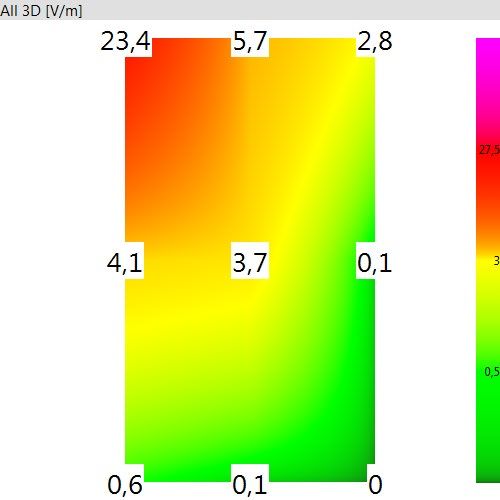
Made in Germany
1 Quick Start Guide
After switching on, the CPU boots, performs some self-tests and then
automatically starts measuring. After switching off, please do not turn it
back on while the status LED is red to allow the processor to shut
down properly.
Set all switches to their top position!
(Auto, tRMS, M3D and On)
With these settings you will achieve your first meaningful results with-
out further knowledge about the instrument.
The LCD display will now indicate the 3D magnetic field strength. The
coloured frequency LEDs above the LCD display show the comprised
frequencies. The dominant axis x, y or z is indicated by a red LED on
the right of the LCD display.
NFA 1000:
To measure the E-field with ground-reference simply connect the
grounding cable. The NFA detects the attached cable and automati-
cally shows the corresponding electric field strength and frequencies.
The ‘mode’ button toggles between this and the 3D magnetic field.
To measure the three dimensional potential-free AC electric field,
switch to E3D and fix the instrument onto a potential-free rod or onto a
support. The ‘mode’ button toggles between this and the magnetic Z-axis.
NFA 400:
For an E-field measurement, simply switch to Ey.
If the grounding cable is plugged in and connected to the
ground potential, you are measuring “against ground”.
If you attach the meter to a potential-free rod or place it onto a
support, you are measuring “potential free”.
The ‘mode’ button toggles between this and the 3D magnetic field.
For data analysis …
… unzip NFAsoft, double-click and follow intuition!
Should the meter not do what you expect…
… Please have a look the FAQs (page 26ff).
Note:
To allow a simplified freehand measurement, the meter is pre-adjusted with a 16 Hz
high pass filter for the magnetic field and a 50 Hz high pass filter for the electric field
(see page 23 for measurements from 5 Hz onwards).
© Gigahertz Solutions GmbH -1- April 2020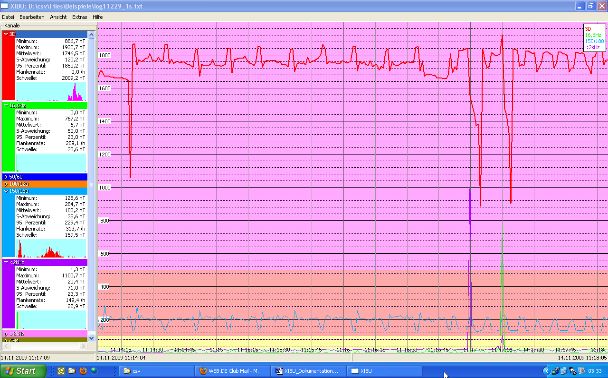
Made in Germany

2 Front Cover
Analogous front cover for NFA 1000 and NFA 400

                                   NFA 1000
                                   3D-NF-Analyser             AC/DC
                                       5 Hz - 1000 kHz
                                   Y

                                          X
                               Z

                    Mode
                    Auto                         mV
                    Band                         nT               M3D
                    Freq.                       mG                XYZ              NFA 400:   „Ey“
                      /                         V/m               E3D

                    Signal                                        Power
                    tRMS               TCO-Band     I    II         On
                    Hold                                           Log
                    Peak                                            Off

                                                                    I/O

                                                                          X
                                                                          Y
                                                                          Z

                              GIGAHERTZ                       Mode
                                                              R

                              Made in Germany
                                                                  Rec.

                    12-15 V

Technical data and specifications are to be found on our website.

April 2020                                    -2-                             © Gigahertz Solutions GmbH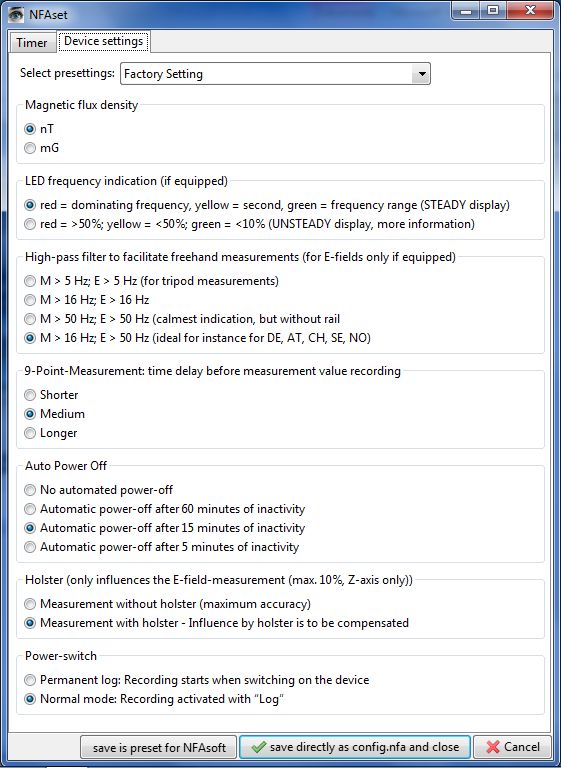
Made in Germany

3 Display / LEDs / Audio

3.1         Display and LEDs
When switched to “On”, the NFA will briefly show “bAtt” and the re-
maining battery life. When switched to “Log”, the remaining
battery life is shown cyclically with the elapsed log time and name of
the log file. After some self-tests the measurement starts automatically.
Time indications are set up as follows:
„Xd.XX“: X days and XX hours or
„XX.XX“: XX hours and XX minutes.
„XX.XX“: (with blinking dot): XX minutes und XX seconds.
1 day, 12 hours is the specified minimum logging time. The real capac-
ity can be higher, in particular with new batteries.

The unit of the reading shown on the LCD is
indicated by the adjacent green LED
                    A flashing LED indicates the unit of a secondary measure-
                    ment parameter, which can be selected by depressing the
                    “Mode>” button.
           If the LCD range for the standard unit is exceeded, the
           next higher unit is displayed, that is uT instead of nT and
           Volt instead of mV. Additionally the color of the adjacent
LED changes to red and the “x 1000”-LED is also lit red.

LEDs to indicate the applicable frequency bands:
                                                  The frequency-LEDs change their
                                                  colour (“traffic light principle”).
                                                  ”16.7 Hz“: In use for railway lines
                                                  in some European countries. The
                                                                              nd
                                                  reading also includes the 2 har-
                                                  monic.

                1
”50/60 Hz“ : Mains frequency. The bandwidth only covers the individual frequency of
50 Hz resp. 60 Hz with its lock-in range.
                    1
”100/120 Hz“ : This LED indicates the contribution of the second
through fourth “even” harmonics. The strongest frequency can be numerically dis-
played when using “Freq” mode.
                    1
”150/180 Hz“ : This LED indicates the contribution of the third through
fourth “uneven” harmonics. The third harmonics will presently be found in many homes
and most offices as a significant portion of the total measurement. The frequency of the strongest
source can be numerically displayed when using “Freq”.

1
  The NFA automatically detects the mains frequency and adjusts the indication of its
harmonics. With “Freq.” the actual mains frequency can be determined exactly. The
LED’s for 16.7 Hz, mains frequency and its harmonics up to 2 kHz have a suitable lock-
in range to cover mains fluctuations.

© Gigahertz Solutions GmbH                  -3-                                         April 2020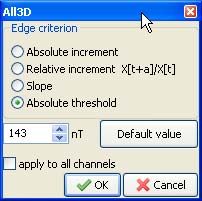
Made in Germany

”R < 2kHz“: Means “Remainder of frequencies below 2 kHz”.
This LED does not show the whole band, but only the sum of all frequencies below 2 kHz which
are not covered by the LEDs on the left.

”> 2kHz“: Comprises frequencies within the upper TCO-band of 2 KHz
up to 1 MHz.

Status LED
The “Status” LED indicates the current mode of operation
“Red” indicates special operating conditions. Do not switch off while
the Status LED is red!
“Yellow” means “measurement in progress, NO recording”.
“Green” means “measurement in progress WITH recording”,
Note: with the switch set to “Log.”, the “Status”-LED is switched off after a short while,
in order to extend battery life.

“x 1000”-LED
Turns red when the scale increases to the superior unit.

Special LCD Display Messages
“Low Batt“: Please recharge the battery a.s.a.p.
“Err.“ = short for ‘Error’: Indicates an inappropriate configuration. This
can occur when a grounding cable or mains adapter is connected AND
potential-free E-field measurement is selected.
„----“: Autocalibration in progress, processor busy, or the value is too
small to be measured reliably.
„CHAr“: Instrument is being charged.
„FULL“means: battery fully loaded or SD memory card is full.
„nbAt“:The processor cannot recognize the battery (see chapter 9)
OR the 15 V AC adapter should be disconnected (the batteries have reached
their maximum possible capacity. Storage at this capacity level is not advised)

„Sd-L“: short for SD memory card is Locked.
„Sd-F“: short for SD memory card failure“. Try re-starting the NFA or
re-formatting the memory card according to chapter 9, first paragraph.
If necessary, replace SD memory card (max. 16 GB).

April 2020                                 -4-                          © Gigahertz Solutions GmbH
Made in Germany

There are two display modes for the frequency-LEDs:
                                    2
“Simple/Steady“: (= preset)
The red LED represents the strongest frequency , and the yellow LED
the second strongest. The green LEDs indicate the total frequency
range in the current setting.

“Full Information/Volatile”: This makes the LEDs rather unsteady/vol-
atile. (To be configured with NFAsoft)
The proportion of the respective frequency band in relation to the total
                                                                   3
signal is being displayed. These proportions are shown as follows :
          RED        = DOMINANT (> 50%)
          YELLOW = MEDIUM (< 50%)
          GREEN      = SMALL (< 10%)

3.2         Audio Signal
The acoustic signal is always linked to the respective measured value
and has a „Geiger Counter” characteristic, i. e. an increasing signal in-
tensity will in turn cause an accelerated rattling sound.

If the “Mode”-switch is set to „ / “,clicks on the ‘Mode >’ button
turn up the volume and clicks on the ‘Rec. >’ button turn it down (and
finally: off), as long as no grounding cable is connected to the instru-
ment.
Please note: For extra-precise measurement requirements turn the
acoustic signal volume down or even switch it off completely.

2
  In order to allow for less fluctuations in this mode an internal high pass filter is
switched on. With NFAsoft it can be configurated to 16.7 and 50 Hz. Experience has
shown that the best combination for a freehand measurement is a filter set to 16.7 Hz
for magnetic fields and to 50 Hz for electric fields. Electric fields of the 16.7 Hz railway
line power frequency (in some European countries) are quite rare indoors and can still
be evaluated in the “band” mode. They can still be separately evaluated with NFAsoft.
3
  To make it more ergonomic for the user, frequencies below the nominal display reso-
lution (that is < 0.1 V/m or < 1 nT) are not indicated by an LED-signal but will still be
recorded down to the noise level. Hysteresis: 9/12% resp. 45/50%.

© Gigahertz Solutions GmbH              -5-                                        April 2020
Made in Germany
4 Switches / Push-Buttons /
Connectors
4.1 On / Off switch (“Power“)
“On” = Standard Measurement Setting
Allow some seconds for self-testing until measurement starts automati-
cally. LEDs and acoustic signal are activated for full information during
manual measurements. They remain activated when you start logging
by shortly switching to “Log” until the Status-LED is lit green and then
back to “On”.
“Log” = Logging / long term recording
All LEDs and the acoustic signal are deactivated in order to save bat-
tery life during data logging.
“Off” = Device is off
When turning off the device allow some seconds for shutting down its
operating system before switching it back on.
4.2 Field Selection for
3D Measurement
M3D = Magnetic field (3D)
The isotropic point or magnetic field sensors are below the Y
coordinate system printed on the meter faceplate. The domi-
X
nating axis is indicated by a red LED next to the display. Z
XYZ = Axis indication
Here, the NFA 1000 will show either the magnetic or the electric field in
its three individual components depending on the field type from which
the switch was set to “XYZ”, whereas the NFA 400 will only show the
individual components of the magnetic field. Press the ‘Mode >’ button
to switch from one axis to the other. Please see chapter 4.9 for details
to this or to the automated scrolling.
E3D(NFA1000) / Ey(NFA400) = Potential-free E-field
The field sensor pairs for the X-, Y- and Z-axis (directions correspond
to the imprint) are situated within the meter close to the housing. For a
proper measurement the meter has to be set up more than 12 inches
away from any metal objects on an insulated “holder” (accessory PM1)
or held with an insulated rod (mounting aid PM5s). Also cables or
probes must not be connected during this measurement setting. In the
April 2020 -6- © Gigahertz Solutions GmbHMade in Germany
case of an erroneous configuration, the display will indicate “Err.” until
the configuration is corrected or the setting is changed to magnetic
field measurement. The measuring person should avoid hectic move-
ments and keep a distance of at least 1.5 m to the object of measure-
ment. For potential-free E-field-measurements the highest accuracy will be reached when used
without the yellow silicone holster.
For E-field measurements against earth potential, please plug in the
grounding cable and
- switch to “M3D” (automatic adjustment) on the NFA 1000
- switch to “Ey” on the NFA 400.
4.3 Sockets for Inputs and Grounding
AC/DC = Combined AC/DC-Input
The moment you connect an external sensor, its signal
will automatically be displayed in mV and logged if
required. (“Mode” switch is set to “Auto”. Protected against
overvoltage).
AC: A displayed value of 2000 corresponds to an AC
signal of “1VRMS”.
DC: It can linearly display and log signals from +/- 0.1 to
+/- 1500mV, i.e. with an HF59B connected and set to coarse (adjust to
1V), the values recorded will be between 1µW/m² and approx. 30,000
4
µW/m². The value will be displayed in mV .
For logging RF please make sure to remember the settings of the con-
nected HF-Analyser, as they will not be registered by the NFA. You
may use the audio note feature for that.
Available options for the AC/DC Socket
Connecting cable for an HF-Analyser for data logging high-frequency
(KAB0053). Potentially falsifying LF- or RF-inductions can reliably be
suppressed by means of our suppression kit (EDY).
Electrostatic probe for measuring electrostatic charges of surfaces
(ES-NFA).
3D-magnetostatic probe for measuring the Earth’s magnetic field and
its distortions (MS3-NFA).
An AC signal being connected to the AC/DC socket will by default be
displayed as total RMS signal in CH4. For the analysis and mitigation
of dirty power it is useful to have the signal of a current sensor (“cur-
rent clamp”) to be split into the frequency ranges of the NFA (FA1). An
example for an adequate current sensor is the MiniFlex MA 200 from Chauvin Arnoux.
4
For all measurement ranges, even when using an attenuator or amplifier, NFAsoft
offers a comfortable conversion tool. The random noise will make it impossible to
properly display or record measurement values below 0.1µW/m², though.
© Gigahertz Solutions GmbH -7- April 2020Made in Germany
= Input socket for body voltage hand probe
Input for the connection of a hand probe for the measurement of body
voltage in mV. The connector is a 4 mm banana jack. For displaying
and recording, set the “Mode”-switch to / and plug in the ground-
ing cable.
This is the only input which cannot be recognized automatically (being
single-pole).
= Socket for the grounding cable
Allows the connection of a grounding cable for an E-field measurement
with reference to ground (in compliance with TCO). This will be de-
tected automatically by the instrument and the display will change to E-
field with reference to ground correspondingly.
Socket for the TCO-conformed probe at the front
end of the meter
This is for the TCO-conformed probe available as an optional acces-
sory from Gigahertz Solutions. No data logging!
4.4 Mode = Selection of
Measurement Mode
Selects all measurement and display options of the in-
strument with the field selector switch and the “Mode
Mode >” button. Configuration errors will be detected and in-
Auto dicated by “Err.” on the display until resolved.
Band
When set to the NFA recognizes probes con-
Freq. nected to it, and shows the corresponding values. If
there is no external probe connected to the instrument,
/ it will show the selected 3D field type. By pressing the
mode button, you can “toggle” between the primary
and secondary display measurements. The secondary measurement
field is indicated by a short flashing of the corresponding unit-LED.
April 2020 -8- © Gigahertz Solutions GmbHMade in Germany
and = Display of the individual fre-
5
quency bands resp. the exact frequency
Selection of the individual frequency bands is possible by clicking the
6
“Mode” button . Please see chapter 4.9 for more details on this feature
or on automated scrolling.
/ = Capacitive body coupling / volume
In this setting, the display will show the signal generated by connecting
a hand probe. The grounding cable needs to be connected in order to
assure proper measurements. For volume regulation please see chap-
ter 3.2.
4.5 Evaluation of Signal
Signal tRMS = true RMS value
tRMS tRMS = “true Root Mean Square”. The values dis-
Hold played and recorded can be compared directly to clas-
sifications recommended by building biologists.
Peak
This is the standard setting of the NFA, even for log-
ging the peak values of an HF-Analyser.
peak = Peak value
Real peak value measurement: With this setting the meter measures
7
the highest culminating point of the wave . A new, still experimental
measurement feature for building biologists which allows for a more
detailed analysis of the LF world in a way which has long since been
considered essential in the analysis of RF. This option supplies im-
portant information for the evaluation of “Dirty Power” (E-field > 2 kHz).
Hold = retain maximum value
Retains „tRMS“ or „Peak“ of the signal, depending on the switch posi-
tion from which „Hold“ was chosen. When the signal switch is set to
„Hold“ only the reading on the display is held, the real time value will
still be recorded onto the SD card, if recording.
5 An exact frequency indication is only possible up to 30 kHz.
6 If the 50 Hz high pass filter has been set with the help of the configuration part of the
NFAsoft (maybe even as pre-setting), the 16.7 Hz LED will remain unlit. However, the
filter only applies to the display in the “Auto”-mode and to loggings in the “All3D”-chan-
nel. The aim is to tranquilize the display. Nevertheless, possible frequency components
up to 16.7 Hz can be displayed by using “Band” and “Freq.”.
7
The resolution of the frequencies during the analysis of the (actually by their nature
broadbanded) peak values does not consider phase information that is being a worst-
case consideration. Tolerances are much higher than using the tRMS analysis. It can-
not be used with the floating potential E-field measurement for the time being.
© Gigahertz Solutions GmbH -9- April 2020Made in Germany
4.6 SD Memory Card
This is the slot for the SD memory card. To prevent the
card from accidentally being ejected, slide it in beyond
the external surface of the casing until it snaps (use
fingernail, if necessary). To extract it press again to
undo the snap mechanism.
Your PC will recognize the SD card as an external de-
vice when the NFA is connected by USB cable or when it is slid into a
card reading device.
Use SANDISK’s standard SDHC-cards for best performance
(max. 16 GB!).
4.7 USB Socket
USB 1.0 computer interface connection: Used for meter
configuration with NFAsoft. Please take care to have the
NFA switched off when connecting or disconnecting the
USB-cable!
Please note: for the time being the USB connection works for windows
and Linux only!
4.8 Charging Socket
15 V = charge
12-15 V
12 V = measure / log
Over the DC cables that connect the instrument with the
AC adapter, in certain situations the measurements can be falsified
through stray LF signals or RF overcoupling. There are two options to
avoid these falsifications:
the use of ferrites (of which we offer a low-cost do-it-yourself solu-
tion (“EDY”).
the use of a 12 V external battery (motorcycle gel battery (no lith-
8
ium! )), we have configurated a universal connecting cable for you
(“BAK-U”).
8
Extensive testing with classical power banks and lithium polymer batteries for flight
models showed disappointing results.
April 2020 - 10 - © Gigahertz Solutions GmbHMade in Germany
4.9 „Mode >“ and „Rec.“ - Buttons for
Navigation / Voice Recording
In connection with the “Mode”-switch (left side of the housing) and the
switch for selecting the field type, the “Mode” and “Rec.” keys form
part of the many special functions of this device.
They are not needed for a simple measurement of the 3D magnetic
field.
“Mode” = Toggle Displayed Reading or “Step ahead”
The configuration of the “Mode”-button is context sensitive:
If the “Mode”-button on the left is set to “Auto”, the NFA recognizes
external probes connected to it, and displays their corresponding val-
ues.
The “Mode >”- button toggles the display between the external
probe and M3D.
If no probe is connected to the NFA, “Mode >” toggles between
M3D and Ey or E3D and Mz, depending on your selection.
If the “Mode”-button on the left is on “Band” or “Freq.”,
Click the “Mode>” button to select the next frequency band (indi-
cated by the corresponding LEDs), and also the axis per band in
the “XYZ” mode.
Click the “Mode>” and “Rec>” buttons at the same time to display
the individual axis one after the other in an infinite loop until the
“Mode>” button is pressed again.
“Rec” = Record an audio note
Keep this button pressed and so activate the internal microphone to
accept your live comments. The microphone is positioned above the
“Rec.” button (marked by the hole in the casing lid). It is sufficiently
sensitive to pick up audio comments from a few metres distance.
While the “Rec.” button is pressed for taking your notes, these will be
recorded in a standard WAV file parallelly to logging value recordings.
These audio notes will then be directly allocated by NFAsoft to the cor-
responding recording times in the graphic.
In order to be correctly allocated by NFAsoft, the WAV files need to
be saved in the same folder as the LOG file.
© Gigahertz Solutions GmbH - 11 - April 2020Made in Germany
5 How to Measure
and Data-Log
5.1 “Live”-Measurement
Of course the meter can be used the “conventional” way: simply switch
it on, set the required measurement parameters, and read the values
recorded. When operating in the conventional mode, the “Status-LED”
will be yellow.
In addition, the device is capable of logging all settings as well as the
measurement values of all four channels at once (i.e. the three field axis
values plus one additional channel). This data is stored onto an SD-
card for future analysis. This function can be activated by temporarily
switching the “Power” switch to “Log.” until the status LED turns green.
Then switch the “Power” switch back to “On”. Please note: When log-
ging with the power switch set to ”LOG” and changing the field of
measurement and recording (for instance from M3D to E3D), this will
cause the recording session to be closed and a new log file to be cre-
ated.
These recordings can be annotated by real-time audio recordings
which will be assigned automatically to the respective measurement for
replay.
The chapters 5.2 and 5.3 are only relevant for the NFA 1000.
5.2 Guided 9 Point Measurement
of Sleeping Areas
For alternating electric fields, the guidelines issued
by the VDB e.V., Germany, require a detailed anal-
ysis of the floating potential electrical field in sleep-
ing areas, specifying nine points (three each in the
head-, torso- and foot area, with the outer edge of
the instrument located 10 cm off the bed’s edge).
The NFA in combination with NFAsoft allows for a
“guided measurement” in order to efficiently ac-
complish data collection and evaluation.
Preparation and start of the measurement:
Use a potential-free rod (mounting aid PM5s) or the holder PM1
(stabilized by, for instance, a stiff piece of cardboard or a plywood
panel).
Switch the “Power”-button to “On” and choose “E3D”, “Auto” and
“tRMS” (choose M3D for magnetic fields).
April 2020 - 12 - © Gigahertz Solutions GmbHMade in Germany
Press the “Mode”-button until 9Pt is indicated on the LCD and then
let go. A beep will indicate the activation of the 9 point measure-
ment.
The NFA guides the user through the nine points by means of short au-
dio signals (“beeps”). These nine points shall always be processed in
the same order, head area: left, middle, right, followed by torso area:
left, middle, right and finally feet area: left, middle, right.
The beeps are not time controlled but the NFA will adjust itself to
your personal work rhythm by “sensing” whether it is being moved
9
or it is lying still . This way you can finish the nine point measure-
ment within less than a minute or – if you prefer to take it a bit
slower – you need not let yourself “be rushed through the measure-
ment by the beeps”.
The algorithm is as follows: after the activation (see above) the NFA
“waits patiently” to be moved (… that is being moved to the first
measurement position: top left) and it will not beep to confirm the
next measurement before the instrument has been left still in that
10
position for a couple of seconds (… in order to pick up a valid
measurement). After the beep – and in your speed – you can pro-
11
ceed to the next measurement position .
PLEASE NOTE: In order to support this algorithm move the NFA
more or less rapidly from one measurement position to the next,
and “bump” it onto the bed’s surface with a little impact in order to
12
give the transition movement a clear end .
For an analysis of the collected data use NFAsoft.
5.3 Guided 6-Point-Measurement
of Working Places
The NFA and the NFAsoft also support the meas-
urement of working places. In this case six meas-
uring positions are to be collected, as shown in
the drawing. For a selection of the working place
measurement on the NFA keep the “Mode” but-
ton pressed until “6Pt” is displayed on the LCD.
For the further procedure follow the instructions
of the 9-Point-Measurement in the order: head,
elbow, bottom, hands, knees, feet.
9
The interval from beep to beep can vary between 3 and up to 20 seconds according
to your work rhythm and movement pattern.
10
This time delay is user-definable with NFAsoft.
11
After the beep the NFA will wait up to 20 seconds for a movement
12
This way the NFA can distinguish more reliably whether it is in motion or kept still. If
you use a potential-free rod then try not to move the instrument after you have “hit“ the
measurement point, if you use a holder then withdraw quickly to a minimum distance of
1.5 m and keep still there in order to avoid movement-induced "pseudo-fields”.
© Gigahertz Solutions GmbH - 13 - April 2020Made in Germany 5.4 Long Term Data Logging The interval for recording data is set to 10 full data sets/sec. The approach in building biology is to record only the AC magnetic field as tRMS. Recording the E-field leads to little or no additional insight but often produces confusing or meaningless results. Recording E-fields with ex- ternal power supply does not make any sense at all for obvious rea- sons. Initiating Long Term Logging of the Meter For a long-term recording of several hours or days, set the “Power” switch to “Log”. The status LED will turn green and long-term recording will start off after a few seconds. In this mode the LEDs and the sound are turned off to extend the battery life, after a while also the green sta- tus LED. Even if you only want to document a short measurement, please wait for the green status-LED to go out before turning off the NFA, because only then you can be sure that data has been recorded. The display will show the logfile number (“L…”), the elapsed time of re- cording as well as the remaining time of use in an infinite loop until the battery is empty or the SD-card full. For information on the display for- mat please see chapter 3.1. When switching back to “On”, recording will be continued without interruption. The instrument records all data corresponding to its field selection switch. The fourth channel will automatically record the E-field if the field selection switch is set to M3D and the AC/DC socket is not con- nected. However, if an HF-Analyser is connected to the AC/DC socket, it will automatically record the output of this external device. “Locking” of the Instrument “Locking” ensures that the instrument exclusively executes the prede- fined tasks when left at the customer's place for long-term recordings. To lock, remove and lock the SD memory card while the desired set- tings are active and rein-sert it. The data will still be recorded. IMPORTANT: Don't forget to “unlock” the SD memory card after finishing a “locked” long term recording! April 2020 - 14 - © Gigahertz Solutions GmbH
Made in Germany
6 Power Supply
6.1 Internal Rechargeable Battery
The instrument features high performance Lithium Ion recharge-
able batteries (2 x 3.7 V). When fully charged, they will last for at least
13
one day and 12 hours of data logging .
A vital factor for the durability of Lithium Ion rechargeable batteries is to
absolutely avoid a deep discharge and also avoid storage when
charged to a maximum. Ideal would be a loading state of around
75%.The NFA setting will prevent a deep discharge in operation, how-
ever, in view of the inevitable self-discharge, the meter should never be
kept with “almost empty” batteries.
Shelf life without deep discharge with initially ¾-full batteries:
3 to >9 Months (the big variations are caused by the varying “off-line” power
consumption of SD memory cards
>3 years with disconnected SD memory card
For longer storage the batteries should be disconnected from the in-
strument.
6.2 Charging
To charge the batteries use the 15 V AC adaptor. If the device is
switched off while charging, the display will show “CHAr” and the esti-
mated running time in the log mode with the current capacity status.
Measurements or recordings during the charging process are techni-
cally possible, but this is no specified status and thus not recommend-
able.
When fully loaded, a maximum of one day and 15 h running time will be
displayed (“1d15”). Mostly, longer times can be achieved, but this
should be considered as “hidden reserve”. Due to the large variation in
the Lithium Ion batteries supplied by their manufacturer, the maximum
capacity as well as the charging time are subject to fluctuations.
The specified battery life is already reached after a charging period of
approx. 8 hours. A (significantly) longer charging period may considera-
bly extend the battery running time.
The maximum capacity will be reached after roughly 15 hours and is in-
dicated by a “FULL” on the display.
“nbAt” on the display indicates that the 15 V AC adapter should be dis-
connected in order to save the long term battery “health”.
13
Please note that Li-Ion batteries, even when treated with care, will lose some of their
original capacity within one or two years, and their typical life expectancy is 250-500
complete charge cycles. In this case please always replace both batteries.
© Gigahertz Solutions GmbH - 15 - April 2020Made in Germany
6.3 Data Logging with
External Power Supply
You can perform this task with the supplied 12 V AC adapter.
However, unfavourable conditions may cause falsifications of the
measurement through noise, dirty power or RF over coupling. In order
to be on the safe side there are two options:
Ring ferrites attached to both ends of the respective cables avoid
these falsifications (available from us as a low-cost do-it-yourself solu-
tion “EDY”).
Another solution for avoiding these falsifications is the use of an exter-
nal 12 V battery for off-grid long-term recordings. Most suitable for
this purpose are standard gel or AGM (motorcycle) batteries (no lith-
14
ium! ). We have configured a universal adapter cable for you
(“BAK_U”).
The maximum size of a log file that can be opened with NFAsoft (1GB)
is reached after 16 days of continuous recording. The longer the log-
ging time exceeds the specified 36 hours, the higher the risk of an un-
wanted shutdown – mainly caused by the internal electronics of the SD
memory card. Longer logging times can therefore not be guaranteed.
Measuring / recording E-fields with an AC adapter or external bat-
tery connected – by physical principals – results in meaningless
data.
6.4 Battery Change
For safety reasons, please only use original battery packs classified by
us (integrated protection circuit). The two battery cells fit tightly, but
can – with some patience – easily be removed for the purpose of bat-
tery change. In no case untighten the screws of the meter! Putting the
meter together is very complicated, and therefore subject to a fee if it
needs to be done by one of our technicians.
In order to calibrate the battery life indication on the display, the
newly connected batteries need to be either charged until “FULL”
appears on the display OR discharged until the NFA switches it-
self off automatically.
14
Extensive testing with classical power banks and lithium polymer batteries for flight
models showed disappointing results.
April 2020 - 16 - © Gigahertz Solutions GmbHMade in Germany
7 „NFAsoft“
The provided software allows...
for the analysis of the data logged by the NFA
for the configuration of the NFA according to your preferences and
habits.
A double-click on the program-icon
opens the window shown on the left. Here
you can chose between the tool for the
analysis of the data and the tool for the
user-specific configuration of your NFA .
The software is subject to continuous up-
grade. The most current revision can be downloaded from our homep-
age.
System requirements
NFAsoft is made for Windows (98 and up higher). Linux and Mac ver-
sions are provided “as is”. NFAsoft requires no installation – just pull
to location of your choice, double-click and start!
In some cases, it might be necessary to temporarily disable your
anti-virus software. Anti-virus software may interpret NFAsoft as a
threat and hence might disable or even erase it. It may be necessary to
repeat this upon loading an upgraded version of NFAsoft. NFAsoft can
be loaded and executed directly form the SD memory card through a
card reader or through the USB interface cable. The NFA is supplied
with a “Class 6 SDHC”-SD memory card (appropriate readers have
been available since 2008, adapters are available for older computers).
7.1 Data Analysis: File Types
A click on the button opens the program and a Windows-
box for file selection. The following file types are available (the
consecutive numbering is independent from the file type)
LOG00001.TXT log file (long time recording)
LOG00002.9PM 9-Point-Measurement (sleeping area)
LOG00003.6PM 6-Point-Measurement (workplace)
REC00004.WAV audio file (recorded note).
7.2 Data Analysis: Longterm Recording
Double-click the appropriate log file for analysis. For longterm record-
ings the following window will open (check chapter 7.2 for 9 point
measurements):
© Gigahertz Solutions GmbH - 17 - April 2020Made in Germany
- The far left column labelled
“Channels“ displays statistic
evaluations of the plot on the
right (in real-time)
- The graph shows the col-
lected data over time.
- The “x” (horizontal) axis of
the plotted data is the time
scale and the “y” (vertical)
axis shows the units of
measurement corresponding to the field of measurement.
Plotted Data Window
Units of measurement appear on the corresponding
channel window on the left and are not indicated on
the y-axis. The different plots are colour coded. This
allows for different channels to be shown simultane-
ously.
The x-axis indicates the time span. The figures at the
left and the right end of the grey status line show the times of start and
end of the logging period.
If the status line is mouse clicked, the window on the right will appear.
Here one can enter a preferred time span to view. The time span can
also be selected in the “View” menu.
The colouring scheme of the plot corresponds to the standards for
building biology measurements (SBM2015):
Green for “no concern”.
Yellow for “slight concern”.
Red for “severe concern”.
Purple for “extreme concern”.
If one selects two channels with different units, the SBM colour scheme
of the plot’s background will be the one corresponding to the unit of
the selected (= bold) channel. It will be bold for the one and regular for
the other, equalling the markings in the “Channels” window.
Navigation within the Plotted Data
Within the plotted data you can easily navigate using a mouse and its
scroll wheel. Move the mouse pointer into the data plot. The scale of
the x-axis will be
zoomed in when scrolling up or by using the “Up Arrow”, zoomed
out when scrolling down or by using the “Down Arrow”
centered around the clock time indicated by the position of the
mouse
The data area can be repositioned on the x-axis by a left mouse click
hold and drag left or right. You may just as well use the “right” and
“left” arrows of the keyboard. Zooming of the time on the x-axis is also
possible via the “View” menu.
April 2020 - 18 - © Gigahertz Solutions GmbHMade in Germany
Scaling of the y-axis is done automatically by default but can be ad-
justed manually if desired through the “View” menu under “Y-Scale”.
You can also adapt the scaling of the y-axis manually via the menu (un-
der “View / Scale”).
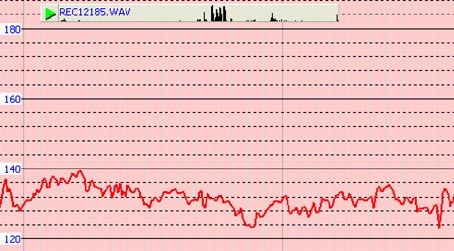
Listening to the Audio Notes
Audio notes dictated
during measurement or
longterm recordings are
shown in the diagram di-
rectly at the correspond-
ing point of dictation.
Simply click on them in
order to listen to the in-
formation recorded. The
audio notes will be
played back by the audio player of your computer. The grey bar on the
top will show the file name and a level preview.
A display of the audio files (.wav) within the diagram is only possible if
they are stored in the same folder as the LOG-file and if they are not re-
named.
Insert Comments directly into the Diagram
Areas of special interest can be commented directly in the plotted data.
Simply position your mouse where you need it, right click and enter
your comments in the comment window. When you click Ok, the com-
ment will be embedded into the data, marking an event or section of in-
terest. .
Program Window “Statistics Channels”
To display the data of a particular channel, click the triangle to the left
of the channel.
If multiple channels are open, an additional click on the channel infor-
mation will bold the channel’s plotted data and its statistical data.
15
The top five values are standard statistical values . The numerical
value “Edges per hour” is used to analyse the number of steeply rising
edges, spikes, peaks, pulses, sharp bursts or high frequency transients
of the field. The edge thresholds can be defined in the “Channel” menu
under “Set edge criteria”. This is an experimental function. PLEASE
NOTE: If the 50 Hz high pass filter has been set with the help of the
configuration part of NFAsoft (maybe even as pre-setting), this only ap-
plies to the channels “All3D”, “AllX”, “AllY”, and “AllZ”. Nevertheless,
possible frequency components at 16.7 Hz will also be recorded in the
correspondent channel. In this case the sum of the frequency specific
channels may well be higher than that of “All3D”.
The light-blue field underneath the statistical channel data represents
the frequency distribution of the measured intensities of the specific
15
The 95th percentile is calculated heuristically. If the possible deviation ex-
ceeds 10%, it will be noted in parenthesis after the figure in absolute terms.
© Gigahertz Solutions GmbH - 19 - April 2020Made in Germany
channel („Histogram“). It is self-scaling and can be interpreted as fol-
lows:
On the left side of the x-axis a formula calculates and plots how of-
ten the minimum value has occurred in a given time interval, and
similarly on the right side for the maximum value.
The higher point marks the measured intensity - found most often.
The lower points indicate a specific value very seldomly measured.
Menu
Edit
“Copy all“: Copies the plotted data area as well as the drop-down of
the “Statistics/Channels“ section into the buffer – from here it can be
inserted directly into your measurement protocol at any point of your
choice. This is similar to a screen shot. All other edit options are self-
explanatory.
View
“Edge Display”
Select the menu option “View/Edge Display” to activate the edge dis-
play (displayed as “bar” above the graph). The edge display option will
help find important field strength fluctuations. Steep edges are marked
in the diagram in the colour corresponding to each channel – the
marked channel will be bolded, the others won’t. This way you will al-
ways have an overview of what’s going on in the other channels, even if
your focal point is, for instance, the 3D-value. The threshold value for
an edge display can be defined in the menu option “Channel/Set edge
criteria”.
“Set Times”
Select the “Set Times“ option to scale the graphic to a defined time
segment.
“Y-Scale“
Automatic – The y-axis will be scaled automatically to give the best
display of the area selected for analysis.
Manual – The y-axis scaling can be manually controlled in this
mode. Allows for and will assist in analyzing small values (e.g. those
over 2 kHz) overshadowed by other very strong field intensities.
“All” – zooms out the x-axis and displays the complete data set on the
data plot. The keyboard “A” keys can alternatively be used.
Use the arrow keys to take over the functions of the mouse.
April 2020 - 20 - © Gigahertz Solutions GmbHMade in Germany
Channel
Set Edge Criteria (experimental!)
This feature is new and its intention
is to facilitate professionals the dis-
cussion and analysis of “dirty elec-
tricity” beyond today’s definition. Ac-
tivate “Edge Display” in the menu
option “View” to use this function.
This function allows you to define a
threshold value with which a spike
can be marked directly in the “Edge
Display” of the plot. This threshold
can be selected individually for every
channel. Standard values have been
pre-selected as defaults.
When clicking “Set edge criteria”, the above window will open.
Absolute increment = Marks a rise of the measured field intensity be-
tween adjacent points of time by a user defined absolute increment
level in V/m, mG or nT
Relative steepness = Marks a rise of the measured field intensity be-
tween adjacent points in time by a user defined factor or multiple.
Slope = Marks a rise of the measured field intensity between adjacent
points in time by a user defined slope rate in V/m, mG or nT per sec-
ond. This is independent of the measuring intervals. A hypothetical in-
terval of 1 second would give that increment. This permits to compare
results recorded with different recording intervals.
Absolute threshold = Marks a rise of the field intensity between adja-
cent points in time by a user defined threshold level in V/m, mG or nT.
Any rise beyond this absolute threshold value will be marked.
The selected edge criteria will be graphically displayed on the top of
the plotted data section and will appear numerically in the field channel
statistical data section under edges per hour for that particular time
span. All edge markings displayed appear in real time and allow for a
quick visual analysis.
When clicking the „ok“ button, the selected criteria and the set value
will be transferred into the statistical values of the channel. When re-
accessing the menu option “Set edge criteria”, the pre-set values will
again be displayed (under construction).
Select HF-Unit
This function will only be displayed when selecting “CH 4” in the
“Channels” window and the data recorded in this channel are those of
an external input device such as an HF-Analyser (and are therefore rec-
orded in mV).
Upon selection of this point of the
menu the window shown on the
right will open up for a selection
of the HF-Analyser settings during
the recording period.
© Gigahertz Solutions GmbH - 21 - April 2020Made in Germany
For a conversion to mV/m:
Right click with the mouse into the opened channel "HF" and select
"µW/m² => mV/m" at the very bottom of the following dialog box in or-
der to generate this new channel!
nT mG
This function allows to subsequently convert a chosen channel’s data
from milliGauss to nanoTesla and vice versa.
Convert Units (Experts only!)
Provided “as is” for potential special applications.
Rename or Delete Channel
Allows for a renaming or deleting of the marked channel.
Summarise Channels
The plotted channels (selected on the left) will be added up (“square
sum“) and added as a new channel. The sum of 100/120 Hz, 150/180
Hz, R2kHz are considered to be the relevant parameters
for the evaluation of “dirty electricity”.
Extras
Create KML-File
Required for the connection of NFA logs with GPS-data and Google
Earth. If interested, we will be glad to forward English documentation to
this subject. However, we cannot supply any further support.
7.3 Data-Analysis: 9-Point-Measurement /
6-Point Measurement
For a graphical illustration of a recorded 9-point measurement, please
use NFAsoft and select the respective file with the extension “.9PM”.
The illustration is frequency specific. Please note that the readings of
the channels X, Y and Z as well as “All CH4” are dependent on the po-
sition of the instrument and that the graphical illustration is for orienta-
tion purposes only. “Edit” in the menu offers you the possibility to copy
the illustrations into your report, also individually. The evaluation of the
6-Point-Measurement is done analogous to the 9-Point-Measurement.
April 2020 - 22 - © Gigahertz Solutions GmbHMade in Germany
7.4 User-specific Configuration of the NFA
The selected settings can be saved on the SD card as „CON-
FIG.NFA“. The NFA will then automatically load them upon its
restart. Please note that it is not possible to read the file in or-
der to verify the selected settings of the NFA.
Several customized pre-settings for NFAsoft can be defined allowing a
quick access. Simply select the settings as required and activate the
button “save as pre-setting for NFAsoft”. All pre-settings are stored in
the file “NFAsoft.ini” and are available for NFAsoft provided that this file
is in the same folder.
For a synchronization of the time, connect the NFA (with SD card!) to
the computer with the USB cable. Synchronization happens automati-
cally, as soon as “CONFIG.NFA” is saved to the SD card. If a larger
time lag persists, only a new SD card will help (simple SDHC from
SANDISK with a maximum of 16 GB, even a re-formatting usually does
not provide a solution. The SD cards are unfortunately the main cause
of error in the NFA).
If the high pass is set at 50 Hz, this only refers to the broad band read-
ing or recording as it reduces the influence of movement induced field
© Gigahertz Solutions GmbH - 23 - April 2020Made in Germany
components. For full information, the frequency components of sinus-
oidal waves at exactly 16.7 Hz are still recorded separately and can be
shown with the help of the NFAsoft.
If the filter is set, it is therefore not unusual for the summary indication
“All3D” to be smaller than the indication for 16.7 Hz, as the signal com-
ponents at 16.7 Hz are not integrated in the total sum of “All3D”.
Furthermore, the signals of the different frequencies are added up
quadratically, which in turn means that the result of simply adding the
individual signals will also differ from the sum of “All3D”. (For more in-
formation on this matter see chapter 9).
8 Firmware Update
16
The firmware is the meters operating system and stored in its CPU . If
you keep the “Mode”-key pressed while switching on the meter, you
will be shown the currently active firmware revision number.
The most up-to-date revision can always be downloaded from our
homepage (menu item “Downloads”).
Procedure for the Update:
Download the respective zip-file from our homepage. Unzip and copy
the new “FIRMWARE.NFA“-file onto your SD memory card without
changing the name. If need be, overwrite any old versions on the card, as only one
“FIRMWARE.NFA“-file should be on the card. It should NOT be renamed. It can be de-
leted from the card after the update.
Lock your SD memory card with the small switch on the left side of the
card. Insert SD card into your powered-off NFA. Switch on your NFA.
The display will show “CodE”, the frequency LEDs will gradually
change from green to red during the update process. Then all LEDs will
turn off except for the status LED. As soon as the status LED turns
green, the update process is completed (this will take a few seconds
only).
Do not use any switches and especially do not switch off
the meter during the update process!
Don’t forget to unlock the SD-card afterwards!
16
Please differentiate: With „NFAsoft“ the firmware can be configured and the user set-
tings stored in the file „CONFIG.NFA“. This has nothing to do with the firmware itself.
April 2020 - 24 - © Gigahertz Solutions GmbHMade in Germany
9 What if… (FAQ)
Before you continue reading…
Make sure to be using the most current firmware version 17!
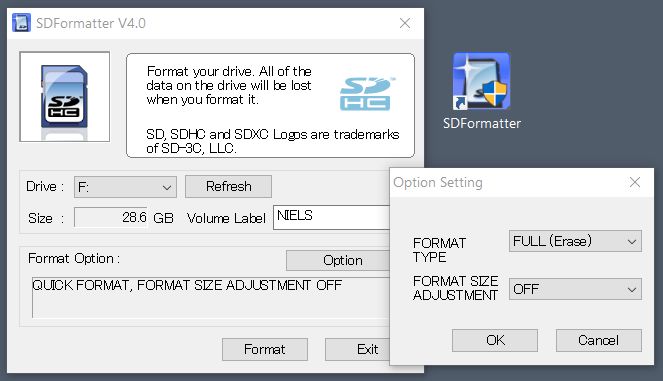
Reformatting the SD memory card is the most effective remedy
in the case of malfunctioning of the NFA. Please save your data
and use the original tool published by the
SD Association: https://www.sdcard.org/downloads/index.html. Set-
ting:
please note: take
care to choose the
correct drive!
The device does not react to switching or pressing a key
Unlock SD memory card! (micro switch on the left of the card)
Re-format the SD memory card
Restart: All switches up – switch off – wait some seconds – switch
on again.
RESET: Switch off meter, open battery compartment, disconnect
one of the battery plugs, reconnect the battery after at least one
minute (the longer the better), and switch the meter back on (im-
portant hints in chapter 6.4).
There is no recording possible (status LED does not turn green)
Insert or unlock SD memory card!
Re-format your SD memory card (see above).
Special Display Messages are explained in chapter 4.
The log file has 0 kb and contains no data
Unfortunately nothing can be done about this retrospectively.
In order to avoid this in future…
… Delete all 0 kb files from the SD memory card on a regular basis.
… Re-format your SD memory card (see above),
… After switching off, wait at least until the red Status-LED goes
out before switching it on again,
… Avoid ultra-short logs! Log for at least 10, better 30 seconds.
17
The preliminary Firmware of NFA serial numbers below …0282 cannot be
updated (new bootloader).
© Gigahertz Solutions GmbH - 25 - April 2020Made in Germany
A small vertical “Low Batt” indication appears on the display
This is an additional information for the user and is shown once less
than 4-8 hours of battery life time are remaining.
An intermittent “Low Batt” indication can be ignored
(temporarily increased power consumption due to internal processes).
The meter turns off after quarter of an hour
The auto-power-off interval can be changed in NFAsoft.
(Auto-power-off is automatically deactivated while recording).
Time offset in the records See page 23.
E-field measurement against ground potential
is not possible
The field type switch must be switched to “M3D”. Now you will
automatically be shown the E-field vs. ground potential once you
insert a grounding cable. Please see the “quick start guide” at the
beginning of this manual for further information.
The meter has four measurement channels which always work simultaneously. Three of
them are needed for the 3D measurement, the fourth channel can be used for any other
required measurement task.
The sum of the frequency specific channels is higher than the
value of “All3D”
The signals of the different frequencies are added up quadratically
(square root out of the sum of squares), which means that a sim-
ple addition of the individual signals will result in a higher value
than the sum of “All3D”. For example, if you take 500 nT at 16.7
Hz plus 1000 nT at 50 Hz, a simple addition will amount to 1500
nT, whereas the quadratical addition (= “All3D”) will amount to
only 1118 nT.
The 16.7 Hz LED is off although measurements with “Band” or
“Freq.” show values in this frequency
If the 50 Hz high pass filter has been set with the help of the config-
uration part of NFAsoft (maybe even as pre-setting), the 16.7 Hz
LED will remain unlit. However, the filter only applies to the DIS-
PLAY in the “Auto” mode and to recordings made in the “All3D”
channel. The aim is to tranquilize the display. Nevertheless, the de-
vice may well identify possible frequency components at 16.7 Hz
when using “Band” and “Freq.”.
April 2020 - 26 - © Gigahertz Solutions GmbHMade in Germany
NFAsoft is showing measurement values at 16.7 Hz in spite of the
50 Hz high pass filter being set AND the sum of the 16.7 Hz chan-
nel and the other channels is higher than the value of “All3D”
If the 50 Hz high pass filter has been set with the help of the con-
figuration part of NFAsoft, this only applies to the channels
“All3D”, “AllX”, “AllY”, and “AllZ”. Nevertheless, possible fre-
quency components at 16.7 Hz will also be recorded in the corre-
spondent channel. In this case the sum of the frequency specific
channels may well be higher than that of “All3D”.
The NFA was configurated according to customer require-
ments with NFAsoft, but when restarting, NFAsoft shows
the original settings
The “CONFIG.NFA” file on the SD-card transfers user-specific
configurations to the NFA. NFAsoft can write this file, but not read
it. Therefore you cannot use NFAsoft to check the configuration
of the NFA, but only to instal new configurations.
You can save frequently used configurations as
presets to a dropdown menu in NFAsoft.
What is the purpose of the individual files and where are they
saved?
“CONFIG.NFA” -> user configurations of the NFA-> saved on the
SD-card
“NFAsoft.ini” -> Presettings for NFAsoft ->
saved in the same folder as NFAsoft
“FIRMWARE.NFA” -> operating system of the NFA -> in the pro-
cessor of the NFA (only temporarily for updates
it needs to be saved to the SD memory card)
9-Point-Measurement of the electric field (“E3D”)…
… in an (almost) field-free area: the indication of the dominant
frequency is unpredictable.
In fields of minimal values the indication of the dominant fre-
quency is a matter of pure stochastic
… in an (almost) field-free area there is still a reading on the LCD
The function “Peak” does not work in combination with “E3D”.
When using a telescopic rod, a reading may well be caused by
either movement-induced fields or alternating electrostatic
fields from your contact with the rod.
Solution: The configuration part of NFAsoft allows to set the
high pass filter at 16 Hz or 50 Hz. This will suppress most of
these “pseudo fields”, the 50 Hz filter of course more so than
© Gigahertz Solutions GmbH - 27 - April 2020You can also read