NIBC Bank Additional Tier-1 Investor Presentation - September 2017

Page created by Glen Bowers
 
CONTINUE READING
NIBC Bank Additional Tier-1 Investor Presentation - September 2017
NIBC Bank
Additional Tier-1 Investor Presentation

September 2017
NIBC Bank Additional Tier-1 Investor Presentation - September 2017
DISCLAIMER
This document is only provided for information purposes and does not constitute, nor must it be interpreted as, an offer to sell or exchange or acquire, or an invitation for offers to buy securities in any
jurisdiction where, or to any person to whom, it is unlawful to make such an offer or sale. Any decision to buy or invest in securities in relation to a specific issue must be made solely and exclusively on
the basis of the information set out in the relevant offering circular filed by the Issuer in relation to such specific issue. Nobody who becomes aware of the information contained in this report must
regard it as definitive, because it is subject to changes and modifications. The Issuer makes no representation or warranty, express or implied, as to the accuracy or completeness of the information
contained herein.
This document contains or may contain forward looking statements regarding intentions, expectations or projections of NIBC Bank N.V. or of its management on the date thereof, that refer to
miscellaneous aspects, including projections about the future earnings of the business and involve significant elements of subjective judgment and analysis that may or may not be correct. The statements
contained herein are based on our current projections, although the said earnings may be substantially modified in the future by certain risks, uncertainty and others factors relevant that may cause the
results or final decisions to differ from such intentions, projections or estimates. These factors include, without limitation, (1) the market situation, macroeconomic factors, regulatory, political or
government guidelines, (2) domestic and international stock market movements, exchange rates and interest rates, (3) competitive pressures, (4) technological changes, (5) alterations in the financial
situation, creditworthiness or solvency of our customers, debtors or counterparts. These factors could condition and result in actual events differing from the information and intentions stated,
projected or forecast in this document and other past or future documents. NIBC Bank N.V. does not undertake to publicly revise the contents of this or any other document, either if the events are
not exactly as described herein, or if such events lead to changes in the stated strategies and intentions. The contents of this statement must be taken into account by any persons or entities that may
have to make decisions or prepare or disseminate opinions about securities issued by NIBC Bank N.V. and, in particular, by the analysts who handle this document and any recipient thereof should
conduct its own independent analysis of the Issuer and the data contained or referred to herein. This document contains summarised information or information that has not been audited, and its
recipients are invited to consult the documentation and public information filed by NIBC Bank N.V. with stock market supervisory bodies, in particular, the offering circular and in any periodical
information.
The securities referred to in this document have not been and will not be registered under the U.S. Securities Act of 1933, as amended and are not to be offered or sold in the United States or to, for
the account or benefit of, U.S. persons absent registration or an exemption from registration under such Act. The Issuer does not intend to register any portion of the proposed offering under the
applicable securities laws of the United States or to conduct a public offering of any securities in the United States.
This document is only being distributed to and is only directed at (i) persons who are outside the United Kingdom or (ii) to investment professionals falling within Article 19(5) of the Financial Services
and Markets Act 2000 (Financial Promotion) Order 2005 or (iii) high net worth entities, and other persons to whom it may lawfully be communicated, failing within Article 49(2)(a) to (d) of such Order
(all such persons together being referred to as "relevant persons"). Any investment activity to which this communication may relate is only available to, and any invitation, offer, or agreement to engage in
such investment activity will be engaged in only with, relevant persons. Any person who is not a relevant person should not act or rely on this document or any of its contents. The information in this
presentation is given in confidence and the recipients of this presentation should not engage in any behaviour in relation to qualifying investments or related investments (as defined in the Financial
Services and Markets Act 2000 (FSMA) and the Code of Market Conduct made pursuant to FSMA) which would or might amount to market abuse for the purposes of FSMA.
This document is only being distributed to and is only directed at (i) persons outside the European Economic Area (EEA) or (ii) persons in member states of the EEA who are "qualified investors" within
the meaning of Article 2(1)(e) of the Directive 2003/71/EC (as amended).

                                                                                                                                                                                                            2
NIBC Bank Additional Tier-1 Investor Presentation - September 2017
DISCLAIMER (Cont’d)
The securities referred to in this document (the Capital Securities) are complex financial instruments and are not a suitable or appropriate investment for all investors. In some jurisdictions, regulatory
authorities have adopted or published laws, regulations or guidance with respect to the offer or sale of securities such as the Capital Securities to retail investors.
In particular, in June 2015, the U.K. Financial Conduct Authority (the FCA) published the Product Intervention (Contingent Convertible Instruments and Mutual Society Shares) Instrument 2015 (as
amended or replaced from time to time, the PI Instrument), which took effect from 1 October 2015. Under the rules set out in the PI Instrument (as amended or replaced from time to time, the PI
Rules):
      (a)    certain contingent write-down or convertible securities (including any beneficial interests therein), such as the Capital Securities, must not be sold to retail clients in the EEA; and
      (b)    there must not be any communication or approval of an invitation or inducement to participate in, acquire or underwrite such securities (or the beneficial interest in such securities) where
             that invitation or inducement is addressed to or disseminated in such a way that it is likely to be received by a retail client in the EEA (in each case, within the meaning of the PI Rules), other
             than in accordance with the limited exemptions set out in the PI Rules.
The Managers (and/or their respective affiliates) are required to comply with the PI Rules. By purchasing, or making or accepting an offer to purchase, any Capital Securities (or a beneficial interest in
such Capital Securities) from the Issuer and/or the Managers, each prospective investor will be deemed to represent, warrant, agree with, and undertakes to the Issuer and each of the Managers that:
      (a)    it is not a retail client in any jurisdiction of the EEA (as defined in the PI Rules);
      (b)    whether or not it is subject to the PI Rules, it will not:
             (i) sell or offer the Capital Securities (or any beneficial interest in such securities) to retail clients in any jurisdiction of the EEA; or
             (ii) communicate (including the distribution of this Prospectus) or approve an invitation or inducement to participate in, acquire or underwrite the Capital Securities (or any beneficial
                 interests therein) where that invitation or inducement is addressed to or disseminated in such a way that it is likely to be received by a retail client in any jurisdiction of the EEA (in each
                 case within the meaning of the PI Rules),
             in any such case other than (i) in relation to any sale of or offer to sell Capital Securities (or any beneficial interests therein) to a retail client in or resident in the United Kingdom, in
             circumstances that do not and will not give rise to a contravention of the PI Rules by any person and/or (ii) in relation to any sale of or offer to sell Capital Securities (or any beneficial
             interests therein) to a retail client in any EEA member state other than the United Kingdom, where (a) it has conducted an assessment and concluded that the relevant retail client
             understands the risks of an investment in the Capital Securities (or any beneficial interests therein) and is able to bear the potential losses involved in an investment in the Capital Securities
             (or any beneficial interests therein) and (b) it has at all times acted in relation to such sale or offer in compliance with the Markets in Financial Instruments Directive (2004/39/EC) (MiFID)
             to the extent it applies to it or, to the extent MiFID does not apply to it, in a manner which would be in compliance with MiFID if it were to apply to it; and
      (c)    it will at all times comply with all applicable laws, regulations and regulatory guidance (whether inside or outside the EEA) relating to the promotion, offering, distribution and/or sale of the
             Capital Securities (or any beneficial interests therein), including (without limitation) any such laws, regulations and regulatory guidance relating to determining the appropriateness and/or
             suitability of an investment in the Capital Securities (or any beneficial interests therein) by investors in any relevant jurisdiction.
Where acting as agent on behalf of a disclosed or undisclosed client when purchasing, or making or accepting an offer to purchase, any Capital Securities (or any beneficial interest in such securities)
from the Issuer and/or the Managers, the foregoing representations, warranties, agreements and undertakings will be given by and be binding upon both the agent and its underlying client.
Distribution of this document in other jurisdictions may be prohibited, and recipients into whose possession this document comes shall be solely responsible for informing themselves about, and
observing any such restrictions. By accepting this document you agree to be bound by the foregoing restrictions.

                                                                                                                                                                                                                3
Table of Contents

Transaction Overview: Investment Thesis                                      5

1. NIBC: Moving Ahead
   Overview                                                                  6
   Rating and Capital                                                        12
   Objectives                                                                14
2. Transaction Details                                                       16

Appendix I               Mortgage Reclassification: expected IFRS 9 impact   22
Appendix II              Key Figures and Balance Sheet                       24
Appendix III             Asset Quality                                       29

                                                                                  4
Transaction Overview: Investment Thesis

Group structure NIBC                                                                                Summary terms
               NIBC Issuance Structure                                                                     Additional Tier 1 Capital issued by NIBC Bank N.V.
        Group Consolidated (5.125% AT1 Trigger)
                                                                                                           Perpetual maturity
                                                                                                           EUR denominated
                       NIBC Holding N.V.
                                                                                                           Callable after [5-7] years and semi-annually thereafter
                                                                                                           5.125% CET1 trigger at Group and/or Issuer

                     NIBC Bank N.V. (Issuer)                                                               Temporary write-down loss absorption mechanism
                                                                                                           Discretionary, semi-annual, non-cumulative coupons
       Bank sub-consolidated (5.125% AT1 Trigger)                                                          Expected rating B+ (S&P)

AT1 transaction rationale                                                                           Investment thesis1
   Capital optimisation and fulfilment of the 1.5% AT1 requirement                                         Solid fully-loaded CET1 ratios: 20.3% (18.1%)
   Reinforcing already strong leverage ratio (fully-loaded 7.4% at                                         Ample headroom to trigger: 15.2% (13.0%)
   H1 2017)
                                                                                                           Large buffer to MDA restrictions: 7.8% (5.6%)
   RAC eligibility
                                                                                                           Robust level of ADIs: over 135x coupon coverage2
   Contributing to future MREL requirements
                                                                                                           Limited amount of AT1 to be issued by NIBC
                                                                                                           Growing franchise and increasing profitability

                        1: All numbers as of H1 2017; Holding numbers in brackets
                        2: Coupon coverage calculated on the basis of €200 million issuance size, conservative coupon estimate and €1.6bn ADIs as of FY 2016         5
1. NIBC: Moving Ahead

                        6
Focused mid-market corporate and retail franchise with differentiated approach

Our business model                                                                                                                                            Key indicators

     Mid-market corporate client offering                               Retail client offering
                                                                                                                                                                 €23.6bn Total assets
       Full spectrum from advising, structuring,                            Mortgages ranging from residential to
       financing, and co-investing across debt                              buy-to-let
       and equity                                                           Focus on entrepreneurs and small
                                                                            businesses
                                                                            Leasing                                                                               €1.9bn          Equity
                                                                            Online savings

                                                   (1)                                                                                 (1)
                                                                                                                                                                                   CET1 ratio
     €10.2bn client exposure1                                           €9.1bn client exposure1
                                                                                                                                                                                   before impact
                                                                                                                                                                                   of c. -4% for
     Typical ticket size: €10-50m                                       Typical ticket size: €100k – 2.5m                                                          18.1%
                                                                                                                                                                                   mortgage
                                                                                                                                                                                   reclassification
Our differentiated approach                                                                                                                                                        (IFRS 9)2

   Agile organisation with an entrepreneurial spirit
   Focus on profitable niches and (sub)sectors                                                                                                                     +58%           NPS

   Modest corporate portfolio size and limited number of clients allow more complete insight
   and overview
   Culture of empowerment, accountability and action
   Tailored and disciplined risk management culture and risk-adjusted returns strategy                                                                              8.9%          ROE1

   No current accounts offered and no branch network

                       Note: Financials for NIBC Holding as of H1 2017, unless otherwise stated.
                       1: NIBC Bank, H1 2017. Client exposure includes drawn & undrawn lending.
                       2: In addition, the impact for NIBC of the IFRS 9 impairment model change from incurred loss to expected loss is expected to come out below the expected market average as   7
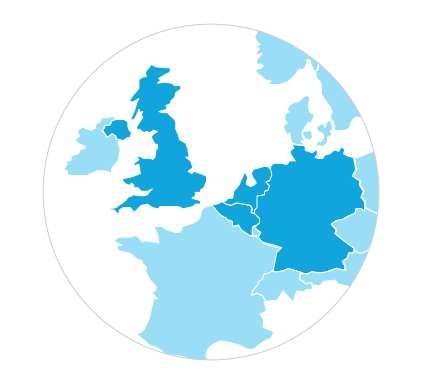
                       reported by EBA.
Targeted growth backed by resilient Northwestern European markets

Focus on Northwestern Europe                                                       Growing and transforming client exposures…
United Kingdom (32 FTEs)                            Netherlands (570 FTEs1)                                      CAGR
  Corporate client                                    Savings: €4.0bn                                            +3.3%        19.3
  exposure: €1.7bn                                    Mortgages: €9.0bn                         17.7
                                                                                                                                            > €1bn
                                                      Corporate client exposure:                                                            origination p.a.
                                                      €6.3bn                                     8.1                          9.1

                                                                                                                                            c. €3bn
                                                                                                                              10.2          origination p.a.
                                                                                                 9.7

                                                                                                2014                        H1 2017
                                                                                          Corporate exposure (€bn)           Mortgages (€bn)

                                                                                   … driving revenues expansion
                                                                                                CAGR
                                                                                                +14%
                                                                                                           381
                                                                                                                                     CAGR
                                                                                          295                                        +37%
                                                                                                                                                226
                                                                                                                            165

Belgium (4 FTEs)                                    Germany (85 FTEs)
  Savings: €1.1bn                                       Savings: €4.5bn
                                                                                         2014             2016            H1 2016              H1 2017
                                                        Corporate client
                                                        exposure: €2.2bn                                     Operating income (€m)

                       Note: Financials for NIBC Bank as of H1 2017.
                       1: Including BEEQUIP.                                                                                                             8
Efficient, entrepreneurial and agile culture

Our purpose                                                            Our heritage                                                      Key indicators

                                                                              Founded in 1945 to help rebuild the
                                                                              Netherlands after World War Two
              Making a difference                                             Evolved from a pure-play longterm lending
             at decisive moments                                              bank to an enterprising bank offering advisory
                                                                              services, financing and co-investing to our
                                                                              clients
                                                                                                                                            691     FTEsI

Our values

                                                                                                                                                    Employee
                                                                                                                                            80%     engagement2

      Professional                                 Entrepreneurial                                        Inventive
        In-depth sector knowledge                      Sound, enterprising bank                               Bespoke solutions
                                                                                                                                                    Cost to
        Expert financial solutions                     Decisive moments in                                    Think creatively to meet
                                                                                                                                            46%     income
                                                       clients’ business and life                             clients’ financial needs
        Tailored risk management                                                                                                                    ratio3
                                                       Agile execution                                        Structuring DNA

                      1: NIBC Holding, as of H1 2017.
                      2: NIBC Bank, as of FY 2016 (internal measurement supported by third party service provider).                                           9
                      3: NIBC Bank, as of H1 2017.
Continuously anticipating trends and adapting our offering to the future
                                                                                                                                                                    2017

2014
                                                                                                                                               Innovation
                                                                                                               Acquisitions
                                                                  Start-ups                                                                      Partnering with, and
                               Partnering                                                                      Strengthening footprint           investing in Fintech
New Products                                                          Facilitating and investing               in Germany                        companies
                               Leveraging platform and                in start-up businesses
Developing future              generating fees                                                                   NIBC Bank
revenue generators
                                                                                                                 Deutschland AG
                                 Introduction of                           Majority stake                                                +
                                 “Originate-to-                                                        +
                                 Manage” offering           +            (founding partner)                    Broadening product

  Buy-to-Let mortgages
                           +                                                                                   offering

                                 Agreement with EIB                                                              SNS Securities
  Cash flow financing            guaranteeing loans up                     Minority stake
  (factoring)                    to €500m

Building and transforming upon our core product offering

       Financing                             Corporate Finance                                Retail Solutions                           Investing
          Debt financing                     & Capital Markets                                     Mortgages                                 Mezzanine and equity
          Leasing                               Mergers & acquisitions                             Online savings and                        solutions
                                                Capital structuring                                brokerage
                                                DCM & ECM

                                                                                                                                                                        10
Flexibility to adapt origination focus ensures attractive risk adjusted returns

Corporate                          Commercial real                               Infrastructure &                          Shipping &                                   Mortgages
lending1                           estate                                        Renewables                                Intermodal                                   (incl. buy-to-let)
€4.2bn2                             €1.4bn2                                       €1.6bn2                                   €1.4bn2                                       €9.1bn2

  Recent initiatives focused            Exit of legacy files, focus of                Transition to shorter term                Moderate portfolio size                      Shift from bias to main
  on receivables lending as             origination on value added                    financing of digital                      allows for close                             stream NHG (State
  well as selected equity and           non-standard solutions in                     infrastructure assets and                 monitoring of dry bulk                       guarantee) backed
  mezzanine opportunities,              Dutch market with typical                     renewable projects                        exposure while new focus                     mortgages to non-NHG
  eliminating outsized                  smaller ticket sizes                                                                    is on wet bulk and niche                     mortgages and niches such
  exposures                                                                                                                     segments                                     as “buy to let”

Cost of risk3                                                                                               Impairment ratio4

          1.16%                                                                                                        0.63%

                           0.71%                                                                                                               0.39%                   0.34%
                                                   0.60%
                                                                           0.27%                                                                                                               0.14%

          2014             2015                    2016                  H1 2017 5                                      2014                    2015                    2016                 H1 2017
                                                                                                                                                                                                       5

                   Note: selected examples. Financials for NIBC Bank.                                           3: Impairments & credit losses mortgages in net trading income / average total RWA
                   1: Category consists of Food, Agri, Retail & Health; Telecom, Media, Technology & Services   4: Impairments / average carrying value of loans & mortgages.
                   and Industry & Manufacturing.                                                                5: H1 2017 annualised.                                                                     11
                   2: Exposure as of H1 2017.
Improved rating outlook and decreasing cost of funding

Solid and diversified funding base                                                          Positive rating development

   Retail savings                                                          Total funding1
                                          9%                                (H1 2017):
                                                                                                                                    BBB-
                                                                             €22.3bn
   ESF                                                                                                                    BBB-      Positive
                                                                                                 BBB-         BBB-
                             20%                                43%                              Stable       Stable      Stable
                                                                                                                                    BBB-
   Secured (wholesale)
                                                                                                                                    Positive
                                                                                                              BBB-        BBB-
   Unsecured (wholesale)                                                                          BBB-        Stable      Stable
                                                                                                  Negative
                                   21%
   Equity                                          7%
                                                                                                   2013         2014        2015      2016

Improved funding: ready for the future                                                      Reducing cost of funding
   Repaid all government guaranteed funding
                                                                                                  1.30%
   Restarted issuing wholesale senior unsecured                                                                1.22%
                                                                                                                            1.01%
                                                                                                                                     0.92%
   Added new funding instruments ESF3 and (T)LTRO
   Softened redemption scheme funding

                                                                                                                                               2
                                                                                                   2014         2015        2016    H1 2017

                           Note: Financials for NIBC Bank.
                           1: Liabilities excluding derivatives.
                           2: H1 2017 annualised.                                                                                              12
                           3: German SSD benefitting from the depositary guarantee scheme
Strong capital generation allowing attractive dividend capacity

Significant improvement of performance…                                                            … with solid capital position
NIBC Bank                                                                                            NIBC Holding – Basel III fully loaded

                 Dividend                                                                            Leverage
                                               25                        30                                                    6.5%                                          6.6%
                 Payout (€m)                                                                         Ratio

                                              102                                                                                                                            20.7%

                                                                         87                             BIS                   18.0%                                          2.6%

                                                                                                        T2                     2.9%                                          18.1%
                     71                                                       2
                                                                       8.9%
                                                                                                                              15.1%                                                   12.0%
                                                                                                                                                                                      SREP3
       42
                                              5.4%

                    3.9%                                                                                CET1

      2.3%

             1
      2014          2015                     2016                   H1 2017                                                    2016                                         H1 2017
                 Net Profit (€m)                 ROE (%)
                                                                                                     CET1 ratio before impact of c. -4% for mortgage reclassification (IFRS 9)4

                    Note: Financials for NIBC Bank and NIBC Holding.
                    1: 2014 before one-off SNS levy of €18m related to the nationalisation of SNS Reaal that was paid to the State of the Netherlands.
                    2: 1H 2017 annualised.                                                                                                                                            13
                    3: SREP requirement for total capital excluding Capital Conservation Buffer. SREP requirement for CET1 excluding Capital Conservation Buffer is 8.5%.
                    4: See appendix for further details on IFRS 9 impact.
Strong fundamentals supporting 10%+ ROE going forward…

                                                                                                                                                                                       Earnings
                                                                                                                                                                                       resilience and
                                                                                                                                                                                       near-term 10%+
                                                                                                                                                           Strong capital              ROE objective
                                                                                                                          Prudent risk                     position                    ROE and Net profit
                                                                                         Lean                             management                        CET1 ratio                 €m            1
                                                                                                                                                                                                        8.9%
                                                       Improving cost                    organisation                     Cost of risk2                     Holding
                                                                                                                                                                                          2.3%
                         Sustainable                   of funding                        Cost / income                                                                     18.1%                CAGR1
                         revenue growth                Cost of funding                   Incl. Bank Levy                                                         13.7%                           61%
Growing portfolio                                                                                                             1.16%
                         Total income                                                                                                                                                                    87
                                                                                                     -7%                                                                                   42
                         €m
Commercial                       CAGR1
                                                          1.30%                               53%                                                                                  =      2014
                                                                                                                                                                                                 3
                                                                                                                                                                                                       H1 2017
assets                                                                                                     46%                             0.27%
€bn
                                   15%
                                                                       0.92%                                                                           +
                                                                                                                                                                 2014    H1 2017         Efficient operating
                            295
                                         226
                                                                                                                      +        2014      H1 2017
                                                                                                                                                   1
                                                                                                                                                                                         model and strong
             19.3                                                                                                                                                 Transition to
   17.7
                                                                                     +       2014       H1 2017                                                   IFRS 9                 momentum
                                                                                                                               Steering to lower
                                                   +       2014      H1 2017 1                Operating                        risk portfolios                    Basel IV               towards a
                                                                                                                                                                                         sustainable 10%+
                     +                                      Stable and
                                                                                              leverage                         Risk DNA and                       manageable
                                                                                                                                                                                         return on equity
                            2014      H1 2017
                                                                                              Flexibility to                   employee
   2014   H1 2017          Focus on higher                  diversified
                                                                                              invest in growth                 accountability
  Supportive macro         margin products                  funding profile
                                                                                              and innovation
  fundamentals             through risk-                    BBB+ rating
  Qualitatively            adjusted model                   objective
  sound growth in
  corporate loans
  and mortgage
  portfolios

                            Note: Financials for NIBC Bank, unless otherwise stated.
                            1: H1 2017 annualised.
                            2: Impairments & credit losses mortgages in net trading income / average total RWA.                                                                                          14
                            3: 2014 before one-off SNS levy of €18m related to the nationalisation of SNS Reaal that was paid to the State of the Netherlands.
...with clear targets and near-term objectives…

                                                                              Current    Targets              Near-term
                                                                              H1 2017   2015-20171            objectives
                                                                               8.9%       8-10%                   >10%
                                                                       ROE
                 Innovation                                            Bank

                                                                               46%        47-54%                  12%                   >14%
                                                                   CET1
                                                                  Holding
   Core
  product    +    Start-ups
                                                                               6.6%
  offering                                                                                >5.0%                   >4.5%
                                                           Leverage ratio
                                                                  Holding

                 Partnering                                                                BBB                    BBB+
                                                                               BBB-
                                                                  Rating
                                                                       Bank
                                                                                                     ~
                                                                               €30m
                    New
                  products                                     Dividends                Future dividend policy to be defined

     BACKED BY OUR CURRENT SHAREHOLDER WE HAVE RECENTLY COMMENCED A REVIEW OF OUR
       STRATEGIC ALTERNATIVES, WHICH MAY INCLUDE A POTENTIAL INITIAL PUBLIC OFFERING
                    Note: Financials for NIBC Bank and NIBC Holding.
                    1: Targets set out in 2014 annual report.
                                                                                                                               15
2. Transaction Details

                         16
Transaction Overview: Investment Thesis

Group structure NIBC                                                                                Summary terms
               NIBC Issuance Structure                                                                     Additional Tier 1 Capital issued by NIBC Bank N.V.
        Group Consolidated (5.125% AT1 Trigger)
                                                                                                           Perpetual maturity
                                                                                                           EUR denominated
                       NIBC Holding N.V.
                                                                                                           Callable after [5-7] years and semi-annually thereafter
                                                                                                           5.125% CET1 trigger at Group and/or Issuer

                     NIBC Bank N.V. (Issuer)                                                               Temporary write-down loss absorption mechanism
                                                                                                           Discretionary, semi-annual, non-cumulative coupons
       Bank sub-consolidated (5.125% AT1 Trigger)                                                          Expected rating B+ (S&P)

AT1 transaction rationale                                                                           Investment thesis1
   Capital optimisation and fulfilment of the 1.5% AT1 requirement                                         Solid fully-loaded CET1 ratios: 20.3% (18.1%)
   Reinforcing already strong leverage ratio (fully-loaded 7.4% at                                         Ample headroom to trigger: 15.2% (13.0%)
   H1 2017)
                                                                                                           Large buffer to MDA restrictions: 7.8% (5.6%)
   RAC eligibility
                                                                                                           Robust level of ADIs: over 135x coupon coverage2
   Contributing to future MREL requirements
                                                                                                           Limited amount of AT1 to be issued by NIBC
                                                                                                           Growing franchise and increasing profitability

                        1: All numbers as of H1 2017; Holding numbers in brackets
                        2: Coupon coverage calculated on the basis of €200 million issuance size, conservative coupon estimate and €1.6bn ADIs as of FY 2016         17
Distance to Trigger & MDA Restrictions

Capital requirements vs current capital structure:
ample headroom to trigger1                                                                                Large buffer to MDA restrictions1

                                                                       25.3%

                                                                       4.9%
                                         20.7%

                                         2.6%
                                                                                                                                                   AT1 inefficiencies

         14.5%                                                                                                                                                                            7.1%
                                                                        15.2%                                                                             5.6%                           €627m
                                        13.0%                           €1.3bn                                                                           €494m
           2.0%
                                        €1.1bn
           1.5%
           2.5%                                                        20.3%                                               18.1%
                                                                                                                                                     11.0% fully-loaded CET1 requirement2
                                        18.1%

           4.0%

                                                                                       5.125%
                                                                                       Trigger
           4.5%

    Regulatory Capital          NIBC Holding (FL)               NIBC Bank (FL)                                  H1 2017 NIBC Holding                 Buffer to MDA            Buffer to MDA (with filled
    Requirements (FL)                                                                                              CET1 Ratio (FL)                                                   AT1 bucket)
            CET1               P2R              CCB              AT1              T2                                                                    MDA Buffer

                  1: CET1 ratios exclude expected IFRS 9 impact from reclassification of NIBC residential mortgage portfolio from fair-value-through-P&L to amortised cost. If NIBC were to implement
                  IFRS 9 based on the H1 2017 figures, the impact is estimated to be approximately 4%. In addition, the impact for NIBC of the IFRS 9 impairment model change from incurred loss to
                  expected loss is expected to come out below the expected market average as reported by EBA                                                                                            18
                  2: Includes 2.5% Capital Conservation Buffer
Capital Management Philosophy & Distribution Capacity

Dividend policy and capital hierarchy statement

   Future dividend policy to be defined
   Management intends to give due consideration to the capital hierarchy and preserve seniority of claims

Available Distributable Items (ADI)

   Comfortable ADIs relative to estimated AT1 coupon costs
   Growing franchise and increasing profitability support sustainability of coupon distributions

                                                          €1.6bn
                                                                                                              Coupon Coverage
                                                                                                               Ratio: >135x1

                                                                                                                     [~€12m]

                                          Distributable Items (FY 2016)                                        Est. AT1 Coupon

                  1: Coupon coverage calculated on the basis of €200 million issuance size, conservative coupon estimate and €1.6bn ADIs as of FY 2016. After the
                  expected impact of IFRS9 the Coupon Coverage Ratio is expected to stay above 100x.                                                                19
Summary of the Terms & Conditions of the Transaction

Summary terms of the additional tier 1 capital securities

          Issuer                    NIBC Bank N.V.

        Instrument                  € [ ] Undated Deeply Subordinated Additional Tier 1 Fixed Rate Resettable Callable Securities (the “Capital Securities”)

   Issuer Senior Rating1            Baa1 (stable) / BBB- (pos.) / BBB- (pos.) - Moody’s / S&P / Fitch

  Expected Issue Rating             NR / B+ / NR

                                    Unsecured and deeply subordinated obligations of the Issuer; senior only to the rights and claims of share capital and subordinated obligations ranking, or
          Status
                                    expressed to rank, junior to the Capital Securities

          Tenor                     Perpetual NC [5-7]

                                    Redeemable at the option of the issuer at the Prevailing Principal Amount on the first call date [ ] or on any Interest Payment Date thereafter, or upon the
  Optional Redemption
                                    occurrence of a Tax Event (loss of tax-deductibility or application of Additional Amounts) or Capital Event (full or partial loss of Additional Tier 1 treatment for
                                    the Issuer or the Group). Redemptions subject to prior regulatory approval and Applicable Banking Regulations

         Interest                   [ ]% semi-annually payable in arrear, reset at the First Call Date and every fifth anniversary thereafter at the 5-year Mid-Swap Rate plus the Initial Margin

 Non-Cumulative Interest            At any time at the Issuer’s discretion. Mandatory cancellation upon insufficient Distributable Items or if payment exceeds the Maximum Distributable Amount
      Cancellation                  or if competent authority orders cancellation

     Loss Absorption                Temporary write-down upon breach of 5.125% CET1 ratio at Group and/or Issuer; discretionary write-up (subject to certain conditions/restrictions). Subject
       Mechanism                    to statutory PONV

      Governing Law                 Laws of the Netherlands

  Denominations / Listing           € 200,000 x 1,000 / Luxembourg Stock Exchange

                       1: Moody’s rating is unsolicited and non-participative
                                                                                                                                                                                                    20
AT1 Structural Comparison

Comparison with selected AT1 precedents

      IssueDate             [ ] 2017           Jul 2017              May 2017           Nov 2016            Sep 2015         Nov 2014

       Coupon                 []                6.125%                6.25%               6.875%             5.75%            7.625%

   Size & Currency            €[]               €650m                 €750m              US$1bn              €1bn             €300m

 Maturity / First Call   PerpNC[5-7]           PerpNC5               PerpNC7            PerpNC5.5          PerpNC5          PerpNC5.5

                         Discretionary,     Disrectionary,        Disrectionary,      Disrectionary,     Disrectionary,    Disrectionary,
 Coupon Cancellation
                         non-cumulative     non-cumulative        non-cumulative      non-cumulative     non-cumulative    non-cumulative

    Issue Ratings        NR / B+ / NR
                                             NR / BB / NR          Ba3 / B+ / B+      Ba1 / NR / BBB-    NR / BB / BB+     NR / NR / BB-
    (M / S&P / F)         expected

                             5.125%                                                                     7% Group, 5.125%
 CET1 Trigger Level                       5.125% Bank / Group   5.125% Bank / Group     7% Group                                7%
                         (Bank / Group)                                                                  Bank Solo & Sub

   Loss Absorption        Temporary          Termporary            Temporary                              Temporary         Temporary
                                                                                        Conversion
     Mechanism            Write-down         Write-down            Write-down                             Write-down        Write-down

       PONV                Statutory           Statutory             Statutory           Statutory          Statutory        Statutory

       Format                Reg S               Reg S                 Reg S              Reg S              Reg S             Reg S

                                                                                                                                         21
Appendix I
Mortgage Reclassification: expected IFRS 9
impact

                                             22
Expected impact of mortgage reclassification (IFRS 9)

Mortgage reclassification from IFRS 9 on 1-Jan-2018                                                                  Mortgage portfolio evolution
  As of 30-Jun-2017, NIBC’s mortgage portfolio consists of:
       Mortgages originated since 2013: held to maturity and accounted for at amortised cost (AC) -
       €4.0bn                                                                                                                                                               8.8                   9.1
                                                                                                                                                      8.6
       Mortgages originated before the crisis: valued at fair value through profit or loss                                        8.1                                                                      0.5
                                                                                                                                                               0.1                     0.4
       (FVtPL) - €5.1bn
                                                                                                                                  1.1                 2.3
  FVtPL chosen when IFRS first adopted reflecting NIBC ‘originate to distribute’ business model at that                                                                     3.0                  3.5
  time
       FVtPL mortgages in practice now hold to maturity
       €104m positive pre-tax revaluation accounted on balance sheet as of 30/06/017, consisting of
            a €362m pre-tax revaluation gain on the mortgages, and                                                                7.0
            a €258m pre-tax revaluation loss on the related hedging swaps                                                                             6.2                   5.5                  5.1
  As of 1/1/2018, NIBC intends to reclassify its FVtPL mortgage portfolio to AC, in line with its
  hold to maturity business model and general market practice, resulting in a one-off loss through
  shareholders’ equity
  If NIBC were to implement IFRS 9 based on the 30/06/2017 figures, the reclassification would result in                         2014                 2015                 2016                 H1-17
       an estimated negative impact on NIBC’s CET1 ratio of approximately 4%, and
       a future positive pull-to-par effect through the income statement over the remaining life of                           FVtPL mortgages (€bn)          AC mortgages (€bn)              Buy-to-Let (€bn)
       the portfolio

Preliminary pro forma financial impact of mortgages reclassification (IFRS 9)

                               First time adoption impact:                                     Removal of the negative pull-to-par from mortgages     Combination of first time    ROE affected by
                               Difference between FVtPL                                        previously accounted at FVtPL while the positive       adoption impact on equity    • Reduced equity
                               and AC                                                          pull-to-par from the swap portfolio remains intact     and higher net profit        • Improved earnings
                                                                                               over the remaining life of the mortgage portfolio      portfolio remaining life

             18.1%
                                                  >14%                                                                                                                                        >10%
                               c. -4%

          CET I ratio         Expected          Pro forma                              Net profit         Expected        Pro forma                          ROE            Expected         pro forma
           H1 2017             impact                                                                      impact                                                            impact

                                      Note: Financials for NIBC Holding.
                                                                                                                                                                                                            23
Appendix II
Key Figures and Balance Sheet

                                24
Key figures NIBC Bank

Earnings and assets                                                                          Asset quality, solvency and funding & liquidity
€m                                                      2014     2015     2016     H1 2017   €m                                                                2014     2015      2016      H1 2017

Earnings                                                                                     Asset quality
Operating income                                           295     316       381       226   Risk-weighted assets                                              9,646    10,162   10,109      8,773
Operating expenses                                         155     177       194       105   Cost of risk3                                                     1.18%     0.71%    0.60%      0.27%
Net profit attributable to parent shareholder               24       71      102        87   Impairment ratio4                                                 0.63%     0.39%    0.34%      0.14%
Net profit before special items                             42       71      104        87   NPL ratio5                                                         3.4%      3.7%     3.8%       2.8%
Net interest income                                        247     286       306       177   Impaired exposure                                                   454       503      629        396
Net fee and commission income                               27       36       32        20   Impaired coverage ratio6                                            38%       34%      33%        49%
Net trading income                                           3     (12)       12         2   Top-20 exposure / Common Equity Tier-1                            104%        86%      79%        75%
Impairments                                                 93       63       57        12
                                                                                             Exposure corporate loans that display an arrear > 90 days          0.8%      0.7%     0.9%       0.9%
Net interest margin1                                     1.28%   1.37%     1.44%     1.54%
                                                                                             Exposure residential mortgages that display an arrear > 90 days    1.0%      0.7%     0.6%       0.5%
Dividend payout ratio                                       0%      0%       25%       35%
                                                                                             Loan to value Dutch Residential mortgages7                          82%       84%      85%        84%
Cost-to-income ratio                                       53%     56%       51%       46%
                                                                                             Loan to value BTL mortgages                                          n/a      61%      56%        61%
Return on equity2                                         1.3%    3.9%      5.4%      8.9%
                                                                                             Solvency information8
Corporate & consumer banking assets                                                          Shareholder's equity                                               1,831    1,886    1,969      2,023
Corporate Banking Assets (Drawn + Undrawn)                                                   Subordinated liabilities                                             320      400      398        387
Infrastructure & Renewables                              2,070   1,990     1,618     1,582   Group capital base                                                 2,151    2,286    2,367      2,409
Industries & Manufacturing                               1,118   1,266     1,514     1,766   Balance sheet total                                               23,331   23,229   23,580     23,769
Shipping & Intermodal                                    1,357   1,537     1,512     1,366   Common Equity Tier-1 ratio                                         15.5%    15.6%    16.8%      20.3%
Commercial Real Estate                                   1,321   1,293     1,375     1,388   Tier-1 ratio                                                       15.5%    15.6%    16.8%      20.3%
Telecom, Media, Technology & Services                      744     968     1,257     1,142
                                                                                             BIS ratio                                                         19.3%    20.0%     21.3%      25.3%
Oil & Gas Services                                       1,316   1,282     1,233     1,055
Food, Agri, Retail & Health                                864     896     1,149     1,260   Leverage ratio                                                     7.0%     7.2%      7.3%       7.4%
Total corporate loans (drawn + undrawn)                  8,789   9,232     9,658     9,560   Funding & liquidity9
Lease receivables                                          361     221       123        88   LCR                                                                128%     201%      124%       261%
Investment loans                                           154     161       246       258   NSFR                                                               108%     113%      112%       118%
Equity investments                                         377     300       262       278   Loan-to-deposit ratio                                              154%     143%      148%       146%
Total corporate banking assets (drawn + undrawn)         9,681   9,914    10,289    10,184   Asset encumbrance ratio10                                           35%      29%       29%        27%
                                                                                             Retail savings / Total funding                                      47%      48%       45%        43%
Corporate banking assets (drawn + undrawn) per region                                        Secured funding / Total funding                                     30%      24%       22%        21%
The Netherlands                                          2,983   3,304     3,849     4,285   ESF / Total funding                                                  5%       6%        6%         7%
Germany                                                  2,293   2,229     2,378     2,182                                                                     BBB- /   BBB- /    BBB- /      BBB-
United Kingdom                                           1,788   1,700     1,678     1,723   S&P rating & outlook                                              Stable   Stable   Positive   /Positive
Other                                                    2,617   2,681     2,384     1,994
                                                                                                                                                               BBB- /   BBB- /    BBB- /      BBB-
Total corporate banking assets (drawn + undrawn)         9,681   9,914    10,289    10,184
                                                                                             Fitch rating & outlook                                            Stable   Stable   Positive   /Positive
                                                                                                                                                               Baa3 /   Baa1 /    Baa1 /      Baa1/
Retail banking assets
                                                                                             Moody’s rating & outlook (unsolicited and non-participative)      Stable   Stable    Stable     Stable
Mortgages - The Netherlands                              7,891   8,463     8,847     9,008
Mortgages - Germany                                        167     117        84        67   Other information
Total consumer banking assets                            8,058   8,580     8,831     9,075   Assets under management for third parties                         1,732    1,703     1,538      1,787

                                                                                                                                                                                            25
Key figures NIBC Bank (continued)

Notes to the key figures

 1. 12 months net interest income / 12 months average interest-bearing assets

 2. Net profit attributable to parent shareholder / total shareholder’s equity at the beginning of the year

 3. Impairments & credit losses mortgages in net trading income / average total risk weighted assets (RWA)

 4. Impairments / average carrying value of loans and mortgages

 5. Total non-performing exposure (corporate and consumer loans); non-performing exposure determined at customer level

 6. Impairment amounts recognised on corporate and retail exposures / impaired corporate and retail exposures. Impairment amounts includes
    amounts recognised as IBNR

 7. Loan-To-Indexed-Market-Value (LTIMV), excluding NHG guaranteed mortgages

 8. The solvency information is based on the CRR / CRD IV regulation, calculated for NIBC Bank consolidated on a fully loaded base and
    including the half-year net profit and taking into account the proposed dividend payment

 9. All funding & liquidity ratios with exception of loan-to-deposit are calculated at NIBC Holding level; loan-to-deposit ratio is calculated at
    NIBC Bank level

 10. Encumbered assets & total collateral received re-used / total assets & total collateral re-used

                                                                                                                                                26
Balance Sheet NIBC Bank

Assets                                              Liabilities

€m                      2015     2016     H1 2017    €m                         2015     2016     H1 2017

                                                     Retail funding             10,016    9,721     9,571
Cash and banks           2,491    2,346     3,385
                                                     Funding from securitised
                                                                                 2,062    1,337      759
                                                     mortgages
Loans                    7,790    8,380     8,113
                                                     Covered bonds               1,513    2,028     2,008

Lease receivables         212      123        88
                                                     ESF                         1,127    1,230     1,503

Residential mortgages    8,767    9,020     9,263    All other senior funding
                                                                                 3,735    4,650     5,876
                                                     (Wholesale)
                                                     Tier 1 & Subordinated
Debt investments         1,377    1,375     1,019                                 400      398       387
                                                     funding

                                                     Derivatives                 2,350    2,006     1,499
Equity investments        277      252       271

                                                     All other liabilities        139      241       144
Derivatives              2,151    1,817     1,499
                                                     Total liabilities          21,343   21,611    21,746
All other assets          165      267       131
                                                     Shareholder’s equity        1,886    1,969     2,023

Total assets            23,229   23,580    23,769    Total liabilities &
                                                                                23,229   23,580    23,769
                                                     shareholder’s equity

                                                                                                       27
Balance Sheet NIBC Holding

Assets                                              Liabilities

€m                      2015     2016     H1 2017    €m                         2015     2016     H1 2017

                                                     Retail funding             10,016    9,721     9,571
Cash and banks           2,512    2,386     3,399
                                                     Funding from securitised
                                                                                 2,062    1,337      759
                                                     mortgages
Loans                    7,397    7,931     7,703
                                                     Covered bonds               1,513    2,028     2,008

Lease receivables         212      123        88
                                                     ESF                         1,127    1,230     1,503

Residential mortgages    8,767    9,020     9,263    All other senior funding
                                                                                 3,786    4,674     5,868
                                                     (Wholesale)
                                                     Tier 1 & Subordinated
Debt investments         1,377    1,375     1,019                                 400      398       387
                                                     funding

                                                     Derivatives                 2,350    2,006     1,499
Equity investments        277      252       271

                                                     All other liabilities        158      281       162
Derivatives              2,141    1,811     1,499
                                                     Total liabilities          21,418   21,676    21,757
All other assets          470      597       396
                                                     Shareholder’s equity        1,735    1,819     1,881

Total assets            23,153   23,495    23,638    Total liabilities &
                                                                                23,153   23,495    23,638
                                                     shareholder’s equity

                                                                                                       28
Appendix III
Asset Quality

                29
Strong and Diversified Asset Base (H1 2017)

Well diversified client assets (€19.3bn)                                        Focus on north-western Europe
                      Food, Agri, Retail Other, 3%
                        & Health, 7%
           Technology,
         Media, Telecom                                                                                10%
          & Services, 6%
        Industries &
                                                                                                  9%
                                                                                                                       Netherlands
       Manufacturing,                                         Residential
             9%                                              Mortgages, 45%                                            Germany
                                                                                                12%
         Oil & Gas                                                                                                     UK
        Services, 5%
                                                                                                                69%    Other
       Commercial Real
         Estate, 7%
                  Shipping &
               Intermodal, 7%                      Buy-to-Let
                                 Infrastructure & Mortgages, 3%
                                 Renewables, 8%

Declining cost-of-risk1                                                         Declining NPL

                                                                                                                3.8%
       1.16%                                                                                      3.7%

                                                                                      3.4%
                            0.71%
                                                     0.60%

                                                                       0.27%                                                2.8%

       2014                  2015                    2016             H1 2017         2014        2015          2016     H1 2017

                             1: H1 2017 annualised
                                                                                                                                     30
Corporate Loan Portfolio Performance (H1 2017)

  Performing / Non-Performing     Forborne         Defaulted        Impaired

           €10,184m               €1,104m           €453m            €396m

                                 Forborne
                                  €655m
           Performing
            €9,701m

                                Not Forborne
                                  €9,046m                           Impaired
                                                                     €364m

                                                   Defaulted
                                                    €419m
                                                                  Not Impaired
                                                                      €55m
                                  Forborne
                                   €448m

                                                 Non- Defaulted   Not Impaired
                                                     €30m             €30m

        Non - Peforming
             €483m                                                  Impaired
                                                                      €33m
                                                   Defaulted
                                                     €34m
                                                                  Not Impaired
                                Not Forborne                          €2m
                                    €34m

                                                 Non-Defaulted    Not Impaired
                                                      Nil              Nil

                                                                                 31
Impaired, Defaulted, Non-Performing and Forborne Reference Card:
Determination Guidance

                                 Performing                                                                           Non-Performing
Fully performing                                                                        •   90 days past due, or
                                                                                        •   Unlikeliness to pay, or
Loans and debt securities that are not past-due and without risk of non-repayment and   •   Additional forbearance measures or 30 days past due on forborne facility under
performing off-balance sheet items                                                          probation

                                                                                                                               Defaulted
                                                                                                      •       90 days past due, or
                                        Forborne                                                      •       Unlikeliness to pay

                                        •     Concession is granted, and
                                        •     Financial difficulties of the obligor
   Performing facilities
   past due below 90 days               Concession:

                                        •     Modification terms or conditions to                         Impaired
                                              allow sufficient debt service capacity
                                        •     Refinancing                                                 •     Observed impairment trigger, and
                                                                                                          •     Impairment amount

               Renegotiated facilities that do not qualify as Forborne

                                                                                                                                                                        32
Asset Quality: Corporate Banking (H1 2017)

Impaired exposure: €396m                                                                               Outstanding impairments: €194m

                                           Commercial Real Estate                                                                             Commercial Real Estate
              14%                                                                                                          15%
                                           Industries & Manufacturing                                                                         Industries & Manufacturing
                                                                                                                                       28%
                          35%                                                                                        8%
        13%                                Oil & Gas Services                                                                                 Oil & Gas Services

        6%                                                                                                           13%
                                           Food, Agri, Retail & Health                                                                  9%    Food, Agri, Retail & Health
                          5%
                                           Infrastructure & Renewables                                                                        Infrastructure & Renewables
               28%                                                                                                               28%
                                           Shipping & Intermodal                                                                              Shipping & Intermodal

Top-20 exposures at €1.3bn, split per sector1                                                          Top-20 exposures at €1.3bn, split per region

                                            Commercial Real Estate                                                                            The Netherlands
                   4%                                                                                                        8%
             10%                            Industries & Manufacturing                                                                        Germany
                                                                                                                       4%
                                            Oil & Gas Services                                                        5%                      Other
                          35%
                                                                                                                    5%                  42%
       18%                                  Telecom, Media, Technology & Services                                                             United Kingdom
                                                                                                                    4%
                                            Food, Agri, Retail & Health                                                                       North America

             18%                            Infrastructure & Renewables                                                    27%                Rest of Europe
                        15%
                                                                                                                                              Asia / Pacific
                                            Shipping & Intermodal

                          1: Top-20 exposures exclude equity exposures. Commercial Real Estate sector includes exposures
                                                                                                                                                                            33
                          of high granularity (multi-family / multi-property residential exposures)
Industries & Manufacturing

Credit quality
                                                                2014              2015                    2016             H1 2017
Exposure (€m)                                                   1,118             1,266                   1,514                  1,766
Non-performing exposure                                         3.3%               3.2%                   2.0%                   1.2%
Impaired exposure                                               2.9%               2.4%                   1.8%                   1.1%
Coverage ratio                                                   18%                41%                    53%                    77%

Exposure per sector                                                 Exposure per region
                                  Automotive,
                                  land and air                                                 United
                      Other, 8%                                                             Kingdom, 6%
                                  vehicles, 4%
                                         Chemicals, 4%
          Wholesale, 8%

     Transportation
      and storage,                                Industrial                                                      Germany, 25%
          11%                                   products, 28%

       Roads and                                                                                                    Rest of Europe,
      railways, 4%                                                                                                        6%

                                                                                The
             Rental and                                                      Netherlands,
               leasing                                                          63%
           activities, 34%

                                                                                                                                  34
Infrastructure & Renewables

Credit quality
                                                                     2014               2015    2016               H1 2017
Exposure (€m)                                                        2,070              1,990   1,618                   1,582
Non-performing exposure                                              2.5%                2.6%   3.2%                    3.2%
Impaired exposure                                                    2.2%                2.2%   3.2%                    3.2%
Coverage ratio                                                        21%                31%     28%                     29%

Exposure per sector                                                      Exposure per region
                      Water supply,
                        waste and
                      sewerage, 5%    Other, 2%

          Telecommunic                            Education, 23%                                    Germany, 21%
            ations, 9%

        Roads and
       railways, 9%                                                                                       Rest of Europe,
                                                                                                                4%

                                                       Healthcare,
                                                                                                            The
                                                          19%                      United                Netherlands,
            Renewable                                                           Kingdom, 63%                12%
           energy, 18%
                                                Other
                                           infrastructure,
                                                 14%

                                                                                                                         35
Commercial Real Estate

Credit quality
                                                                     2014              2015      2016               H1 2017
Exposure (€m)                                                        1,321             1,293     1,375                  1,388
Non-performing exposure                                              25.2%             29.6%     26.4%                  9.9%
Impaired exposure                                                    23.0%             26.0%     26.4%                  9.9%
Coverage ratio                                                        33%                27%      21%                    36%

Exposure per sector                                                      Exposure per region

                                           Construction
                              Other, 4%     companies,
                 Retail, 5%                    11%                                                       Germany, 25%
                                                    Development
                                                     companies,
                                                        11%
      Residential
      commercial                                     Hotels, 5%
      real estate,
         34%                                         Mixed-use, 4%

                                                                                     The
                          Other           Offices, 20%                            Netherlands,
                      commercial                                                     75%
                     real estate, 6%

                                                                                                                         36
Shipping & Intermodal

Credit quality
                                                   2014                2015                 2016                   H1 2017
Exposure (€m)                                      1,357               1,537                1,512                         1,366
Non-performing exposure                            3.6%                2.4%                  3.8%                         5.4%
Impaired exposure                                  3.6%                0.6%                  3.8%                         4.0%
Coverage ratio                                      75%                 20%                   48%                          48%

Exposure per sector                                    Exposure per region

                                                                           United      Asia / Pacific,
                                                                        Kingdom, 11%       11%
                            Bulker, 23%
                                                                 The                                     Germany, 7%
                                                              Netherlands,
                                                                 16%
     Tanker, 44%                     Container
                                     boxes, 4%
                                     Container                                                               North
                                     vessels, 4%                                                           America, 22%

                                                                 Rest of Europe,
                           Specialised                                26%              Other, 7%
                          vessels, 25%

                                                                                                                           37
Food, Agri, Retail & Health

Credit quality
                                                                              2014              2015              2016               H1 2017
Exposure (€m)                                                                  864                896             1,149                  1,260
Non-performing exposure                                                       1.3%               1.3%             2.6%                   2.6%
Impaired exposure                                                             1.2%               1.2%             2.6%                   1.7%
Coverage ratio                                                                61%                63%               55%                   100%

Exposure per sector                                                              Exposure per region

                                   Agriculture, 6%                                                     United
                                               Chemicals, 3%                                        Kingdom, 7%
                   Other, 11%
                                                                                                                      Germany, 30%
       Wholesale,
         17%
                                                                Food &
                                                             beverages, 29%

                                                                                                                              North
                                                                                                                           America, 1%
          Retail, 13%                                                                                                     Other, 4%
                                                                                              The
                 Other services,                     Healthcare, 7%                        Netherlands,
                      4%                                                                      58%
                                   Other financial
                                    services, 9%

                                                                                                                                          38
Telecom, Media, Technology & Services

Credit quality
                                                                       2014               2015                    2016                  H1 2017
Exposure (€m)                                                           744                 968                   1,257                        1,142
Non-performing exposure                                                3.8%                3.3%                    1.0%                        1.8%
Impaired exposure                                                      1.9%                2.4%                    1.0%                        0.0%
Coverage ratio                                                         40%                 60%                     53%                         100%

Exposure per sector                                                       Exposure per region

             Telecommunications, Other, 4%                                                      United
                    2%                         Education, 4%                                 Kingdom, 14%
       Rental and leasing
        activities, 11%
                                                    IT Services, 23%
                                                                                                                                Germany, 43%

 Other services, 20%
                                                       Leisure, 4%
                                                                                     The
                                                                                  Netherlands,
                                                                                     34%

                                                                                                                    Other, 1%
                             Other financial                                                           Rest of Europe,
                             services, 32%                                                                   9%

                                                                                                                                                39
Oil & Gas Services

Credit quality
                                                           2014                 2015                            2016                    H1 2017
Exposure (€m)                                              1,316                1,282                           1,233                         1,055
Non-performing exposure                                    0.0%                     3.8%                         9.2%                         13.7%
Impaired exposure                                          0.0%                     3.8%                         7.0%                         10.5%
Coverage ratio                                               n/a                    47%                          36%                           44%

Exposure per sector                                            Exposure per region

                           Seismic, 4%
                                                                               United                        Asia / Pacific,
             Production,                                                    Kingdom, 20%                         15%
                15%                        Drilling, 26%

                                                                                                                                 North
       Passenger                                                                                                               America, 12%
     transport, 1%
                                                                        The
                                                                     Netherlands,
                                                                        13%
        Offshore
      support, 21%                                                                                                             Other, 10%
                                           Engineering &
                                           Construction,
                                               18%
                           Exploration &                                                   Rest of Europe,
                            Production,                                                         31%
                               14%

                                                                                                                                                      40
Equity and Investment Loans

Introduction

 Investment portfolio is concentrated in the Netherlands
    Investment portfolio of €0.54bn at 30 June 2017, split between €278m equity exposure and €258m investment loan exposure

Exposure per sector                                                     Exposure per region

                                                                                                             North
                                                                                           Rest of Europe,
                                                                                                           America, 7%
                                          Infrastructure                                         1%
           Food, Agri,
                                          & Renewables,                              United
         Retail & Health,
                                               28%                                Kingdom, 5%
               27%

        Oil & Gas                                Industries &
       Services, 3%                             Manufacturing,
                                                     6%

                    Telecom,            Commercial                                                                   The
                     Media,            Real Estate, 8%                                                            Netherlands,
                  Technology &                                                                                       86%
                  Services, 27%

                                                                                                                                 41
Asset Quality: Retail Banking (H1 2017)

Mortgage loan arrears, impairments and credit losses          Portfolio indexed LtMV decreased over the past few
trending down                                                 years: 84% for H1 2017

      1.0%

                                                                   34%
                                                                  33%
                                                                 32%
                   0.7%
       12                           0.6%

                                                                                     22%
                                                     0.5%

                                                                                    21%

                                                                                   20%

                                                                                                                            19%
                     8

                                                                                                          16%

                                                                                                                      15%
                                                                                                                     14%
                                                                                                    12%
                                                                           11%
                                                                          10%

                                                                          10%
      0.16%

                                                                                                                9%

                                                                                                                                  9%
                                         5

                                                                                               8%
                   0.11%

                                                                                                                                       7%
                                    0.06%
                                                     0.03%
                                                          1
      2014         2015             2016            H1 2017       NHG     100%

                 Impairments & Credit Losses (€m)
                 Arrears > 90 days (%)                                           2014   2016    H1 2017
                 Impairments & Credit Losses (%)

                                                                                                                                  42
You can also read