Real time seroprevalence and exposure levels of emerging pathogens in infection naive host populations
←
→
Page content transcription
If your browser does not render page correctly, please read the page content below
www.nature.com/scientificreports
OPEN Real‑time seroprevalence
and exposure levels of emerging
pathogens in infection‑naive host
populations
Francesco Pinotti1,7, Uri Obolski2,3, Paul Wikramaratna1, Marta Giovanetti4,5, Robert Paton1,
Paul Klenerman6, Craig Thompson1, Sunetra Gupta1 & José Lourenço1,7*
For endemic pathogens, seroprevalence mimics overall exposure and is minimally influenced by the
time that recent infections take to seroconvert. Simulating spatially-explicit and stochastic outbreaks,
we set out to explore how, for emerging pathogens, the mix of exponential growth in infection
events and a constant rate for seroconversion events could lead to real-time significant differences
in the total numbers of exposed versus seropositive. We find that real-time seroprevalence of an
emerging pathogen can underestimate exposure depending on measurement time, epidemic doubling
time, duration and natural variation in the time to seroconversion among hosts. We formalise
mathematically how underestimation increases non-linearly as the host’s time to seroconversion is
ever longer than the pathogen’s doubling time, and how more variable time to seroconversion among
hosts results in lower underestimation. In practice, assuming that real-time seroprevalence reflects
the true exposure to emerging pathogens risks overestimating measures of public health importance
(e.g. infection fatality ratio) as well as the epidemic size of future waves. These results contribute to a
better understanding and interpretation of real-time serological data collected during the emergence
of pathogens in infection-naive host populations.
According to well established theoretical epidemiology concepts, a pathogen’s effective transmission potential
is linked to the individual-level protection offered by previous exposure to the pathogen, and thus the current
population-level exposure, or herd-immunity in the host population. Manipulating population level herd-immu-
nity against pathogens, e.g. via vaccination, is a major cornerstone of contemporary epidemiology and public
health efforts towards sustainable control and eradication. While the relationships of exposure with immunity
(protection), and exposure with seropositivity are not necessarily straight-forward and are pathogen-specific,
seroepidemiology to monitor the exposure level to particular pathogens is commonly applied in parallel to clini-
cal and laboratory-based surveillance of new cases1.
During pandemics, real-time discovery, monitoring and control of transmission events is imperative. Case
detection (clinical, laboratory) provides opportunities for real-time contact tracing and quarantine efforts towards
elimination of transmission clusters2–7, but it can critically suffer from biases that arise from variation in health-
seeking behaviours, health system infrastructure and capacity, symptomatic rates of infection, etc. While valuable
insights such as the case fatality ratio can be obtained from case data, serology can ultimately resolve uncertainty
around the true number of past infections. It can thus help define better denominators for other measures of
public health importance, such as the infection fatality ratio and transmission-related parameters that serve as
input to epidemiological models that guide decision-making (e.g. R0, Re). Examples from recent pandemics
include the use of serology for estimation of H1N1pdm age-specific infection leading to adequate denominators
for fatality, risk and symptomatic r ates8, the revision from high to low ZIKV-associated risk of microcephaly once
serology confirmed extremely high levels of local exposure to the virus (e.g.9, also predicted by m odelling10,11),
1
Department of Zoology, University of Oxford, Oxford, UK. 2School of Public Health, Tel Aviv University, Tel Aviv,
Israel. 3Porter School of the Environment and Earth Sciences, Tel Aviv University, Tel Aviv, Israel. 4Laboratório
de Genética Celular e Molecular, Universidade Federal de Minas Gerais, Belo Horizonte, Brazil. 5Laboratório
de Flavivírus, Instituto Oswaldo Cruz Fiocruz, Rio de Janeiro, Brazil. 6Nuffield Department of Medicine, Peter
Medawar Building for Pathogen Research, Oxford, UK. 7These authors contributed equally: Francesco Pinotti and
José Lourenço *email: jose.lourenco@zoo.ox.ac.uk
Scientific Reports | (2021) 11:5825 | https://doi.org/10.1038/s41598-021-84672-1 1
Vol.:(0123456789)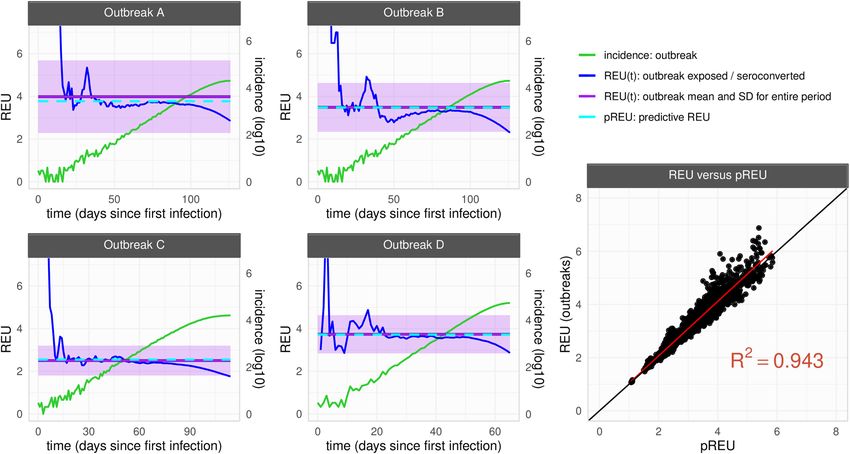
www.nature.com/scientificreports/
Meaning Range Default
nC Population structure (nC2) 1, 100, 144, 289, 400, 900 1 (homogeneous)
R0 Basic reproduction number 2.0, 2.5, 3.0, 3.5, 4.0 2.0
Ŵs Shape of time to seroconversion distribution 1, 3, 6, 10, 100 1 (exponential-like)
Ŵm Mean of time to seroconversion distribution 1, 7, 14, 21, 28, 35, 42 14 (days)
σ 1/σ = infectious period 0.2, 0.3, 0.4, 0.5, 0.6 0.2 (5 days)
δ 1/ δ = incubation period 0.2, 0.3, 0.4, 0.5, 0.6 0.3 (3 days)
β Transmission rate, obtained from β = R0(δ + µ)(σ + µ)/δ – –
1/µ Average-life span (see Supplementary File 1 for details) – 64 years
N Total population size 1M 1 M (individuals)
Table 1. Model parameters.
and the search for neutralizing antibodies (and protection) against SARS-CoV-2 in particular clinical or popula-
tion sub-groups12,13.
By providing means of assessing the current level of exposure to an emerging pathogen, serology also informs
on the likelihood of secondary epidemic waves, and can be used to quantify the (cost-)effectiveness of reducing
transmission with non-pharmaceutical interventions such as personal protective equipment usage, social distanc-
ing, school closure, travel bans and more generally, societal lockdown. In practice, serology carries a number of
challenges which are particularly acute for emerging p athogens1,14–16. For instance, capacity for serological testing
is unlikely to be developed or optimised soon after pathogen emergence, with early methods more likely to suffer
from specificity and sensitivity issues leading to both under and overestimation of exposure—a major concern in
the ongoing SARS-CoV-2 pandemic16. Early in emerging epidemics, targeted cohorts for serological surveys are
also less likely to be representative of the overall population, as limits in capacity and infrastructure or clinical
properties of the new pathogen may dictate priority testing for particular groups in society. An assumption of
zero seroprevalence (and of no immunity) before emergence of the novel pathogen may also be problematic, since
many pathogens with pandemic potential are genetically related to endemic human pathogens—a fact evidenced
by some of the large epidemics of this century, e.g. ZIKV, H1N1pdm, SARS-CoV, MERS-CoV, and SARS-CoV-2.
Perhaps due to its minor role in the relationship between exposure and seroprevalence for endemic patho-
gens, a major challenge for interpretation of serological data that is rarely discussed in the context of emerging
pathogens is time to seroconversion. For endemic pathogens with a long history of local circulation, the number
of recently infected individuals is typically orders of magnitude smaller than the cumulative number of exposed.
As such, seroprevalence mimics overall exposure and is minimally influenced by the time that recent infections
will take to seroconvert. In contrast, for newly emerging pathogens, a mix of exponential growth in infection
events with a constant rate for seroconversion events could lead to differences in the total numbers of exposed
versus seropositive.
In this study we use a mathematical model of transmission to explore the theoretical, real-time relationship
of exposure and seroprevalence during the emergence of a novel pathogen into an infection-naive host popu-
lation. We describe and formalize how epidemic growth and time to seroconversion, independently of other
epidemiological parameters, can be used to summarize the expected level of underestimation of exposure from
real-time seroprevalence data alone.
Materials and methods
Epidemiological framework. We developed an individual-based model that follows an susceptible-
exposed-infectious-recovered (SLIR) epidemiological framework for the transmission of a directly transmitted
pathogen. Individuals are born susceptible (S), can acquire infection experiencing an incubation period (L)
followed by an infectious period (I), after which recovery from infection gives life-long immunity (R). Serocon-
version is modelled separately from transmission dynamics, with time to seroconversion (T2S) after infection
assumed to follow a Gamma distribution with mean Ŵm and shape Ŵs (with Ŵs → 1 resulting in exponential-like
distributions and Ŵs → ∞ resulting in bell-shaped distributions with small variance). We assume that the emer-
gent pathogen is not (sero) cross-reactive with endemic pathogens, and that there has been no exposure in the
population before the simulated introduction (i.e. seropositivity is zero before pathogen emergence). Mortality
is age-dependent and population size is kept constant with each death being replaced by a newborn. The frame-
work is stochastic, the time unit is set to one day. A spatial dimension is modelled using a 2D meta-population
of nC = C 2 (host communities). The host population is divided equally into each community Ci . Individuals of
a community Ci are assumed to mix homogeneously within Ci and with individuals in neighbouring communi-
ties (left, right, up and down of Ci). Thus, between community transmission is modelled only locally. The force
of infection to individuals of community Ci is λi = β(Ii + Ij )/(Ni + Nj ) where β is the transmission rate, Ii is the
number of infectious individuals in community i, Ij the sum of infectious individuals in the neighbouring com-
munities, Ni the population size of community i, and N j the sum of the population sizes of the neighbouring com-
munities. Parameters are summarised in Table 1 and further framework details on time to seroconversion and
age-dependent mortality can be found in Supplementary File 1.
Scientific Reports | (2021) 11:5825 | https://doi.org/10.1038/s41598-021-84672-1 2
Vol:.(1234567890)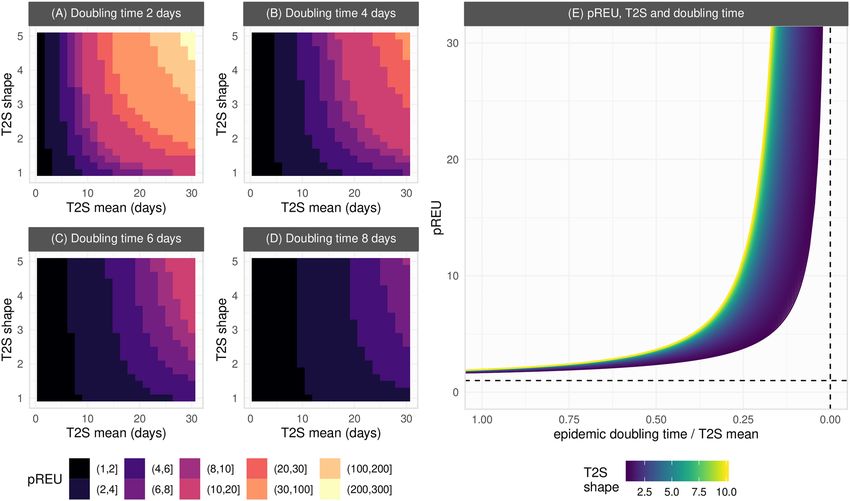
www.nature.com/scientificreports/
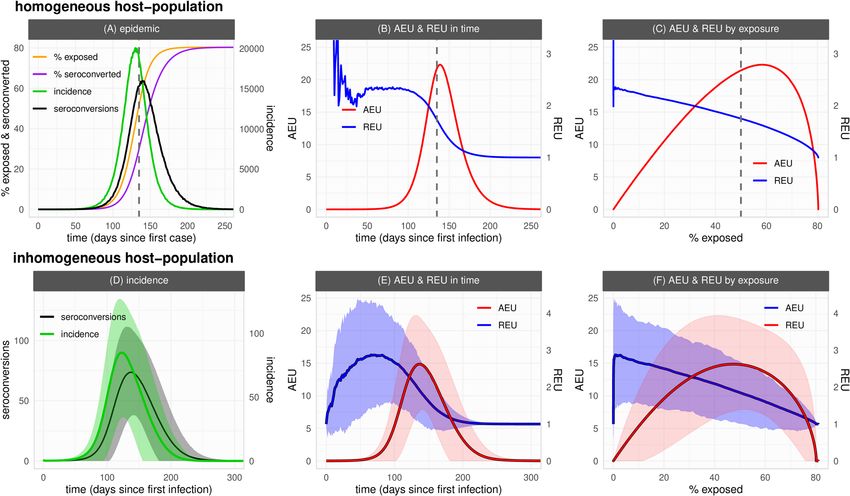
Figure 1. General seroepidemiological dynamics in both an homogeneous and inhomogeneous host-
population. (A) Time series of cumulative incidence (exposed, orange), cumulative seroconverted (purple),
incidence (green) and seroconversion (black) daily events. (B, C) Relative exposure underestimation (REU,
blue) and absolute exposure underestimation (AEU, red) dependent on time (B) and the percent exposed
(C). Outbreak simulated with parameters as default in Table 1. (D) Time series of incidence (green) and
seroconversion (black) daily events. (E, F) REU (blue) and AEU (red) dependent on time (E) and the percent
exposed (F). (A–C) Vertical dashed line marks the day in which the theoretical herd-immunity threshold is
reached. Curves present the output of a single stochastic simulation. (D–F) Lines are the mean and areas the
standard deviation of model output across all communities of the meta-population among 100 outbreaks
simulated with parameters as default in Table 1 except nC = 144 (122 lattice).
Measuring exposure underestimation from seroprevalence. In model simulations, the time varying
cumulative number of individuals that have already been exposed (expo(t) = L + I + R, or expo(t) = 1 − S) and
the number of individuals seroconverted (sero(t)) are known. As detailed below, depending on the stage of the
simulated epidemic and model parameters, the number of seroconverted underestimates the number of exposed.
We measure the underestimation of exposure by current seroprevalence in two ways: (1) the ratio between the
exposed and seroconverted (relative exposure underestimation: REU) REU(t) = expo(t)/sero(t) (expression 1),
and (2) the difference between the percent of exposed and percent seroconverted (absolute exposure underestima-
tion: AEU) AEU(t) = (100/N)[expo(t) − sero(t)] (expression 2), or AEU(t) = (100/N)sero(t)[REU(t) − 1].
Let Ŵ(τ ) be the host’s distribution of time to seroconversion (T2S) after infection. Then, the cumulative sero-
converted sero(t)
t can be expressed as the convolution of T2S Ŵ(τ ) and the cumulative exposed expo(t), formalized
as sero(t) = 0 Ŵ(τ )expo(t − τ )dτ . During the period of exponential growth of the outbreak expo(t) = expo(0)ert
t
with growth rate r , such that sero(t) = expo(0) 0 Ŵ(τ )e(t−τ ) dτ . As detailed above, we define REU(t) as the ratio
t
between the cumulative exposed expo(t) and seroconverted sero(t), and thus REU(t) = 1/ 0 Ŵ(τ )e−rτ dτ .
From here, we used the moment generating function of Ŵ(τ ), to obtain the (mean) predictive REU expression
pREU = 1/(r(Ŵm/ Ŵs) + 1)−Ŵs (expression 3) valid for the exponential phase of an outbreak. The predictive
REU expression can also be expressed dependent on the ratio between epidemic doubling time ( DT ) and mean
time to seroconversion Ŵm, as pREU = 1/(a/(φŴs) + 1)−Ŵs (expression 4), with DT = a/r , φ = DT/ Ŵm and
a = ln(2).
Estimation of exponential growth from simulated epidemics. A phenomenological model of
exponential growth c(t) = C0 ert (expression 5) was used to estimate the growth rate from simulated outbreaks,
where c(t) is cumulative incidence, r the growth rate, t time, and C0 the initial number in the cumulative series.
The growth r was obtained via maximum likelihood estimation using the optim function in R (default parame-
ters and method set to BFGS) and a negative log-likelihood of the data given the model defined using a negative-
binomial distribution.
Scientific Reports | (2021) 11:5825 | https://doi.org/10.1038/s41598-021-84672-1 3
Vol.:(0123456789)www.nature.com/scientificreports/
Results
Seroepidemiological dynamics and exposure underestimation. We start by describing our frame-
work’s seroepidemiological dynamics for a first epidemic wave of a novel emerging pathogen in an homogene-
ously mixing host-population (Fig. 1A–C, default parameter set as in Table 1). As expected from classic SLIR
theory, incidence evolves into a bell-shaped curve that peaks at the theoretical herd-immunity threshold 1–1/
R0. Up to the outbreak’s peak, both the number of daily incidence and seroconversion events increase (Fig. 1A).
However, as the daily incidence starts to grow exponentially, seroconversion as dictated by a constant rate
defined by the distribution of time to seroconversion (T2S) grows slower. Differences between the percent of the
population already exposed and the percent already seroconverted (seroprevalence) thus accumulate in time.
Later in the epidemic the exposed and seroconverted converge to the same percent as incidence events slow
down and seroconversion events catch up. As such, depending on the outbreak’s stage, seroprevalence may not
represent a population’s current level of exposure of a novel emerging pathogen.
The level of underestimation of exposure by seroprevalence in this first epidemic wave is summarised in
Figs. 1B,C, when measured by the difference between the percent of exposed and seroconverted (AEU, absolute
exposure underestimation), and by the ratio between the exposed and the seroconverted (REU, relative exposure
underestimation). In absolute terms (AEU), underestimation follows epidemic progression, increasing mono-
tonically up to just after the theoretical herd-immunity threshold is reached, and declining thereafter (Fig. 1B).
In relative terms (REU), underestimation can be initially erratic due to stochasticity and low number of events,
but is maintained well above one during the period of epidemic growth, later converging to one (i.e. no under-
estimation) as the outbreak slows down after the theoretical herd-immunity threshold (Fig. 1C).
In this stochastic framework each simulation is expected to present variation in outbreak dynamics. When
considering the spatial dimension, communities in the meta-population will also present variation. We thus
looked at relative and absolute underestimation of exposure by seroprevalence when considering many inde-
pendent runs of the framework within an inhomogeneous population (Fig. 1D–F). The variation in incidence
and seroconversion events among the independent runs and communities (Fig. 1D) resulted in considerable
variation in REU and AEU (Figs. 1E,F), with mean dynamic output similar to that described for the homogene-
ous scenario (Figs. 1A–C). As described above, either type of underestimation had its maximum during different
stages of the epidemic, with REU peaking earlier during growth and AEU later near the peak.
Summarizing exposure underestimation during epidemic growth. The results of Fig. 1 offer
insights into how real-time seroprevalence during the first epidemic wave of a novel emerging pathogen can
lead to significant underestimation of exposure. To characterise underestimation during epidemic growth, we
introduce the predictive REU (pREU) summary measure (expressions 3–4). pREU predicts the mean under-
estimation of exposure by seroprevalence during the epidemic growth phase of an emerging pathogen into an
infection-naive host population, given priors on an outbreak’s growth rate and the distribution of time to sero-
conversion (T2S).
In a sensitivity exercise, we simulated a multitude of outbreaks by varying the framework’s parameters,
and for each outbreak we compared pREU with the real outbreak REU. Keeping parameters otherwise set to
default (Table 1), we considered N = 100 outbreaks for each unique value of the parameters nC (meta-population
structure), R0, Ŵm (T2S mean) and Ŵs (T2S shape) (as in the Range column of Table 1 giving a total of N = 3100
outbreaks). The growth rate r of each outbreak was obtained by fitting the phenomenological model (expression
5) to the cumulative number of exposed between the time of first incidence event and outbreak peak. pREU was
calculated from expression 3 using r , Ŵm and Ŵs.
All parameters had an impact on an outbreak’s REU (for the independent effects of each parameter see
Figs. S3–7). In Fig. 2, four outbreak examples are presented, for which pREU is seen to approximate an outbreak’s
mean REU between the time of first infection and outbreak peak. When comparing all pREU and REU from the
N = 3100 outbreaks, pREU could explain ~ 94% of REU’s variation among the outbreaks generated with different
host–pathogen characteristics (for the independent effects of each parameter see Figs. S8–11).
Owing to a multitude of factors (e.g. public health system, existing technology), capacity for serology test-
ing and thus quantification of seroprevalence is likely to be better established during a second epidemic wave
of an emerging pathogen, if not later. The introduced pREU summary measure applies to periods of epidemic
growth independently of whether these are in first or subsequent outbreaks. It is thus able to predict the level of
underestimation of exposure by seroprevalence during the growth phase of a second epidemic wave, whether it
is larger (Fig. S12) or smaller (Fig. S13) than the first epidemic wave.
Generalizing exposure underestimation during epidemic growth. Novel emerging pathogens can
present significant differences in a number of epidemiological factors, such as the infectious period, transmis-
sion potential or even the mode of transmission (e.g. ZIKV versus SARS-CoV-2). Since pREU depends solely
on the T2S distribution and observed epidemic growth, it allows to characterise a range of possible theoretical
scenarios for an epidemic wave of a novel emerging pathogen independently of details about the aforementioned
epidemiological factors. By varying the doubling time and the T2S distribution, we thus characterised pREU’s
sensitivity (expression 4) to a variety of possible outbreaks by any emerging pathogen.
As summarised in Fig. 3A–D (full output in Fig. S14), pREU is the smallest for shorter times to seroconver-
sion (smaller T2S mean). In contrast, the largest pREU is expected for combinations of longer (larger T2S mean)
and less variable (larger T2S shape) time to seroconversion. As variation in seroconversion times among hosts
is increased (decreasing T2S shape), pREU becomes less sensitive to the T2S mean (an effect driven by a larger
proportion of hosts seroconverting earlier than the mean of the population). Overall, shorter epidemic doubling
Scientific Reports | (2021) 11:5825 | https://doi.org/10.1038/s41598-021-84672-1 4
Vol:.(1234567890)www.nature.com/scientificreports/
Figure 2. Summarizing exposure underestimation during epidemic growth. (left) Examples of simulated
outbreaks (A–D) with parameter variations from the default parameter set (Fig. 1A–C, Table 1). Outbreak
A with Ŵm = 28. Outbreak B with Ŵs = 6. Outbreak C with nC = 100. Outbreak D with R0 = 3.5. For each,
the outbreak’s REU(t) (blue), incidence (green), REU mean and standard deviation for the entire time period
(purple) and pREU (cyan) are presented. Time period considered is from the first case to outbreak peak. (right)
Mean REU of each outbreak (N = 3100) and pREU shown with a linear regression with R-squared = 0.943.
times (Fig. 3A) increase the sensitivity of pREU to both the T2S mean and shape, favouring higher underestima-
tion of exposure by seroprevalence.
pREU’s sensitivity to properties of seroconversion time and epidemic doubling time are further illustrated in
Fig. 3E when summarizing the relative duration of the two time variables. pREU is smaller when the epidemic
doubling time is close to the seroconversion time, but it can quickly become large when seroconversion time is
ever longer than the doubling time. The effect of seroconversion time distributions with more variance (smaller
T2S shape) in reducing pREU is also seen to be significant, but this effect can be lost as seroconversion time
becomes longer than the epidemic doubling time.
Discussion
Until recently, seroepidemiology has mainly focused on endemic pathogens with a long history of circulation.
Practical uses of serology have v aried1, from informing on immunity thresholds for elimination and monitor-
ing importation after eradication (e.g. Polio), to comparing country-level burdens of disease for international
cooperation or helping draft vaccination strategies. With the recent occurrence of large epidemics and pandemics
(e.g. H1N1pdm, ZIKV, SARS-CoV, SARS-CoV-2), serology has also been established to sentinel pathogens with
future pandemic potential17,18, to quantify post-pandemic attack rates9,19, or to estimate epidemiological variables
of interest for decision-making during epidemics8,20. In these scenarios characterised by the need for real-time
output, seroepidemiology has faced novel challenges, including capacity and test accuracy requirements. A less
explored but equally relevant challenge for real-time seroepidemiology of emerging pathogens is the time to
seroconversion, which we have here explored in a theoretical framework.
We looked at underestimation of exposure by seroprevalence based on measures of both relative (REU) and
absolute (AEU) difference between exposure and seroprevalence in simulated outbreaks of a novel pathogen
spreading in infection-naive populations. These types of underestimation provide complementary insights into
the real-time seroepidemiology of an emerging pathogen. REU demonstrates that exposure during epidemic
growth can be larger than that measured by seroprevalence by a factor X, such that epidemiological measures
that require denominators based on total number of infectious could be overestimated by the same factor X when
assuming that real-time seroprevalence represents true exposure. Examples of such measures that are critical for
capacity and response during pandemics are the infection fatality ratio or the infection hospitalization r atio21.
In contrast, AEU demonstrates that the largest absolute errors can be made when estimating exposure from
real-time seroprevalence at epidemic peaks, whether the latter are generated naturally by reaching the herd-
immunity threshold, or by control initiatives suppressing transmission. Such absolute errors can be impactful on
decision-making dependent on extrapolation of the level of herd-immunity achieved during the first epidemic
wave. For example, modelling approaches informed by real-time seroprevalence measures near the observed first
Scientific Reports | (2021) 11:5825 | https://doi.org/10.1038/s41598-021-84672-1 5
Vol.:(0123456789)www.nature.com/scientificreports/
Figure 3. Generalizing exposure underestimation during epidemic growth. (A–D) Each heatmap of pREU
is for an epidemic doubling time (panel title) and combinations of T2S mean and shape (smaller shapes imply
larger variance in responses among hosts). The color scale is discretized for visualization. (E) Sensitivity
of pREU when varying doubling time, T2S mean and shape. Dashed lines present the limits pREU = 1 and
doubling time / T2S mean = 0. T2S mean varied from 1 to 100, T2S shape from 1 to 10, doubling time 1 to 100.
epidemic peak, risk overestimating the potential of secondary epidemic waves by assuming that seroprevalence
reflects the current levels of exposure (i.e. herd-immunity).
Restricting study time to the period of epidemic growth, we were able to formalize how the combination of
time to seroconversion (T2S) and epidemic growth independently of other epidemiological factors, can predict
mean REU. This formulation allowed us to explore the sensitivity of real-time underestimation of exposure by
seroprevalence in a generalised form, applicable to any epidemic wave of a theoretical emerging pathogen. We
show that REU is expected to be ever smaller the more similar T2S is to epidemic doubling time, but critically
increasing non-linearly as T2S increases relative to the doubling time. REU is also highly sensitive to variations
in T2S mean and variance for fast growing outbreaks. As such, newly emerging pathogens that are characterised
by short generation times and high transmissibility can have exposure significantly underestimated by real-time
seroprevalence. When the variance of T2S among hosts is large, REU is generally lower and less sensitive to mean
T2S, a result of large proportions of exposed hosts seroconverting much earlier than the T2S mean. Emerging
pathogens characterised by large T2S variation among hosts will thus, generally, suffer from less underestimation
of exposure by real-time seroprevalence.
For emerging pathogens, serology has the critical potential of validating and correcting estimates obtained
by other methods on ongoing attack rates, symptomatic rates and accumulated herd-immunity within particular
groups or at the population-level. Our generalised modelling exercises demonstrate how, mechanistically, real-
time seroprevalence may underestimate real exposure levels depending on the timing of the measurements, the
epidemic growth of the pathogen, and the distribution of time to seroconversion among hosts. These theoretical
insights contribute to a better understanding and interpretation of real-time serological data collected during
the emergence of pandemic pathogens.
Limitations and future work
In this study we make a number of simplifying assumptions over the modelling framework. For example, we have
used exponentially distributed periods for infection and incubation, that although are common practice in mod-
elling exercises, may violate the real distributions of some emerging pathogens. We have also modelled a purely
theoretical host-population structure (2D von Neumann lattice) akin to those used in classic meta-population
studies. With it, we were able to show that while significant differences in population structure may affect epi-
demic progression, our main conclusions on real-time seroprevalence still hold. Host turnover (birth, deaths) has
been included in the modelling framework for completion, but we note here that given the time scale analysed
in our results (< 2 years), its effect on the main conclusions is negligible. In some of the sensitivity exercises we
Scientific Reports | (2021) 11:5825 | https://doi.org/10.1038/s41598-021-84672-1 6
Vol:.(1234567890)www.nature.com/scientificreports/
simulate temporary reductions in the transmission rate of the emerging pathogen. These were performed with the
aim of demonstrating that underestimation of exposure by seroprevalence can be present in subsequent epidemic
waves, and not with the intention of demonstrating the effects of regional non-pharmaceutical interventions such
as the ones implemented during the SARS-CoV-2 pandemic. We further assume that transmission and incubation
is uniform across all hosts, but it is also possible that emerging pathogens may present variation among hosts,
e.g. across ages, as is the case of SARS-CoV-2. Finally, we explore scenarios characterised by the emergence of
a pathogen for which exposure equates to both immunity (protection) and detectable seropositivity. In reality,
an emerging pathogen may face a non-zero herd-immunity (protection) landscape, may not induce life-long
protection, and may (sero) cross-react with endemic pathogens. Under such alternative scenarios, there should
be added uncertainty on how real-time seroprevalence may reflect real exposure levels.
Given the mathematical complexity of the problem explored, a final limitation of the current study is related to
not offering a mathematical formulation for direct quantification of both the relative (REU) and absolute (AEU)
difference between exposure and seroprevalence of an emerging pathogen. The general conclusion, presented
over sensitivity analyses of the mathematical formulation of predictive REU (pREU) during epidemic growth, is
amenable to be trivial to modellers of infectious disease transmission. Nonetheless, this study is unique in that
it offers a demonstration on how, mechanistically, the underlying processes of transmission and seroconversion
dictate an expected underestimation of exposure by real-time seroprevalence. This last point should be of par-
ticular value to non-modellers with interest in seroepidemiology and its relevance for real-time public health
policy of emerging pathogens.
pREU remains nonetheless as a useful public health tool to estimate the ongoing underestimation of expo-
sure by seroprevalence in future outbreaks. This is particularly the case for pathogens that, although endemic in
some regions of the world, occasionally get introduced somewhere else. For such pathogens, means of testing
for seropositivity may already exist before the occurrence of first epidemic waves in new locations, infection may
provide life-long immunity, and (sero) cross-reactivity to endemic pathogens may be negligible. One example
of the past decade includes the dengue virus serotype 1 (DENV1) outbreak in the Island of Madeira (Portugal,
2012). If seroepidemiology studies would have been performed during the emergence of the virus, pREU could
have been used to correct real-time seroprevalence into real exposure levels. Together with DENV, other candi-
date mosquito-borne pathogens for which pREU may be useful for seroepidemiology include the Chikungunya
virus (CHIKV) and ZIKV, for which ongoing climate and globalisation trends predict that future introductions
into new locations will become ever more frequent.
Within the controlled setting defined by the simplifying assumptions and limitations described above, we were
able to generalise the dynamics of real-time seroepidemiology for a theoretical pathogen. In general, our results
are a subset of possible realities of the levels of exposure underestimation that may arise from real-time sero-
prevalence, and should therefore be interpreted in the context of the controlled setting they are obtained from.
Data availability
There is no data on this article.
Received: 8 September 2020; Accepted: 16 February 2021
References
1. Cutts, F. T. & Hanson, M. Seroepidemiology: an underused tool for designing and monitoring vaccination programmes in low- and
middle-income countries. Trop. Med. Int. Health 21, 1086–1098 (2016).
2. Bi, Q. et al. Epidemiology and transmission of COVID-19 in 391 cases and 1286 of their close contacts in Shenzhen, China: a
retrospective cohort study. Lancet. Infect. Dis https://doi.org/10.1016/s1473-3099(20)30287-5 (2020).
3. Ferretti, L. et al. Quantifying SARS-CoV-2 transmission suggests epidemic control with digital contact tracing. Science https://
doi.org/10.1126/science.abb6936 (2020).
4. Kwok, K. O. et al. Epidemic models of contact tracing: systematic review of transmission studies of severe acute respiratory syn-
drome and middle east respiratory syndrome. Comput. Struct. Biotechnol. J. https://doi.org/10.1016/j.csbj.2019.01.003 (2019).
5. Swaan, C. M., Appels, R., Kretzschmar, M. E. E. & van Steenbergen, J. E. Timeliness of contact tracing among flight passengers for
influenza A/H1N1 2009. BMC Infect. Dis. 11, 355 (2011).
6. Fraser, C., Riley, S., Anderson, R. M. & Ferguson, N. M. Factors that make an infectious disease outbreak controllable. Proc. Natl.
Acad. Sci. U S A 101, 6146–6151 (2004).
7. Böhmer, M. M. et al. Investigation of a COVID-19 outbreak in Germany resulting from a single travel-associated primary case: a
case series. Lancet. Infect. Dis https://doi.org/10.1016/s1473-3099(20)30314-5 (2020).
8. Riley, S. et al. Epidemiological characteristics of 2009 (H1N1) pandemic influenza based on paired sera from a longitudinal com-
munity cohort study. PLoS Med. 8, e1000442 (2011).
9. Netto, E. M. et al. High Zika Virus seroprevalence in salvador, Northeastern Brazil limits the potential for further outbreaks. MBio
https://doi.org/10.1128/mBio.01390-17 (2017).
10. Lourenço, J. et al. Epidemiological and ecological determinants of Zika virus transmission in an urban setting. Elife https://doi.
org/10.7554/eLife.29820 (2017).
11. Ferguson, N. M. et al. EPIDEMIOLOGY. Countering the Zika epidemic in Latin America. Science 353, 353–354 (2016).
12. Fafi-Kremer, S. et al. Serologic responses to SARS-CoV-2 infection among hospital staff with mild disease in eastern France.
EBioMedicine https://doi.org/10.1101/2020.05.19.20101832 (2020).
13. Thompson, C. et al. Neutralising antibodies to SARS coronavirus 2 in Scottish blood donors - a pilot study of the value of serology
to determine population exposure. medRxiv https://doi.org/10.1101/2020.04.13.20060467 (2020).
14. Simonsen, J. et al. Usefulness of seroconversion rates for comparing infection pressures between countries. Epidemiol. Infect. 139,
636–643 (2011).
15. Larremore, D. B. et al. Estimating SARS-CoV-2 seroprevalence and epidemiological parameters with uncertainty from serological
surveys. medRxiv https://doi.org/10.1101/2020.04.15.20067066 (2020).
16. Takahashi, S., Greenhouse, B. & Rodríguez-Barraquer, I. Are SARS-CoV-2 seroprevalence estimates biased?. J. Infect. Dis. https
://doi.org/10.31219/osf.io/y3fxt (2020).
Scientific Reports | (2021) 11:5825 | https://doi.org/10.1038/s41598-021-84672-1 7
Vol.:(0123456789)www.nature.com/scientificreports/
17. Wille, M. et al. Serologic evidence of exposure to highly pathogenic avian influenza H5 viruses in migratory shorebirds, Australia.
Emerg. Infect. Dis. 25, 1903–1910 (2019).
18. Pinsent, A., Blake, I. M., White, M. T. & Riley, S. Surveillance of low pathogenic novel H7N9 avian influenza in commercial poultry
barns: detection of outbreaks and estimation of virus introduction time. BMC Infect. Dis. 14, 427 (2014).
19. Miller, E. et al. Incidence of 2009 pandemic influenza A H1N1 infection in England: a cross-sectional serological study. Lancet
https://doi.org/10.1016/s0140-6736(09)62126-7 (2010).
20. Laurie, K. L. et al. Influenza serological studies to inform public health action: best practices to optimise timing, quality and
reporting. Influenza Respir. Viruses https://doi.org/10.1111/j.1750-2659.2012.0370a.x (2013).
21. Spychalski, P., Błażyńska-Spychalska, A. & Kobiela, J. Estimating case fatality rates of COVID-19. Lancet Infect. Dis. https://doi.
org/10.1016/S1473-3099(20)30246-2 (2020).
22. Bryant, J. E. et al. Serology for SARS-CoV-2: apprehensions, opportunities, and the path forward. Sci. Immunol. https://doi.
org/10.1126/sciimmunol.abc6347 (2020).
Acknowledgements
FP was funded by the UKRI GCRF One Health Poultry Hub (Grant No. BB/S011269/1), one of twelve interdis-
ciplinary research hubs funded under the UK government’s Grand Challenge Research Fund Interdisciplinary
Research Hub initiative. PK was supported by WT109965MA, an NIHR Senior Fellowship and the NIHR Bio-
medical Research Centre, Oxford. The views expressed by PK are the author’s and are not necessarily those of the
NIHR. JL was supported by a Lectureship from the Department of Zoology, University of Oxford. MG received
funding from Fundação de Amparo à Pesquisa of Rio de Janeiro state (FAPERJ). SG acknowledges funding from
the ERC ‘UNIFLUVAC’ (812816) and MRC CiC 6 as well the Georg und Emily Von Opel Foundation. UO and
CT declare no funding. The authors declare no conflicts of interest.
Author contributions
F.P., U.O. and J.L. conceived the idea. F.P. and J.L. developed the model. F.P., O.U., P.W., M.G., R.P., C.T. and J.L.
analysed model output and conceived the visualisation of results. F.P. and J.L. led the writing, with contributions
of U.O., P.K., C.T. and S.G. All authors contributed to text revisions and accepted the submitted version.
Competing interests
The authors declare no competing interests.
Additional information
Supplementary Information The online version contains supplementary material available at https://doi.
org/10.1038/s41598-021-84672-1.
Correspondence and requests for materials should be addressed to J.L.
Reprints and permissions information is available at www.nature.com/reprints.
Publisher’s note Springer Nature remains neutral with regard to jurisdictional claims in published maps and
institutional affiliations.
Open Access This article is licensed under a Creative Commons Attribution 4.0 International
License, which permits use, sharing, adaptation, distribution and reproduction in any medium or
format, as long as you give appropriate credit to the original author(s) and the source, provide a link to the
Creative Commons licence, and indicate if changes were made. The images or other third party material in this
article are included in the article’s Creative Commons licence, unless indicated otherwise in a credit line to the
material. If material is not included in the article’s Creative Commons licence and your intended use is not
permitted by statutory regulation or exceeds the permitted use, you will need to obtain permission directly from
the copyright holder. To view a copy of this licence, visit http://creativecommons.org/licenses/by/4.0/.
© The Author(s) 2021
Scientific Reports | (2021) 11:5825 | https://doi.org/10.1038/s41598-021-84672-1 8
Vol:.(1234567890)You can also read