No 30 - May 2018: The economics and management of flood risk in Germany Volker Meyer, Reimund Schwarze - Reimund Schwarze, European University ...
←
→
Page content transcription
If your browser does not render page correctly, please read the page content below
No 30 – May 2018:

The economics and management of flood risk in
Germany

Volker Meyer, Reimund Schwarze

Contact:

Reimund Schwarze, European University Viadrina, Große Scharrnstr. 59,
Frankfurt (Oder) 15230, Germany.e-mail: schwarze@europa-uni.de
The economics and management of flood risk in Germany
Volker Meyer1, Reimund Schwarze1,2*

1
 Department of Economics, Helmholtz Centre for Environmental Research – UFZ, Permoserstr.
15, Leipzig 04318, Germany,

2
    European University Viadrina, Große Scharrnstr. 59, Frankfurt (Oder) 15230, Germany.

* Corresponding author; e-mail: schwarze@europa-uni.de

Abstract

Assessing the economic impacts of flooding is a crucial part of identifying appropriate
flood risk management options as required by the EU flood management directive. This
chapter describes methods for assessing economic flood damage. To begin, some fun-
damental issues are discussed: Which types of economic flood damage should be taken
into account? What kind of information is necessary in general for assessing flood dam-
age in monetary terms and what is the general procedure for calculating economic flood
damage? Having clarified these questions, the methodological challenges posed by eco-
nomic flood risk management are described. This includes the indirect impacts, i.e. in-
duced loss to customers and suppliers of good and services damaged by floods, and in-
tangible impacts, i.e. the impacts of flooding on mortality and morbidity and the
environment. Ways to deal with the persistent uncertainty in damage and risk assess-
ments are discussed in the following chapter. The findings in this chapter will be evaluat-
ed in relation to flood risk management practices in Germany, based on examples from
Saxony.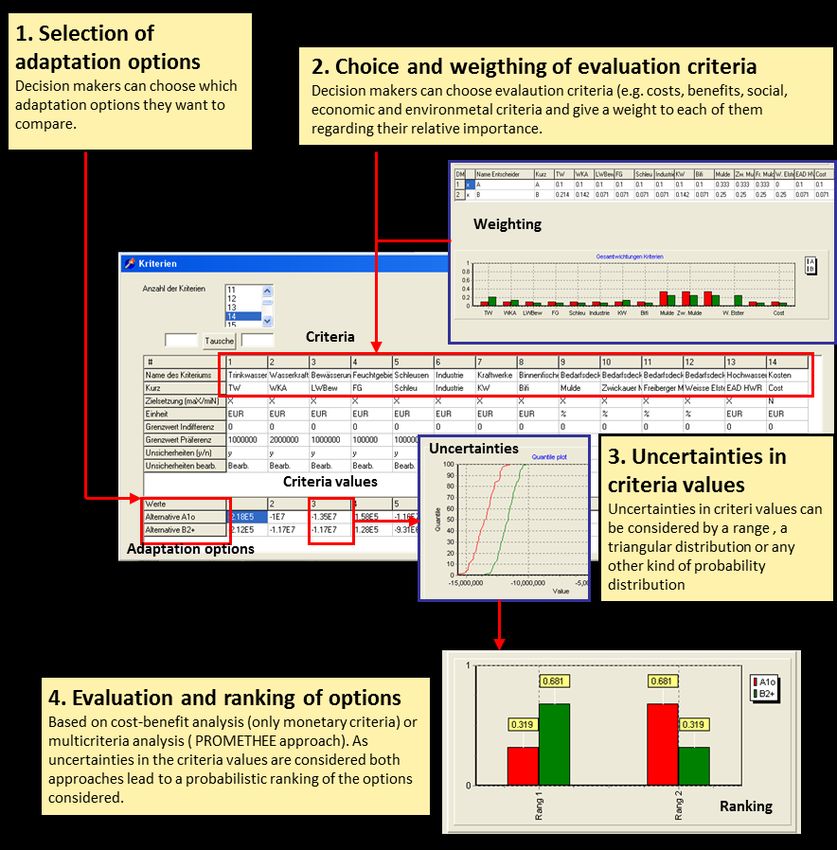
1 Introduction
   Natural disasters can have serious impacts on human welfare, even in regions of the
world with limited hazard exposure such as Europe. According to Munich Re’s natural ca-
tastrophe database (NatCatService), weather and climate related extremes in Europe, in-
cluding storms, river floodings, flash floods and heavy rainfall, have caused economic
damages of between 1 and 18 billion US dollars per incident during the last fifteen years
(2002-2017). Some outstanding events in terms of their economic damage were, for ex-
ample, the Elbe and Danube floods in Germany and other parts of Eastern Europe in
2002 and 2013, with damages of more than 10 billion US dollars (MunichRe 2006; 2014),
and the largely southern European drought of 2003 which caused large-scale loss of life
(about 35,000 fatalities) (MunichRe 2004). Damages and fatalities in China are assumed
to exceed these figures substantially, but they are not as well documented. The well doc-
umented numbers of evacuees, however (1.2 million in the Saomai typhoon of 2006 and
1.6 million in the 2012 flooding in Beijing, Zhang et al. 2012), are evidence that the risk of
natural hazards is much greater in China than in Europe. According to a recent estimate
by Jia et al. (2016), the risk is eight times higher than the global average, meaning a more
than tenfold risk compared to what we find in Europe, which globally speaking has a be-
low-average exposure to natural hazards and resulting economic damages. Such figures
serve to illustrate the global need for better documentation of the risks of natural hazards
and – even more – the need to reduce those risks.
   This chapter presents a number of methods for assessing flood risks in economic
terms. Economic flood damage assessment is a crucial part of the European Union’s new
flood risk management approach (EU 2007). It has since becoming an important part of
decision making for flood risk managers in Germany and other EU member states. Flood
risk assessment provides information about the likely amount and spatial distribution of
expected damages and thus provides decision makers with evidence regarding what ef-
forts are necessary and most effective for reducing these damages. The benefits of risk
reduction measures can be determined by calculating their damage reducing effects,
while the most efficient options can be chosen by means of a cost-benefit analysis.
   In the following, we explain a number of basic methodological aspects of flood damage
assessment (section 2). This includes (1) a categorisation of flood damages and (2) the
general procedure for calculating flood damages. We then identify the methodological
challenges for research and policy making in the case of indirect and non-market related,
intangible damage to human well-being and the ecosystem (section 3). Ways of dealing
with the persistent uncertainties present in flood risk management are subsequently ex-
plained (section 4). Section 5 describes some flood risk management practices in Ger-
many, based on examples taken from Saxony. A few concluding remarks are offered in
section 6.

  2 Basics aspects of economic flood damage assessment
  2.1    Types of economic flood damage
   Flood damage can be differentiated into tangible and intangible damages (Smith and
Ward 1998).
   Tangible damages can be easily measured in monetary terms because of an existing
market for the repair or replacement of damaged assets or the goods and services de-
rived therefrom. Intangible damage refers to loss of goods and services which are not
measurable (or at least not easily measurable) in monetary terms because they are not
traded on a market. Hence, they are also referred to as non-market costs (Smith and
Ward 1998). Intangible effects include, for instance, environmental impacts, health im-
                                                                                            2
pacts and impacts on cultural heritage. Tangible economic flood damages can be subdi-
vided again into direct damages, losses due to business interruption and indirect damag-
es (see Fig. 1).
•buildings
residential
•inventories
•buildings
non-residential •equipment
•stocks
•streets
direct damage infrastructure •railways
•watercousess
cars, vehicles
agricultural •livestock
types of economic products •crops
flood damage
business
interruption
induced losses of
suppliers/customers
indirect damages traffic disruption
emergency services
Fig. 1 Categories of tangible economic flood damage (Source: Adapted from
FLOODSITE Consortium (2007), p.10; own compilation)
Direct damage is damage to property due to physical contact with flood water. The
most important categories of direct tangible damage are damages to buildings and their
inventories. These can be differentiated further into residential properties, i.e. residential
buildings and household goods, and non-residential properties, i.e. buildings used for in-
dustry, commerce or public affairs and their fixed and movable equipment as well as in-
ventories and stocks. Damage to buildings and inventories often represent the largest
proportion of total economic flood damage.1
Another category of direct damage is damage to technical infrastructure such as
streets and railways but also including flood defence infrastructure and watercourses.
Such damage can be considerable, especially in flash flood areas at times of high velocity
flows. In contrast, infrastructure damage to streets and railways is usually low in flood-
plain areas where flow velocities are moderate.
Cars and other vehicles often make up a significant part of the total value of assets at
risk. However, given sufficient warning lead time many of them can be evacuated so that
damages to cars and vehicles are generally comparatively low.
Damage to agricultural goods, such as livestock and crops, also generally make up a
rather low share of total damages2. Crop damage strongly depends on the agricultural
1 In the floodings of Saxony between 36% (2002) and 22.7% (2013) of the total damages were in the resi-
dential sector, i.e. damage to buildings and content damage. Cp. WWF (2007); DKKV (2015), p. 34.
2 In Saxony 2002, only 1.3 % of direct, tangible damage affected agriculture and forest sites (IKSE 2004).season affected while livestock damage is highly correlated with the time available for
evacuation.
Losses due to business interruption in industry, commerce and agriculture occur in
areas directly affected by flooding. When production facilities and offices are flooded,
people are unable to carry out their work until the flood is over and their workplace recon-
structed. In the literature, such losses are sometimes referred to as direct damages, as
they occur due to the immediate impact of floodwater. At the same time, they are often
also referred to as primary indirect damages, because these losses do not result from
physical damage to property but from the interruption of economic processes. However,
the methods used to assess losses due to business interruption are different from those
used for direct and indirect damages respectively. For this reason, and in order to avoid
misunderstandings, “losses due to business interruption” will be taken as a separate cat-
egory.
As a consequence of this categorisation, indirect damage refers only to that economic
damage which is induced either by direct damage or loss due to business interruption.
This includes induced production losses suffered by both suppliers and customers of the
companies affected, the costs of traffic disruption or the costs of emergency services.
While direct damage is often measured as a loss of stock value, losses due to business
interruption as well as indirect damage are frequently assessed as a loss of flow value.3
2.2 General procedure for flood damage assessment
Although the methods for flood damage assessment differ especially with respect to the
different damage categories, four main factors or types of information can be identified
which are crucial for such an assessment in general (Messner et al. 2007):
a) the intensity of inundation
b) the number, type and elevation of properties or business facilities affected
c) their value
d) their susceptibility to inundation
a) First, the intensity of a flood scenario, i.e. its inundation characteristics, is one
crucial factor which determines the degree of flood damage. In this regard, the extent and
depth of inundation are the parameters used most often in damage assessment ap-
proaches. Although the duration, time of occurrence, velocity and toxicological load of
flood water could have a significant influence on damage, they are not often included in
damage models.
b) Second, the number and type of properties or business facilities exposed to a cer-
tain flood event (the assets at risk) provides crucial information for damage assessment.
Such information can be collected by field surveys or by using existing land use data
sources, such as topographic maps. The spatial resolution and level of categorisation of
such data can vary considerably, ranging from broadly aggregated land use information
(e.g. “industrial area”, “residential area”) to detailed information on the type and construc-
tion of every single building or property and its contents.
3
The value of a capital good is the present value of the income flow it generates over the rest of its life span
(Georgescu-Roegen 1981, p. 220 ff.). Therefore, adding stock and flow values in a flood damage evaluation can
lead to double counting (Rose 2004,p. 14, p.19; Bockarjova et al. 2004) and should be avoided.
4c) In order to measure damage in monetary terms, information on the value of assets
at risk needs to be quantified in the third step. This value can be determined either by the
stock value of an asset at a given point in time or by the flow value, i.e. the income flow
that it generates over the rest of its lifetime. Information on stock values for different eco-
nomic sectors can be derived on an aggregate level from official statistics which are then
related to land use categories. For more detailed approaches, object-oriented assess-
ments of buildings and business facilities and their components are often carried out,
based on market values or construction costs.
d) Finally, information is needed on the degree of susceptibility of specific elements at
risk to certain inundation characteristics. Such information is represented by damage
functions. These functions show either the proportion of damage (relative damage func-
tions) or the absolute monetary amount of damages per property (absolute damage func-
tions) of a certain group of elements at risk as a function of the magnitude of certain inun-
dation characteristics. According to the current state of the art, the main inundation
parameter considered in these damage functions is inundation depth (depth-damage
functions). Others (such as velocity, duration, and time of occurrence) are rarely taken in-
to account. As the susceptibility of elements at risk depends on their type and attributes
(e.g. mode of construction), properties of similar types are grouped together and ex-
pressed by a single approximate damage function. The extent of this aggregation and
categorisation varies among the different approaches. Further factors, including the risk
perception of the people in flood prone areas and their preparedness to be flooded, can
also influence the susceptibility of elements at risk and, hence, the potential amount of
flood damage. Up to now, however, such factors have rarely been included in damage
functions.
To calculate the total damage of one flooding scenario, the damage of each affected
unit within the floodplain has to be calculated and added up.
n m
Damage total (valuei , j susceptibi lity i , j )
i 1 j 1
with:
susceptibi lity i , j f (characteristics entityi , j ,
inundation characteristics k , socioecono mic characteristics l ) [%]
i = category of tangible elements at risk (n categories possible)
j = entity in an elements-at-risk category (m entities possible)
k = flood type/specific flood scenario
l = type of socio-economic system
In order to estimate the expected annual damage (or risk) of a certain area, damage es-
timates of different flood events with different probabilities have to be taken into account.
Economic flood risk: From event damage to annual average damage
In the context of flood risk management the term ‘risk’ is understood as the probability of
negative consequences (FLOODsite Consortium 2005; Schanze 2006). By considering
the negative consequences or damages caused by floods for the whole range of probabil-
ities, flood risk can be expressed as the damage expected due to flooding, which is often
called annual average damage. For the practical application of a flood risk assessment,
this means that flood damage has to be estimated for flood events of varying probabilities
in order to construct a damage-probability curve (see Fig. 2). The annual average dam-age is shown by the area or the integral under the curve. An approximation of this area
can be expressed using the following equations (DVWK 1985; Eq. 1 and 2):
k
D Di * Pi (1)
i 1
DPi 1 DPi
Di (2)
2
where D is the annual average damage, Di the mean damage of two known points
on the curve and Pi Pi Pi 1 the probability of the interval between those points.
Flood
Damage
D4
D3
Risk
D2
D1
1/200 1/100 1/20 1/5
Exceedance Probability
Fig. 2 Damage probability curve (Source: own compilation)
2.3 Choice of scale, accuracy and information needs
Apart from this general procedure for calculating flood damage and risk, damage as-
sessment approaches differ considerably in their detail. In terms of their spatial scale and
level of accuracy, the existing methods can be broadly differentiated into macro-, meso-
and micro-scale approaches (Messner et al. 2007).
Macro-scale approaches often rely on land use information with a low spatial resolution
and/or low typological differentiation in order to reduce the effort of analysis. Hence, they
are able to consider large river basins as a whole (see IKSR 2001; Sayers et al. 2002).
Micro-scale approaches (for example Penning-Rowsell et al. 2003; Apel et al. 2009) by
contrast, seek to achieve more accurate results by applying highly detailed land use data
as well as value and susceptibility information. However, this requires more effort, which
often restricts these approaches to small areas.
Meso-scale approaches (for example Klaus and Schmidtke 1990; Kok et al. 2004; Apel
et al. 2009) fit in somewhere between macro- and micro-scale approaches, with regard to
6both accuracy and effort. Hence they are often applied in small or medium-sized river ba-
sins, coastal stretches or dike ring areas.
The meso-scale approach is used here to explain information needs in greater detail (cf.
Fig. 3).
First, the total value of assets at risk (for example, residential assets) and their spatial dis-
tribution is estimated on the basis of data from official statistics which is then assigned to
corresponding land use categories. To begin with, then, the net value of fixed assets in
different economic sectors, including the residential sector, is taken from official statistics,
i.e. the system of national accounting. As these values of fixed assets are often published
only at a national level or at the level of federal states, they have to be disaggregated to
the level of municipalities by using the number of inhabitants (in the case of the residen-
tial sector) or employees (in other economic sectors) as an allocation rule. Asset values
at the municipality level are then assigned to land use categories, which correspond to
the respective sectors. For example, residential asset values are assigned to residential
areas and areas of mixed use. By assigning all values to the corresponding areas in a
Geographic Information System (GIS) and dividing the values by the total area, maps of
the value of assets per square metre can be produced for each sector (cf. Fig. 4.1.2).
Second, relative depth damage functions are used to calculate the damaged percent-
age share of these values, depending on inundation depth. In contrast to micro-scale ap-
proaches, which apply different damage functions for each building type, meso-scale ap-
proaches generally apply only one approximated damage function for each economic
sector. By combining these sectoral depth damage functions with the corresponding as-
set value map and information on the inundation depth of a certain event, it is possible to
estimate the damages caused by this flood event.
Obviously, such meso-scale approaches lead to a much more approximate damage
estimate than micro-scale approaches where the susceptibility of each building type is
considered. Equally, however, they require less effort and hence are more easy to apply
in large scale studies.
Land-use data
value categories value
Map: Asset values
Assets: Mio. Euro
residential assets XXX
Agriculture YYY
Manufacturing ZZZ
Services XYZ
… …
Asset values
Damage functions Damage
Inundation depth
Fig 3 Basic components and necessary information for meso-scale flood damage as-
sessments (Source: own compilation)3 Methodological challenges: Intangible and indirect ef-
fects
After having clarified basic aspects of economic flood damage assessment in the previ-
ous section, we now explain the methodological challenges for research and policy de-
velopment. In line with the findings of the EU’s CONHAZ project4, the focus is on intangi-
ble and indirect economic effects.
3.1 Intangible effects
Intangible or non-market related costs of natural hazards need not necessarily be ex-
pressed in monetary terms in order to be included in decision support frameworks. In a
multi-criteria analysis framework, where they are mostly used in FRM (cf. section5. detail-
ing the case of Saxony), they can be included as non-monetary decision criteria. Alterna-
tively, in the context of a cost effectiveness analysis, they can be treated as a non-
monetary target measure, e.g. cost per life saved. However, to be included in a cost-
benefit analysis framework, intangible costs need to be expressed in monetary terms.
Methods for estimating the monetary value of intangible effects of natural hazards will
have to consider both the use and non-use values that individuals derive from environ-
mental or health goods and services. While use values relate to direct, indirect or even
optional use, non-use values relate to the value individuals derive from simply knowing
that a certain environmental good exists or that it is being preserved for future genera-
tions. Different valuation methods are proposed according to each type of (non-)use value
(cf. Table 1). These methods can be categorised into:
1. revealed preference and
2. stated preference valuation methods.
The accuracy and effectiveness of these valuation methods depend on the availability
and quality of the data (including the quality of the survey design), the available resources
and the decision made in each case on the most appropriate method for estimating in-
tangible effects. Revealed preference methods have the advantage of estimating the val-
ue of a particular good based on actual market behaviour, i.e. ex post. Information ob-
tained from observed behaviour is used to derive an individual’s willingness to pay for an
environmental improvement or for avoiding environmental deterioration. The main re-
vealed preference methods are the following (cf. Pearce and Turner 1990; Hanley and
Spash 1993; Birol et al. 2006):
– travel cost method: recreational or environmental sites are valued by analysing
the observed travel time and expenditure of visitors.
– hedonic pricing method: the value of environmental characteristics is estimated
on the basis of actual market prices, in particular in the housing market.
4 The CONHAZ project, which ran from February 2010 to January 2012 identified knowledge gaps and
research needs based on a review of existing methods for assessing the costs of various natural hazards
in Europe (floods, droughts, coastal hazards and Alpine hazards; for a more detailed discussion see
Meyer et al. 2013).
8– cost of illness approach: costs of health impacts are estimated based on med-
ical costs and wages lost due to illness.
– replacement cost method: the value of an ecosystem good or service is esti-
mated based on the costs of replacing that good or service.
– production function approach: the value of an environmental good which is
used to produce a market good is estimated based on the production function.
In contrast to this, stated preference methods create a hypothetical or contingent market
in a survey. They use willingness to pay, or willingness to accept compensation for not
causing environmental deterioration or willingness to forego an environmental improve-
ment. Important stated preference approaches for estimating environmental and health
goods or services are the following:
– contingent valuation (CV) method: in order to value non-market goods, people
are asked in surveys about their willingness to pay to avoid a given decrement of
this particular non-market good, or about their willingness to accept its deteriora-
tion by receiving a certain amount of compensation.
– choice modelling (CM) method: willingness to pay is elicited by choice experi-
ments in which people can choose between different bundles of goods with vary-
ing characteristics. These can be either market or nonmarket goods.
– life satisfaction analysis: welfare estimates of public goods (health, environ-
ment) are made based on life satisfaction surveys.
– In addition, benefit or value transfer methods can be used to transfer the results
from previously applied valuation methods to a new case study in order to esti-
mate the intangible costs.
Among the stated preference methods, CV has for a long time been the method most
commonly used in valuing non-market goods and services. It has also been applied in
assessing the intangible costs of natural hazards (see for example Turner et al. 1993;
Daun and Clark 2000; DEFRA 2004; Leiter and Pruckner 2007; Umweltbundesamt 2007).
CM has become more popular in recent years. Both CV and CM can estimate economic
values for any environmental resource. Their advantage over other methods is that they
can estimate non-use values as well as use values. CM, however, additionally makes it
possible to estimate the implicit values of its resources’s attributes, their implied ranking
and the value of changing more than one attribute at a time (Hanley et al. 1998; Bateman
et al. 2003).
Table 1 Intangible effects: methods, applications and examples
General Specific method Application and/or examples
method
Revealed preferences Travel cost method Hartje et al. (2001)
methods
Hedonic pricing Hamilton (2007);
method Chao et al. (1998);
Cavailhes et al. (2009)
Cost of illness ap- DEFRA (2007)
proach
Replacement cost Leschine et al. (1997)
method
Production function n.a.
approachStated Contingent valuation Birol et al. (2006);
preferences method Daun and Clark (2000);
methods DEFRA (2004);
Leiter and Pruckner (2007);
Pattanayak and Kramer (2001b);
Turner et al. (1993);
Zhai and Ikeda (2006);
Zhongmin et al. (2003)
Choice modelling Brouwer and Schaafsma (2009);
method Daun and Clark (2000);
Hensher et al. (2006) ;
Olschewski et al. (2011)
Life satisfaction Carroll et al. (2009)
analysis
Benefit or value transfer Martin-Ortega et al. (2012)
methods
Source: Adapted von Meyer et al. (2013).
The increased application of these methods (as depicted in Table 1) has resulted in sev-
eral recommendations for improvement (Markantonis et al. 2011):
Improvements in stated preferences methods could be achieved if they are ap-
plied at regular intervals and similar contexts; this would eliminate the various in-
herent biases of this method.
Revealed preferences could be improved by using long time and verified data se-
ries in order to eliminate market price distortions caused by sources other than
natural hazards.
Due to the complexity and uncertainty of the intangible effects, a combination of
both methods could help to reveal differences in the valuation approaches and to
enhance the accuracy of the results. In other words, stated preferences and re-
vealed preferences methods should be applied in parallel and complementary to
each other. However, such an option would require more resources.
The benefit transfer method can be a low cost alternative only if the demand for precision
is relatively low (as practice examples have demonstrated). Improvements can be
achieved if the BT method is applied in assessment studies with very similar characteris-
tics and if adjustments to the needs of the new case study are conducted precisely and
transparently (Meyer et al. 2013).
3.2 Indirect economic damage
Indirect flood losses are those where damage does not arise due to the physical contact
of objects with flood water but where it is induced by direct impacts and transmitted
through the supply chain. Thus, for example, a production facility might be lacking an im-
portant input (electricity, raw materials, etc.) due to a flood event in its suppliers’ area and
thus be unable to operate, thereby incurring financial loss. Indirect loss is necessarily at-
tached to some form of interruption of usual business but is fundamentally different from
the business interruption caused by the direct physical impacts of flood water on produc-
tion facilities. It is a trigger effect caused by the numerous interlinked factors in the eco-
nomic system.
While recent studies on indirect loss demonstrate the economic importance of this cat-
egory of damage – Hallegatte (2008), for example, estimates the indirect losses from Hur-
ricane Katrina in Louisiana at 28 billion US dollars – efforts to measure it have not been
undertaken to the same extent as for direct loss. In this section, therefore, we identify
10types of indirect loss and methods for measuring it, particularly existing ex-ante modelling
methodologies. We also describe ways in which vulnerability score cards can be em-
ployed to raise awareness about indirect losses.
In principle, the magnitude of indirect loss is determined by the boundaries in space
and time of any damage assessment. From a very broad temporal and spatial perspec-
tive, indirect losses from natural disasters are zero. Measured over the entire economy,
the negative and positive indirect effects cancel each other out. For any reasonable
boundary (city, state, watershed region, etc.), however, there will be net indirect effects
from flooding.
In the short-term, floods produce indirect losses in the following areas:
Input/output losses to firms who are customers (forward-linked) or suppliers (back-
ward-linked) of the businesses directly affected.
Reductions in consumption due to the income and/or profit losses triggered by busi-
ness interruption as a ripple effect, i.e. employees or private owners of the firms ex-
periencing reduced production suffer income losses and subsequently cut their own
spending.
Floods can also have long-term indirect impacts such as altered migration flows, relo-
cation of industries, depressed house prices, and changes in government expenditure re-
sulting from new patterns of migration and regional development.
Evidence to date suggests that the indirect effects are more important in large-scale
disasters than in smaller-scale disasters. With regard to Hurricane Katrina, for example,
Hallegatte (2008) demonstrates that significant indirect losses for the state of Louisiana
only arise when direct losses exceed 50 billion US dollars. In a separate study, he also
demonstrates that indirect impacts are larger if a natural disaster affects the economy
during the expansion phase of its business cycle than if it occurs during a recessionary
phase (Hallegatte et al. 2007).
Compared to direct effects, indirect losses are much more difficult to measure. Addi-
tionally, there are limited available sources of data for measuring indirect losses. Insur-
ance data on business interruptions are of limited value for that purpose, as most indirect
effects (power outage, for example) do not qualify for compensation under business inter-
ruption insurance. Moreover, many firms do not possess business interruption insurance.
The scarcity of accessible primary data has led to attempts to measure indirect losses us-
ing economic models of the type that have long been utilised for economic forecasting
such as:
1. Simultaneous equation econometric models (Ellison et al. 1984; Guimares et al.
1993; West and Lenze 1994).
2. Input-output models (e.g., Rose and Benavides 1997; Boisvert 1992; Cochrane
1997).
3. Computable general equilibrium models (Brookshire and McKee 1992; Boisvert,
1995).
Studies evaluating model-based estimates (Kimbell and Bolton 1994; Bolton and Kim-
bell 1995; West 1996) suggest that the models developed for traditional economic fore-
casting tend to overstate the indirect effects. Differences of between 70 and 85 per cent
exist in relation to observed impacts from post-event economic surveys (West and Lenze
1994).
The reason for this overestimation of both indirect regional economic losses from natu-
ral disasters and indirect regional economic gains from reconstruction is that statistically
based economic models have been designed primarily to forecast the effects of a lasting
impact (e.g. investment in a new commercial development). The historical interlinked fac-
tors embodied in these models are likely to be substantially disrupted and temporarily al-
tered during a flood. Dynamic adjustment features such as recovery, resiliency, interre-gional substitution, inventory adjustments, changes in labour supply, number of refugees,
etc. are not reflected in these models. In short, these models are inappropriate for simu-
lating natural disasters; they must be substantially revised in order to produce reliable es-
timates of indirect effects. Computational algorithms modelling supply shocks, post event
supply constraints and time phased reconstruction in disaggregated spatial settings (as,
for example, applied in van der Veen and Logtmeijer 2005 and Yamano et al. 2007) seem
promising for overcoming this methodological gap.
4 How to deal with uncertainties?
There are high levels of uncertainty in all parts of flood risk assessment, from data and
models of flood characteristics through exposure and susceptibility to the costs of a pro-
ject. More uncertainties are entailed by the need to consider future developments such as
climate and socio-economic change.
Scenario-based uncertainty bounds, Monte-Carlo simulations and simple probabilistic
ranking tools can be applied to support FRM decision making in such highly uncertain en-
vironments.
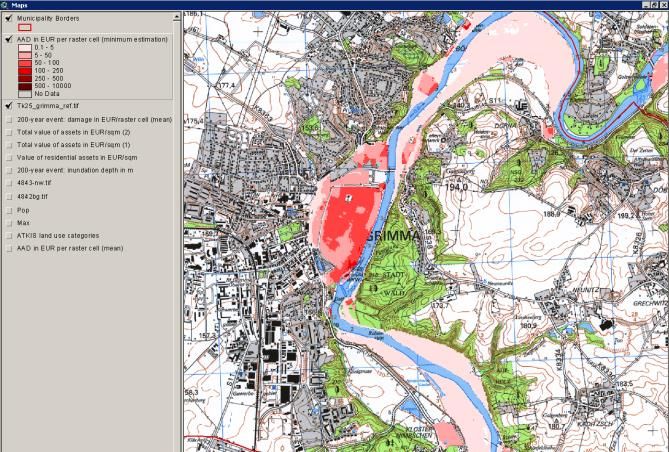
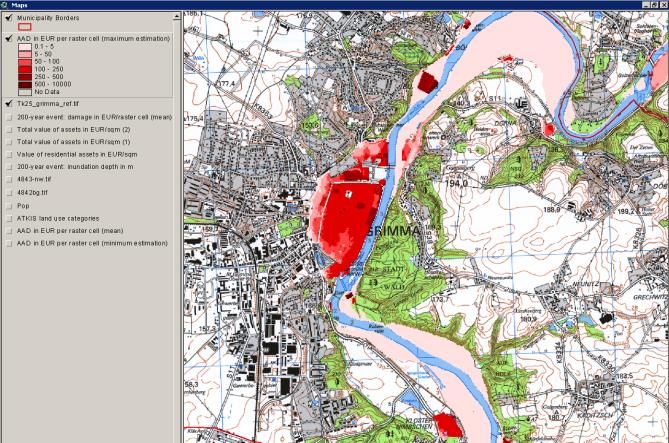
Fig. 4 demonstrates the use of uncertainty bounds in a spatial distribution of minimum
and maximum annual average damages (AAD) for flood risk scenarios for the city of
Grimma in Saxony.
Fig. 4 Minimum and maximum annual average damages (AAD) for flood risk scenarios
in the city of Grimma (Source: Landesvermessungsamt Sachsen (topographic map);
Meyer et al. 2011 (damage assessment, risk maps)
12Saint-Geours et al. (2015) transformed the underlying uncertainties in all input compo-
nents into a probabilistic cost-benefit analysis. In a large number of Monte-Carlo simula-
tions of flood characteristics integrating different hydrologic and hydraulic models, land-
use scenarios and depth-damage functions as well as bounds of investment costs, they
establish a probability distribution of the net present value of a project, that is, one which
can help to establish probability distributions for efficient flood control measures in the
Orb Delta, France (cf. Fig. 5 below).
Fig. 5 Empirical distribution of the net present value (NPV) over Ntot= 28672 simula-
tions and mean value (solid line) (Source: Saint-Geours et al. (2015), Fig. 9)
The PRIMATE (Probabilistic Multi-Attribute Evaluation) tool developed at UFZ is a
simple methodology that is stakeholder driven and thus more adaptable to specific con-
texts. It extends the PROMETHEE method developed by Brans and Mareschal (2005)
and has been successfully applied to flood risk management, water scarcity manage-
ment, heat stress and climate change adaptation in UFZ projects.5
PRIMATE compares stakeholder-selected risk mitigation or adaptation options (indi-
vidual measures or strategic bundles of measures) with one another in order to evaluate
and rank these options probabilistically and thereby support decision making (cf. Fig. 6).
Decision makers also choose the weighting of the evaluation criteria. It thus offers a
contextual and participatory approach for groups involving multiple decision makers.
The tool can be used for cost-benefit analysis (with tangible costs being the only crite-
rion) or for multi-criteria analysis under uncertainty. Uncertainty is considered by a range
(uncertainty bounds), a triangular distribution or any other probability distribution.
5
The PRIMATE manual is available as a download on the UFZ website (www.ufz.de). For the free software
please send an email to the author.Fig. 6 Dealing with uncertainties in decision support (Source: own compilation)
This selection of methods and tools (and there are more) demonstrates how economics
can help to deal with the persistently high uncertainties in flood risk management. Their
virtual omnipresence and widespread usage in flood risk management, as well as the
continuous development and research devoted to them, shows that we are at a cross-
roads. We need to decide whether breakthrough improvements to the risk-based ap-
proach can be made by improved data gathering and validation efforts or, alternatively,
whether more qualitative decision support approaches are needed other than cost-benefit
and multi-criteria analysis. Choosing the first avenue would imply developing more com-
prehensive and more consistent damage databases for Germany and Europe, which
would make it possible to integrate intangible and indirect impacts. The alternative would
be to develop more qualitative decision support tools and participatory procedures such
as robust decision making, adaptation pathways and decision heuristics. Research by
Gigerenzer and Brighton (2009), for example, provides ample evidence that decision heu-
ristics, i.e. decision rules even simpler than the ones presented above, may not only re-
duce the effort of implementing the decision rule but may also lead to better results in
terms of predictive accuracy under conditions of high uncertainty, compared to more
complex models. However, for decisions in flood risk management such heuristics have
not yet been put to the test, and we probably need a way to go in terms of more interdis-
ciplinarity in science and policy to arrive at any non-conventional decision support in flood
risk management.
5 Flood risk management practices in Saxony
The EU Flood Risk Management Directive (European Union 2007) seeks to establish a
coordinated European approach to handling the risk, or generally negative impacts, of
14flood events. Its implementation requires three basic steps to be implemented in a
phased approach (cf. Müller 2013):
1. Preliminary Flood Risk Assessment (phase ending Dec 2011)
2. Flood Hazard and Flood Risk Maps (phase ending Dec 2013)
3. Flood Risk Management Plans (phase ending 22 Dec 2015)
Saxony is one of Germany’s sixteen Länder (administrative regions/states) and is located
in the central southeastern part of Germany. It has devised 47 flood protection concepts
(for all first-order rivers in the region) including 1600 flood protection measures. These
concepts apply uniform sector-differentiated flood protection targets (“flood designs”) for
settlements (1/100 flood design), single buildings (1/25 flood design) and agricultural are-
as (1/5 flood design). This section explains how economic decision support tools have
been applied in order to prioritise measures (in terms of timing) within dedicated budgets
of 0.5 billion euros by 2012, increasing to 1 billion euros by 2020 (cf. Müller 2010).
Table 2 depicts how flood protection measures in Saxony are prioritised according to:
1. Expected damage (“Schadpotential”, i.e. flood damage evaluation based on a
meso-scale approach as explained in section 2 above; evaluation points up to 25
according to expected damage of € 0 – 10 million euros and more).
2. Benefit-cost ratio (“Nutzen-Kosten-Verhältnis”, i.e. estimate of annual avoided
damages (as described in section 1) relative to cost estimates of the water man-
agement authority of Saxony, LfULG; up to 25 evaluation points according to B/C
ratio of 0 – 5 and over).
3. Effects on water management (“Wasserwirtschaftliche Effekte”, including con-
siderations of retention, discharge and river ecology, judgement based on qualita-
tive expert assessment; total of 25 evaluation points).
4. Special vulnerabilities (“Vulnerabilitäten”, including risk to life, indirect loss, and
special protection needs, e.g. cultural heritage; total of 25 evaluation points;
judgement to be made based on expert assessment).Table 2 Prioritisation scheme in Saxony
Prioritisation criteria Valuation standard Prioritisation scores
Score Maximum
Expected damage
near 0 Mio € 0
((almost) no)
< 2 Mio € (low) 5 max 25
2 … 10 Mio € (medium) 15
> 10 Mio € (high) 25
Benefit-cost ratio
near 1 (extremely low) 0
< 1 … 2 (low) 5 max 25
2 … 5 (medium) 15
>5 (high) 25
Effects on water management
Improvement of capability of re- No or just local improvement 0
tention
Improvement with regional 5
impact
Improvement with 10
transregional impact
Improvement of drain ratio No or just local improvement 0 max 25
Improvement with regional 5
Improvement with 10
transregional impact
Improvement of water ecology No or inessential improve- 0
and/or of quality of water structure ment
Significant improvement 5
Special vulnerabilities
Specific consternation/vulnerability No specific consternation 0
Moderately heavy specific 5
consternation
Heavy specific consternation 10 max 25
(danger to life)
Specific dangers following up (haz- No noteworthy dangers follow- 0
ards starting from objects) ing up
Moderately heavy dangers fol- 5
lowing up
Great, heavy dangers following 10
up
Specific requirement for protection No specific requirement for pro- 0
(missing flood defense) tection
Existing specific requirement 5
for protection
TOTAL max 100
Rating / Prioritization 0 - 30 pts low
35 - 60 pts medium
65 - 100 pts high
Source: Adapted from Socher et al. (2006)
16The prioritisation outcomes for the 47 flood protection concepts including 1598 flood pro-
tection measures in the period 2002 to 2020 are depicted in Table 3.
Table 3 Prioritisation of flood protection measures in Saxony (2002-2020)
Priority Measures Investment costs
(bn €)
0-29 points: low 548 0.2
30-64 points: medium 780 0.6
65-100 points: high 268 1.2
1598 2
Source: Adapted from Müller (2010), p. 252.
This outcome demonstrates that the high-ranked measures were on average the larger
and costlier measures such as dykes and flood protection walls, whereas relatively less
investment intensive such as building flood water retention basins and unsealing land
surfaces were all ranked medium or low (they will be funded only up until 2020).
This example also demonstrates that there is an important role to be played by eco-
nomic flood damage assessment and cost-benefit analysis in the timing of measures,
though not necessarily in the selection of measures for long-term flood management
practices in Germany. The tools applied for this purpose are simple and involve a multi-
criteria framework, including cost-benefit analysis but also going beyond this.
6 Concluding remarks
As stated at the start of this chapter, the ex-ante assessment of flood damages is an es-
sential part of the flood risk management concept, as it provides a basis for the efficient
allocation of scarce funds by means of cost-benefit analysis. However, as shown in this
chapter, achieving a comprehensive and exact estimation of future flood damage still
poses a great challenge.
Different types of economic flood damages require different approaches for their as-
sessment. Many assessment approaches focus on direct damage to residential proper-
ties in particular, while there are few methods available for estimating indirect losses, ag-
ricultural and infrastructural damage. However, in order to estimate the full economic
impact of flooding, damage assessment should try to achieve a comprehensive picture of
the negative impacts. This means that at least the most important damage categories to
be expected in the respective case study should be considered in the assessment. This
includes social and environmental effects.
It has been shown here too that the accuracy of economic damage assessment is also
a matter of scale. Micro-scale approaches deliver quite accurate results but often require
huge effort, while meso-scale approaches reduce effort at the expense of greater uncer-
tainty of results. Economic flood damage assessment is consequently always a trade-off
between accuracy and effort. The choice of an appropriate approach therefore depends
on the objective of the study and the decision situation. To provide sufficient decision
support, a damage assessment study should deliver a level of accuracy which is required
for choosing between, e.g., different management options.
Even the most accurate and comprehensive approaches involve uncertainties regard-
ing the results of damage assessment. In order to provide good decision support, these
uncertainties should not be ignored but documented and – wherever possible – quanti-
fied.
The EU Flood Risk Management Directive has led to economics acquiring an expand-
ed role in flood risk management in Europe. The example of Saxony shows that existingframeworks are simple and based on multiple criteria: they include cost-benefit analysis
but also go beyond it in the assessment of intangible and indirect effects. Pragmatic solu-
tions are needed in this respect.
18References Apel H, Aronica GT, Kreibich H, Thieken AH (2009) Flood risk analyses - how detailed do we need to be?. Nat Hazards 49(1):79–98 Birol E, Karousakis K, Koundouri P (2006) Using economic valuation techniques to inform water resources management: A survey and critical appraisal of available techniques and an application. Sci Total Environ 365(1–3):105–122 Bockarjova M, Steenge AE, van der Veen A (2004) Flooding and Consequent Structural Economic Effects: A Methodology. Flooding in Europe: Challenges and Developments in Flood Risk Management. Kluwer Academic Publishers, Dordrecht Boisvert R (1992) Indirect losses from a catastrophic earthquake and the local, regional, and national interest. In: FEMA (ed) Indirect Economic Consequences of a Cata- strophic Earthquake. FEMA, National Earthquake Hazard Reduction Program, Wash- ington, DC Boisvert R (1995) Computable General Equilibrium Modeling for Earthquake Impact Analysis. Report to the Federal Emergency Management Agency, Cornell University, Ithaca, NY Bolton N, Kimbell L (1995) The Economic and Demographic Impact of the Northridge Earthquake. Annual meeting of the Population Association of America Brookshire DS, McKee M (1992) Other indirect costs and losses from earthquakes: is- sues and estimation. In: FEMA (ed) Indirect Economic Consequences of a Cata- strophic Earthquake. FEMA, National Earthquake Hazards Reduction Program, Wash- ington, DC Brans JP, Mareschal B (2005) Promethee Methods. In: Figueira J, Greco S, Ehrgott M (eds) Multiple Criteria Decision Analysis: State of the Art Surveys. International Series in Operations Research & Management Science, vol 78. Springer, New York, NY, pp 163–196 Cochrane HC (1997) Indirect economic losses. In: Development of Standardized Earth- quake Loss Estimation Methodology, Vol. II. National Institute for Building Sciences, Washington, DC Carroll N, Frijters P, Shields MA (2009) Quantifying the costs of drought: new evidence from life satisfaction data. J Population Econom 22(2):445–461 Colijn F, Hamann M, Reese S, Rohr T (2000) Wertermittlung für die potenziell sturmflut- gefährdeten Gebiete an den Küsten Schleswig-Holsteins. Gutachten im Auftrag des Ministeriums für ländliche Räume, Landesplanung, Landwirtschaft und Tourismus des Landes Schleswig-Holstein. Unveröffentlichter Endbericht, 2000. (in German) Cochrane HC (2004) Economic loss: myth and measurement. Disaster Prevention and Management: Int J 13(4):290–296 Daun CM, Clark D (2000) Flood Risk and Contingent Valuation Willingness to Pay Stud- ies: A Methodological Review and Applied Analysis, Institute for Urban Environmental Risk Management. Marquette University, Milwaukee DEFRA (2004) The Appraisal of Human -Related Intangible Impacts of Flooding, Envi- ronment Agency Flood and Coastal Defense, R&D Technical Report FD2005/TR DEFRA (2007) The costs of the summer 2007 floods in England. Project: SC070039/R1 DKKV (eds) (2015) Das Hochwasser im Juni 2013: Bewährungsprobe für das Hochwas- serrisikomanagement in Deutschland. DKKV-Schriftenreihe 53, Bonn (in German) DVWK (1985) Ökonomische Methoden von Hochwasserschutzwirkungen (Economic me- thods for flood impacts). Deutscher Verband für Wasserwirtschaft und Kulturbau, Ar- beitsmaterialien zum methodischen Vorgehen, DVWK-Mitteilungen (in German) Ellison R, Milliman JW, Roberts RB (1984) Measuring the regional economic effects of earthquakes and earthquake predictions. J Regional Sci 24(4):559–579 European Union (2007) Directive 2007/60/EC of the European Parliament and of the Council of 23 October 2007 on the Assessment and the Management of Flood Risks (OJ L 288, 6.11.2007). https://eur-lex.europa.eu/legal- content/EN/TXT/?uri=CELEX:32007L0060 Accessed 2 May 2018
FLOODsite Consortium (2005) Language of risk - project definitions. FLOODsite project
   report T32-04-01
FLOODsite Consortium (2007) Evaluating flood damages: guidance and recommenda-
   tions on principles and methods. FLOODsite project report T09-06-01Georgescu-
                                                                    th
   Roegen N (1981) The entropy law and the economic process. 4 edition. Havard Uni-
   versity Press, Cambridge/MA and London
Guimares P, Hefner FL, Woodward DP (1993) Wealth and income effects of natural dis-
   asters: an econometric analysis of Hurricane Hugo. Rev Reg Stud 23(2):97–114
Gigerenzer G, Brighton H (2009) Homo Heuristicus: Why Biased Minds Make Better In-
   ferences. Top Cogn Sci 1(1):107–143
Green C, Viavattene C, Thompson P (2011) Guidance for assessing flood losses,
   CONHAZ                                                                          Report.
   https://www.ufz.de/export/data/2/122166_CONHAZ%20REPORT%20WP06_1.pdf Ac-
   cessed 30 April 2018
Hanley N, Spash C (1993) Cost benefit analysis and the environment. Edward Elgar Pub-
   lishing, Cheltenham, UK
Hallegatte S (2008) An adaptive regional input-output model and its application to the as-
   sessment of the economic cost of Katrina. Risk Anal 28(3):779–799. doi:
   10.1111/j.1539-6924.2008.01046
Hallegatte S, Hourcade J-C, Dumas P (2007) Why economic dynamics matter in as-
   sessing climate change damages: illustration on extreme events. Ecol Econ
   62(2):330–340
Hamilton MJ (2007) Coastal landscape and the hedonic price of accommodation. Ecol
   Econ 62(3–4):594–602
Hartje V, Meyer I, Meyerhoff J (2001): Kosten einer möglichen Klimaanderung auf Sylt.
   In: Daschkeit A., Schottes P (eds) Klimafolgen für Mensch und Küste, Sylt, Berlin
IKSE (International Commission for the Protection of the Elbe) (2004) Dokumentation des
   Hochwassers vom August 2002 im Einzugsgebiet der Elbe (Documentation of the Au-
   gust 2002 floods in the Elbe catchment). Magdeburg (in German)
IKSR (2001) Übersichtskarten der Überschwemmungsgefährdung und der möglichen
   Vermögensschäden am Rhein. International Commission for the Protection of the Rhi-
   ne, Abschlußbericht: Vorgehensweise zur Ermittlung der hochwassergefährdeten Flä-
   chen, Vorgehensweise zur Ermittlung der möglichen Vermögensschäden
Jia H, Pan D, Wang JA, Zhang WC (2016) Risk mapping of integrated natural disasters in
   China. Nat Hazards 80(3):2023–2035. doi: 10.1007/s11069-015-2057-3
Kimbell L, Bolton N (1994) The impact of the Northridge Earthquake on the economies of
   California and Los Angeles. Seismic Safety Commission of the State of California,
   Burbank
Klaus J, Schmidtke RF (1990) Bewertungsgutachten für Deichbauvorhaben an der
   Festlandsküste – Modellgebiet Wesermarsch (Evaluation methods for dike construc-
   tion projects in main land coastal regions). Untersuchungsbericht an den Bundes-
   minister für Ernährung, Landwirtschaft und Forsten. Bonn (in German)
Kok M, Huizinga HJ, Vrouwenfelder ACWM, Barendregt A (2004) Standard Method 2004.
   Damage and Casualties caused by Flooding, Client: Highway and Hydraulic Engineer-
   ing Department
Leiter A, Pruckner G (2007) Dying in an Avalanche: Current risks and valuation. Working
   paper, University of Innsbruck, Austria
Markantonis V, Meyer V, Schwarze R (2012) Valuating the intangible effects of natural
   hazards, Review and analysis of the costing methods, Nat Hazard Earth Sys 12:1633–
   1640
Messner F, Penning-Rowsell E, Green C, Meyer V, Tunstall S, van der Veen A (2007)
   Guidelines for socio-economic Flood Damage Evaluation. FLOODsite-Report T09-06-
   01

                                                                                        20
Merz B, Kreibich H, Schwarze R, Thieken AH (2010) Assessment of economic flood damage, Review article, Nat Hazard Earth Sys 10:1697–1724 Meyer V, Becker N, Markantonis V, Schwarze R, van den Bergh J, Bouwer L, et al. (2013) Assessing the Costs of Natural Hazards - State-of-the-art and Knowledge Gaps. Nat Hazard Earth Sys 13:1351–1373 Meyer V (2009) GIS-based Multicriteria Analysis as Decision Support in Flood Risk Man- agement. https://repository.tudelft.nl/islandora/object/uuid:e4f089fc-99e7-4260-a4c9- 4d548f14dabc?collection=research. Accessed 30 April 2018 Meyer V, Scheuer S, Haase D (2009) A multicriteria approach for flood risk mapping ex- emplified at the Mulde river, Germany. Nat Hazards 48(1):17–39 Morselt T, Engelsman GJ, Lobbes E (2007) Estimating cost functions for evacuation, emergency services and cleanup in case of floods. Rebelgroup Munich Re (2004) Topics – Annual review: natural catastrophes 2004. München Munich Re (2014) Topics Geo Natural catastrophes 2013. München Müller U (2013) Implementation of the flood risk management directive in selected Euro- pean countries. Int J Disaster Risk Sci 4(3):115–125. doi:10.1007/s13753-013-0013-y Müller U (2010) Hochwasserrisikomanagement.Theorie und Praxis (Flood Risk Manage- ment-Theory and Practice). Springer-Vieweg+Teubner Verlag, Wiesbaden (in German) Pearce DW, Turner K (1990) Economics of Natural Resources and the Environment. Johns Hopkins University Press, Baltimore, MA Penning-Rowsell EC, Johnson C, Tunstall S, Tapsell S, Morris J, Chatterton J, Coker A, Green C (2003) The Benefits of flood and coastal defence: techniques and data for 2003, Flood Hazard Research Centre, Middlesex University Pfurtscheller C, Schwarze R (2008) Estimating the costs of emergency services during flood events. – Proceedings of the 4th International Symposium on Flood Defence, To- ronto Rose A (2004) Defining and measuring economic resilience to disasters. Disaster Pre- vention and Management. Int J 13(4):307–314 Rose A, Benavides J (1997) Inter-industry models for analyzing the economic impact of earthquakes and recovery policies: Illustrative examples [7/93; revised 11/93]. In: Jones B (ed) Advances in Social Science Analysis of Earthquakes. National Center for Earthquake Engineering Research, Buffalo, NY Sayers P, Hall J, Dawson R, Rosu C, Chatterton J, Deakin R (2002) Risk assessment of flood and coastal defences for strategic planning (RASP) – a High Level Methodology. DEFRA Conference for Coastal and River Engineers, September 2002 Saint-Geours N, Grelot F, Bailly, JS, Lavergne C (2015) Ranking sources of uncertainty in flood damage modelling: a case study on the cost-benefit analysis of a flood mitigation project in the Orb Delta, France. J Flood Risk Manag 8(2):161–176. doi:10.1111/jfr3.12068 Schmalwasser O, Schidlowski M (2006) Kapitalstockrechnung in Deutschland. Wirtschaft und Statistik 11/2006: 1107–1123. http://www.destatis.de. Accessed 4 November 2010 Schanze J (2006) Flood risk management - a basic framework. In: Schanze J, Zeman E, Marsalek J (eds) Flood Risk Management - Hazards, Vulnerability and Mitigation Measures. Springer, pp 149–167 Smith K, Ward R (1998) Floods – Physical Processes and Human Impacts, Chichester Socher M, Sieber HU, Müller G, Wundrak P (2006) Verfahren zur landesweiten Priorisie- rung von Hochwasserschutzmaßnahmen. Hydrologie und Wasserbewirtschaftung 50(3):123–130 Umweltbundesamt (2007) Ökonomische Bewertung von Umweltschäden. Methodenkon- vention zur Schätzung externer Umweltkosten. http://www.umweltdaten.de/publikationen/fpdf-l/3193.pdf. Accessed 04 Nov 2010 Toyoda T (1997) Economic Impacts and Recovery Process in the Case of the Great Hanshin Earthquake. Fifth U.S.-Japan Workshop on Urban Earthquake Hazard Reduc- tion, Pasadena, Calif. January 15th–17th van der Veen A, Logtmeijer C (2005) Economic hotspots: visualizing vulnerability to flood- ing. Nat Hazards 36(1-2):65–80
West CT (1996) Indirect economic impacts of natural disasters: policy implications of re-
  cent research and experience. Proceedings of Analyzing Economic Impacts and Re-
  covery from Urban Earthquakes: Issues for Policy Makers. Conference presented by
  Earthquake Engineering Research Institute and Federal Emergency Management
  Agency, Pasadena, Calif
West CT, Lenze DC (1994) Modeling the regional impact of natural disaster and recovery:
  a general framework and an application to Hurricane Andrew. Int Regional Sci Rev
  17(2):121–150
WWF (2007) Fünf Jahre nach der Elbeflut (Five years after the Elbe flood), WWF Germa-
  ny, Frankfurt am Main (in German)
Yamano N, Kajitani Y, Shumuta Y (2007) Modeling the Regional Economic Loss of Natu-
  ral Disasters: The Search for Economic Hotspots. Economic Syst Res 19(2):163–181
Zhang D-L, Lin Y, Zhao P, Yu X, Wang S et al. (2013) The Beijing extreme rainfall of 21
  July 2012: ‘‘Right results’’ but for wrong reasons. Geophysical Research Letters

                                                                                       22
You can also read