NO EVIDENCE FOR DISTINCT TYPES IN THE EVOLUTION OF SARS-COV-2
←
→
Page content transcription
If your browser does not render page correctly, please read the page content below
No evidence for distinct types in the evolution of SARS-CoV-2

Oscar A. MacLean*, Richard J. Orton, Joshua B. Singer, David L. Robertson.

MRC-University of Glasgow Centre for Virus Research (CVR), Glasgow, United
Kingdom

*To whom correspondence should be addressed: Oscar MacLean, MRC-University of

                                                                                                                                                        Downloaded from https://academic.oup.com/ve/advance-article-abstract/doi/10.1093/ve/veaa034/5827470 by guest on 06 May 2020
Glasgow Centre for Virus Research, Garscube Campus, 464 Bearsden Road, Glasgow
G61 1QH, Scotland (UK), Oscar.MacLean@glasgow.ac.uk

Abstract
A recent study by Tang et al. (2020) claimed that two major types of SARS-CoV-2 had
evolved in the ongoing COVID-19 pandemic and that one of these types was more
“aggressive” than the other. Given the repercussions of these claims and the intense
media coverage of these types of articles, we have examined in detail the data
presented by Tang et al, and show that the major conclusions of that paper cannot be
substantiated. Using examples from other viral outbreaks we discuss the difficulty in
demonstrating the existence or nature of a functional effect of a viral mutation, and we
advise against overinterpretation of genomic data during the pandemic.

Main:

Following the report of a pneumonia outbreak in late December 2019 (WHO 2020), the
first SARS-CoV-2 genome sequence was made publicly available on the 10th of January
2020. Real time sequencing of viral genomes can help to understand the transmission
history of pandemics and provide insights into how the pathogen is evolving (Gardy and
Loman 2018). Additionally, dynamic nomenclature systems, as has been proposed for
COVID-19 (Rambaut et al. 2020), can be useful for tracking purposes.

Up to the 12th of March 2020, 396 high quality genomes of SARS-CoV2 have been
released, displaying in total 301 unique nonsynonymous substitutions, i.e., mutations
associated with amino acid replacements (Figure 1). These data have provided useful
epidemiological insights into the history of the pandemic, e.g., demonstrating multiple
introductions into different geographical areas (Gudbjartsson et al. 2020; Deng et al.
2020). Using these genomes, the timing of the last common ancestor of the outbreak is
estimated to be around late November 2019 (Rambaut 2020), with an exponential
growth of infections since that date. Estimates of the virus’ evolutionary rate are
centered around 8×10⁻⁴ substitutions per site per year (Su et al. 2020; Rambaut 2020),
which is broadly in line with those estimated from SARS-CoV-1 and MERS (Zhao et al.
2004; Dudas et al. 2018), and about a third of that estimated for influenza B (Virk et al.
2020).

An analysis of SARS-CoV-2 genetic data was published on the 3rd of March 2020 in the
journal National Science Review by Tang et al. (2020). This study made two major
claims that appear to have been reached by misinterpretation of the SARS-CoV-2 and
the paper contains additional methodological limitations. We consider each claim in turn.

C The Author(s) 2020. Published by Oxford University Press.
V
This is an Open Access article distributed under the terms of the Creative Commons Attribution License (http://creativecommons.org/licenses/by/4.0/),
which permits unrestricted reuse, distribution, and reproduction in any medium, provided the original work is properly cited.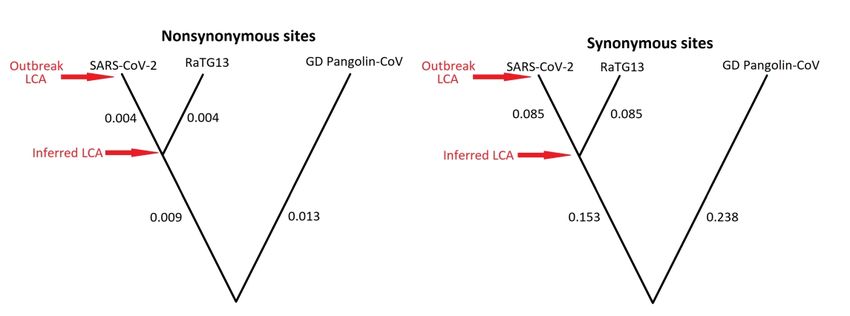
The first claim. The study proposes that there are two clearly definable “major types” of
SARS-CoV-2 in this outbreak and that they have differentiable transmission rates. Tang
et al. term these two types “L” and “S”: “two major types (L and S types): the S type is
ancestral, and the L type evolved from S type. Intriguingly, the S and L types can be
clearly defined by just two tightly linked SNPs at positions 8,782 (orf1ab: T8517C,
synonymous) and 28,144 (ORF8: C251T, S84L).”

One nonsynonymous substitution, particularly one which has not been assessed for

                                                                                                 Downloaded from https://academic.oup.com/ve/advance-article-abstract/doi/10.1093/ve/veaa034/5827470 by guest on 06 May 2020
functional significance, is not sufficient to define a distinct “type” nor “major type”. As of
the 9th April 2020, there are 2334 nonsynonymous substitutions that have been
identified in the outbreak, catalogued in the CoV-GLUE resource at http://cov-
glue.cvr.gla.ac.uk (Singer et al. 2018). At present, there is no evidence that any of these
2334 point mutations have any significance in the functional context of within-host
infections or transmission rates. Additionally, if one chooses to define “types” purely on
the basis of two mutations, it is unsurprising that these “types” then differ by those two
mutations.

However, Tang et al. further claim that these two types have differing transmission rates:
“Thus far, we found that, although the L type is derived from the S type, L (~70%) is
more prevalent than S (~30%) among the sequenced SARS-CoV2 genomes we
examined. This pattern suggests that L has a higher transmission rate than the S type.”
The abstract of the paper goes even further, stating outright that: “the S type, which is
evolutionarily older and less aggressive…”. It is, however, important to appreciate that
finding a majority of samples with a particular mutation is not evidence that viruses with
that mutation transmit more readily. To make this suggestion would, at the very
minimum, require a comparison to be made to expectations under a null distribution
assuming equal transmission rates. As this has not been performed by the authors,
there is insufficient evidence to make this suggestion, and therefore it is incorrect (and,
we would argue, irresponsible) to state that there is any difference in transmission rates.
Genome sequence analysis alone is insufficient to demonstrate a functional effect of a
mutation on virus phenotype, without assessing the probable impact of the amino acid
replacement, and careful experimentation assessing any functional effect. Differences in
the observed numbers of samples with and without this mutation are far more likely to be
due to stochastic epidemiological effects and biased virus genome sampling among
locations.

During a pandemic, as the virus spreads to new areas and countries that were
previously uninfected, founder effects will have significant impacts on mutation
frequencies. As a small number of virus copies spread into a local epidemic, any
mutations present in the initial viral infections will rapidly become very common, even if
they were rare in the particular geographical area which seeded the transmission. This is
particularly likely to be the case in an outbreak caused by a novel virus such as SARS-
CoV-2, as there are a large number of susceptible hosts for the virus, and numerous
epidemics are being established around the world at different timepoints. These founder
effects have also been observed in previous viral outbreaks e.g., in chikungunya virus

                             https://mc.manuscriptcentral.com/vevolu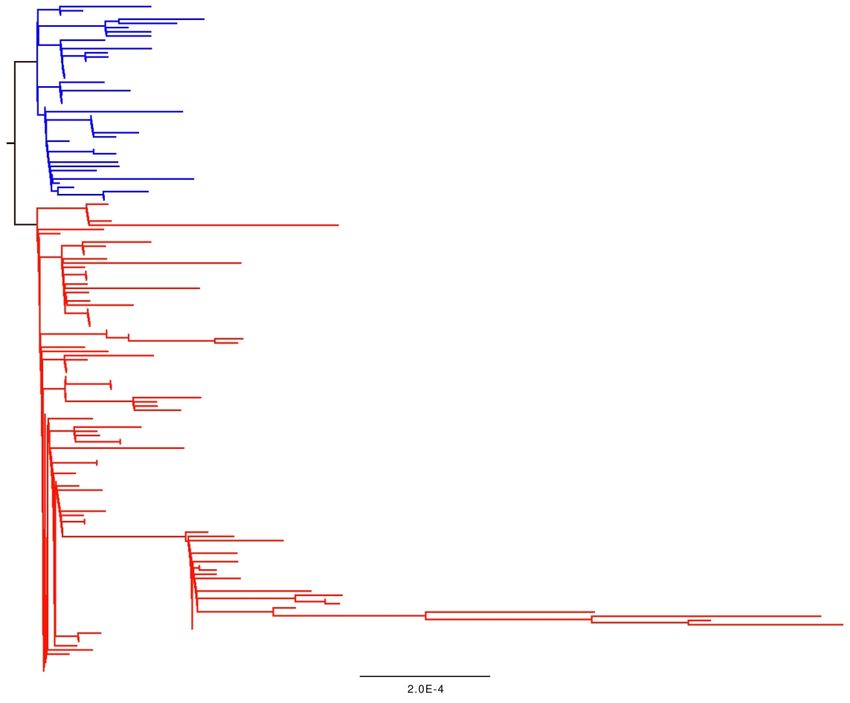
and multiple local HIV epidemics (Foley et al. 2004; Rambaut et al. 2001; Bhattacharya
et al. 2007; Rai et al. 2010; Tsetsarkin et al. 2011).

Basic evolutionary theory predicts that selectively neutral mutations change in frequency
over time through the process of genetic drift (Wright 1948). In a viral outbreak, each
transmission event from one infected person to another is a random probabilistic event,
with some infected individuals transmitting more or less often than others. Some
infections may transmit at higher rates than others for a variety of reasons. These “super

                                                                                               Downloaded from https://academic.oup.com/ve/advance-article-abstract/doi/10.1093/ve/veaa034/5827470 by guest on 06 May 2020
spreaders” may have higher social contact rates or shed more virus for a longer period
of time. These small-scale epidemiological phenomena add up over time to create
substantial variation in the frequencies of mutations during an outbreak. It is also
important to appreciate that the fewer infected hosts there are, the more these small
scale variations are likely to affect the frequency of mutations in the viral population.
Given that the two mutations in question appear to have occurred very early on in the
outbreak, when fewer individuals were infected, their frequency will very likely have been
particularly influenced by genetic drift.

Any analysis of allele frequencies must also consider that the viral genomes which are
sequenced are not a random sample of the global population, and are likely to be
biased. In the SARS-CoV-2 pandemic, the sampling bias arises in two ways. First of all,
the sampling of infections for sequencing is greatly biased by the country they occur in.
For example, 80% of confirmed COVID-19 cases up until 9/3/2020 came from China, but
only 40% of the SARS-CoV-2 full genome sequences derived from China. Second, as
contact tracing is a significant driver of case detection, there will be a correlation
between detected and sequenced samples, as they are often epidemiologically linked.
This lack of independence between sampled genomes, in effect generates
pseudoreplication of observed haplotypes. These factors combine to cause
oversampling of particular genotypes and mutations, adding variance to the observed
frequencies of mutations. This is likely to further exaggerate the variation in mutation
frequencies driven by epidemiology, causing observed changes in mutation frequencies
through time without any action of natural selection.

Examples from two previous viral outbreaks demonstrate these factors. A small number
of mutations were observed to rise to high frequencies in both the Ebola and SARS-
CoV-1 outbreaks. For both viruses, clearly demonstrating a functional effect of the
mutations proved difficult, with some counterintuitive observations.

The A82V amino acid replacement in the GP protein from the 2013-2016 Ebola outbreak
illustrates the difficulty in demonstrating a functional effect of a mutation. Three new
amino acid replacements in the Ebola outbreak rose in frequency to be found in more
than 90% of all sequenced genomes: R111C in the NP gene, A82V in the GP gene, and
D759G in the L gene. The A82V replacement was of particular interest as it was located
on the receptor binding interface. However, this rise in frequency alone was insufficient
to make firm conclusions about the functional significance of this mutation. To
demonstrate the significance of the A82V replacement, Diehl et al. (2016) performed
numerous additional analyses. These included: predicting the structural impact of the
change on the protein in silico; modelling the effect of the mutation on case fatality rate,

                            https://mc.manuscriptcentral.com/vevolu
controlling for viral loads, geographic location and access to healthcare; and in vitro
experimental infection of three different human, and nine different non-human cell lines
using viruses with and without this mutation. Despite finding significant evidence that
virus infections with the A82V replacement showed higher mortality rates, and that the
mutation enhanced infectivity of human and primate cell lines, the authors were not able
to conclude that this mutation contributed to greater transmission and severity of the
outbreak: “It is difficult to draw any conclusion about this hypothesis, though, since the
frequency increase can also be attributed to stochastic effects, including founder effects
Downloaded from https://academic.oup.com/ve/advance-article-abstract/doi/10.1093/ve/veaa034/5827470 by guest on 06 May 2020
as EBOV moved from Guinea into Sierra Leone and multiple re-introductions of GP-
A82V back into Guinea.”
At the same time, Urbanowicz et al. (2016) also found that A82V increased infectivity of
human cell lines and decreased infectivity of bat cell lines “supporting the hypothesis
that A82V is a fitness adaptation”. However, a follow up study failed to find evidence of
the mutation conferring higher viral titres or shedding rates in experimental infection of
macaques (Marzi et al. 2018). The reason for this discrepancy between live animal
models and cell lines is not yet understood, which means the functional significance of
the A82V replacement remains unresolved.
A similar example can be found in the SARS-CoV-1 outbreak. In the initial phases of the
outbreak, a 29 nucleotide deletion within ORF8 (the same ORF as the S84L
replacement that was used to define S and L types in SARS-CoV2) was identified, and
viruses with this deletion subsequently became dominant within the outbreak (He at al.
2004). This mutation caused the splitting of ORF8 into two ORFs: ORF8a and ORF8b. It
was hypothesized that this deletion was either neutral, with ORF8 being functionally
unimportant (Chinese SARS Molecular Epidemiology Consortium 2004), or that that it
was adaptive, facilitating the spread of SARS-CoV1 in humans (e.g., Chen et al. 2007;
Wong et al. 2018). However, experimental infection of one bat and two human cell lines
showed that the 29 nucleotide deletion significantly reduced the replicative capability of
SARS-CoV1 (Muth et al. 2018). Additionally, deletion of the full ORF8 gene caused an
even greater reduction in replicative capability. The spread of this apparently strongly
deleterious mutation was hypothesised to be the result of a founder effect in the early
period of the epidemic (Muth et al. 2018).
Combined, these factors and examples demonstrate that the frequency of a particular
mutation in and of itself is not demonstrative of any functional significance.
The second claim. Tang et al. (2020) compare the frequencies of nonsynonymous and
synonymous substitutions in the data, claiming that there is significant evidence of
selection suppressing the frequency of nonsynonymous substitutions in the outbreak.
This analysis is flawed on three grounds:
First, the numbers in this figure do not make sense. According to the presented data,
seven (synonymous) substitutions have a derived frequency of >50%, and four of these
mutations have derived frequencies greater than 95% in the population. A cursory
glance at the tree in Figure 2 shows that this cannot be true. “Derived” in this context
should mean a sequence change away from the genome of the last common ancestor of
https://mc.manuscriptcentral.com/vevoluthe outbreak. For four mutations to have derived frequencies greater than 95%, there
would need to be a small number of samples which branch as a sister lineage to the rest
of the outbreak tree. However, this is not the case.
The only way Tang et al. can get the results they present is by defining the ancestral
state not as the last common ancestor of the outbreak, but as the most recent common
ancestor of the outbreak and the nearest bat sarbecovirus RaTG13. The most recent
common ancestor of SARS-CoV-2 and RaTG13 existed many decades ago (Boni et al.
Downloaded from https://academic.oup.com/ve/advance-article-abstract/doi/10.1093/ve/veaa034/5827470 by guest on 06 May 2020
2020). As such, many mutations separate these two inferred ancestral states, especially
at synonymous sites (Figure 3).
Tang et al. estimate the ancestral state for each mutation independently, ignoring the
very informative phylogenetic tree of the current outbreak, and the temporal information
associated with each sample. This method only makes sense when using a much more
closely related outgroup species to infer the ancestral states of mutations in a freely
recombinant species with unlinked mutations with independent ancestry. Additionally,
such methods should incorporate the inherent uncertainty in inferring the ancestral state
(e.g., est-sfs; Keightley and Jackson 2018), which the implementation in Tang et al. does
not.
Implementing this flawed method of inferring ancestral states in a viral outbreak context,
where we assume there is no recombination, means that “high frequency derived
mutations” are actually just new mutations in the outbreak that have mutated back to the
inferred ancestral state. This generates an evolutionarily meaningless definition of
“derived” mutations.
Tang et al. claim seven synonymous and one nonsynonymous substitutions have a
derived frequency >0.5. However, because synonymous sites are 20 times more
diverged than nonsynonymous sites to the most closely related bat sequence RaTG13
(Figure 3), the difference between these two ancestral states is much larger in
synonymous sites. Therefore, synonymous substitutions are much more likely to be
mispolarised than nonsynonymous ones. This is because new synonymous substitutions
in the outbreak are much more likely to mutate back to this deeper ancestral state in the
tree than new nonsynonymous substitutions. Therefore, using this flawed definition of
“derived”, an artefactual excess of high frequency synonymous substitutions resembling
purifying selection will be observed, without any such selection having occurred.
In addition, the way these data are presented in Tang et al.’s Figure 2 will falsely
suggest that purifying selection is acting, even if their methodology was sensible, and
there were no such selection. The height of the bars in their figure compares the raw
numbers of mutations at each frequency without scaling the heights of the bars for the
number of each class of mutation. Because there is a greater number of
nonsynonymous substitutions than synonymous substitutions in the population, and as
most substitutions are expected to be at low frequency in a population regardless of the
action of natural selection (Fay and Wu 2000), this presentation will always make it look
like there’s proportionately more low frequency nonsynonymous substitutions.
https://mc.manuscriptcentral.com/vevoluWhen interpreting their results, Tang et al. do not consider that sequencing error could
be a driver of a relative excess of singleton nonsynonymous substitutions. This
possibility is important because sequencing errors will be at low frequency as they are
rare and cannot be transmitted, but real mutations can be at any frequency because
they can be transmitted. Additionally, purifying selection can only act on real mutations,
and not sequencing errors, so strongly deleterious/lethal nonsynonymous substitutions
which cannot be observed as real mutations may appear as sequencing errors.
Therefore it is very possible that sequencing error mutations will have a higher
Downloaded from https://academic.oup.com/ve/advance-article-abstract/doi/10.1093/ve/veaa034/5827470 by guest on 06 May 2020
nonsynonymous to synonymous ratio, and these mutations will be at low frequency. This
pattern will mimic the action of purifying selection on circulating variation, suppressing
the frequency of nonsynonymous substitutions.
On a more technical point, Tang et al. used the software PAML (Yang 2007) to estimate
selection parameters and look for evidence of positive selection in the divergence
between SARS-CoV-2 and other related coronaviruses. PAML does not allow for
synonymous rate variation, but they explicitly state in the paper they believe there are
mutational hotspots. Recent work has shown that false positive rates of positive
selection inference are unacceptably high when such synonymous rate variation occurs
(Wisotsky et al. 2020). Therefore, if there truly is synonymous rate variation, to reliably
identify signatures of positive selection within the phylogeny of SARS-CoV-2, methods
which model mutation rate variation must be used (e.g., provided by many of the models
from the Hyphy package- Pond and Mute 2005).
Given the flaws described above, we believe that Tang et al.’s claims are clearly
unsubstantiated. The widespread media interest in this paper (186 articles at last count),
and many comments on social media, suggests that the claim of increased
aggressiveness in SARS-CoV-2 has already caused unnecessary concern and
confusion at a crucial time in the pandemic.
A recent paper has proposed three ‘types’ of SARS-CoV-2 (Forster et al. 2020) and has
also received substantial attention in the media. Although that paper does not make any
claims of any functional differences among these ‘types’, many of the issues discussed
above apply again to this work. The network Forster et al. produce uses the RaTG13 bat
sarebecovirus sample to infer the ancestral state of the outbreak. By ignoring the
temporal information given by the viral tree and the decades of evolution separating
RaTG13 and SARS-CoV-2, the inferred ancestor of the outbreak in this network is likely
to be incorrect. The choice of which and how many clusters in the network were named
was made on the basis of the number of samples belonging to, and surrounding, each
node. This methodology means that the sampling biases described above are very likely
to be driving this classification.
Although rapid publication is critical for unfolding disease outbreaks, thorough and
independent peer review should not be bypassed to get results published quickly. The
current intensity of media interest in virology is unprecedented, and whilst rapid open-
access research is paramount, researchers must be cautious of over-interpretation of
data and the language used to describe results.
https://mc.manuscriptcentral.com/vevoluReferences.
Bhattacharya, Tanmoy, et al. ‘Founder Effects in the Assessment of HIV Polymorphisms
and HLA Allele Associations’. Science, vol. 315, no. 5818, Mar. 2007, pp. 1583–
86, doi:10.1126/science.1131528.
Boni, Maciej F., et al. "Evolutionary origins of the SARS-CoV-2 sarbecovirus lineage
responsible for the COVID-19 pandemic." bioRxiv, 2020,
Downloaded from https://academic.oup.com/ve/advance-article-abstract/doi/10.1093/ve/veaa034/5827470 by guest on 06 May 2020
doi:10.1101/2020.03.30.015008.
Chen, Chia-Yen, et al. “Open Reading Frame 8a of the Human Severe Acute Respiratory
Syndrome Coronavirus Not Only Promotes Viral Replication but Also Induces
Apoptosis.” The Journal of Infectious Diseases, vol. 196, no. 3, Aug. 2007, pp.
405–15, doi:10.1086/519166.
Consortium, The Chinese SARS Molecular Epidemiology. “Molecular Evolution of the
SARS Coronavirus During the Course of the SARS Epidemic in China.” Science,
vol. 303, no. 5664, Mar. 2004, pp. 1666–69, doi:10.1126/science.1092002.
Deng, Xianding, et al. "A Genomic Survey of SARS-CoV-2 Reveals Multiple Introductions
into Northern California without a Predominant Lineage." medRxiv 30, Mar. 2020,
doi:10.1101/2020.03.27.20044925
Diehl, William E., et al. “Ebola Virus Glycoprotein with Increased Infectivity Dominated the
2013–2016 Epidemic.” Cell, vol. 167, no. 4, Nov. 2016, pp. 1088-1098.e6,
doi:10.1016/j.cell.2016.10.014.
Fay, J. C., and C. I. Wu. ‘Hitchhiking under Positive Darwinian Selection.’ Genetics, vol.
155, no. 3, July 2000, pp. 1405–13.
Foley, B., et al. “Apparent Founder Effect during the Early Years of the San Francisco HIV
Type 1 Epidemic (1978–1979).” AIDS Research and Human Retroviruses, vol. 16,
no. 15, Oct. 2000, pp. 1463–69, doi:10.1089/088922200750005985.
Forster, Peter, et al. “Phylogenetic Network Analysis of SARS-CoV-2 Genomes.”
Proceedings of the National Academy of Sciences, Apr. 2020,
doi:10.1073/pnas.2004999117.
Gudbjartsson, D. F., et al. “Spread of SARS-CoV-2 in the Icelandic Population.”, New
England Journal of Medicine, Apr. 2020, doi:10.1056/NEJMoa2006100.
Gardy, Jennifer L., and Nicholas J. Loman. “Towards a Genomics-Informed, Real-Time,
Global Pathogen Surveillance System.” Nature Reviews Genetics, vol. 19, no. 1,
Jan. 2018, pp. 9–20, doi:10.1038/nrg.2017.88.
Keightley, Peter D., and Benjamin C. Jackson. “Inferring the Probability of the Derived vs.
the Ancestral Allelic State at a Polymorphic Site.” Genetics, vol. 209, no. 3, July
2018, pp. 897–906, doi:10.1534/genetics.118.301120.
https://mc.manuscriptcentral.com/vevoluMarzi, Andrea, et al. “Recently Identified Mutations in the Ebola Virus-Makona Genome
Do Not Alter Pathogenicity in Animal Models.” Cell Reports, vol. 23, no. 6, May
2018, pp. 1806–16, doi:10.1016/j.celrep.2018.04.027.
Muth, Doreen, et al. “Attenuation of Replication by a 29 Nucleotide Deletion in SARS-
Coronavirus Acquired during the Early Stages of Human-to-Human Transmission.”
Scientific Reports, vol. 8, no. 1, Oct. 2018, pp. 1–11, doi:10.1038/s41598-018-
33487-8.
Downloaded from https://academic.oup.com/ve/advance-article-abstract/doi/10.1093/ve/veaa034/5827470 by guest on 06 May 2020
Pond, Sergei L. Kosakovsky, and Spencer V. Muse. “HyPhy: Hypothesis Testing Using
Phylogenies.” Statistical Methods in Molecular Evolution, edited by Rasmus
Nielsen, Springer, 2005, pp. 125–81, doi:10.1007/0-387-27733-1_6.
Rai, Mohammad A., et al. “Evidence for a ‘Founder Effect’ among HIV-Infected Injection
Drug Users (IDUs) in Pakistan.” BMC Infectious Diseases, vol. 10, no. 1, Jan. 2010,
p. 7, doi:10.1186/1471-2334-10-7.
Rambaut, Andrew, “Phylodynamic Analysis | 176 genomes | 6 Mar 2020”, Virological, 6
Mar. 2020, http://virological.org/t/phylodynamic-analysis-176-genomes-6-mar-
2020/356
Rambaut, Andrew, et al. “Phylogeny and the Origin of HIV-1.” Nature, vol. 410, no. 6832,
Apr. 2001, pp. 1047–48, doi:10.1038/35074179.
Rambaut, Andrew, et al. “A dynamic nomenclature for SARS-CoV-2 to assist genomic
epidemiology”, BioRxiv, 19 Apr. 2020, doi:10.1101/2020.04.17.046086
Singer, Joshua B., et al. “GLUE: A Flexible Software System for Virus Sequence Data.”
BMC Bioinformatics, vol. 19, no. 1, Dec. 2018, p. 532, doi:10.1186/s12859-018-
2459-9.
Su, Yvonne CF, et al. Discovery of a 382-Nt Deletion during the Early Evolution of SARS-
CoV-2. preprint, BioRxiv, 12 Mar. 2020, doi:10.1101/2020.03.11.987222.
Stamatakis, Alexandros. “RAxML Version 8: A Tool for Phylogenetic Analysis and Post-
Analysis of Large Phylogenies.” Bioinformatics, vol. 30, no. 9, May 2014, pp. 1312–
13, doi:10.1093/bioinformatics/btu033.
Tang, Xiaolu, et al. “On the Origin and Continuing Evolution of SARS-CoV-2.” National
Science Review, doi:10.1093/nsr/nwaa036.
Tsetsarkin, Konstantin A., et al. “Chikungunya Virus Emergence Is Constrained in Asia by
Lineage-Specific Adaptive Landscapes.” Proceedings of the National Academy of
Sciences, vol. 108, no. 19, May 2011, pp. 7872–77,
doi:10.1073/pnas.1018344108.
Urbanowicz, Richard A., et al. “Human Adaptation of Ebola Virus during the West African
Outbreak.” Cell, vol. 167, no. 4, Nov. 2016, pp. 1079-1087.e5,
doi:10.1016/j.cell.2016.10.013.
https://mc.manuscriptcentral.com/vevoluWisotsky, Sadie R., et al. “Synonymous Site-to-Site Substitution Rate Variation
Dramatically Inflates False Positive Rates of Selection Analyses: Ignore at Your
Own Peril.” 18, Feb. 2020 Molecular Biology and Evolution,
doi:10.1093/molbev/msaa037.
Virk, Ramandeep K., et al. ‘Divergent Evolutionary Trajectories of Influenza B Viruses
Underlie Their Contemporaneous Epidemic Activity’. Proceedings of the National
Academy of Sciences, vol. 117, no. 1 (7 January 2020): 619–28.
Downloaded from https://academic.oup.com/ve/advance-article-abstract/doi/10.1093/ve/veaa034/5827470 by guest on 06 May 2020
https://doi.org/10.1073/pnas.1916585116.
WHO “Pneumonia of unknown cause – China” 3, Jan. 2020
http://www.who.int/csr/don/05-january-2020-pneumonia-of-unkown-cause-
china/en/
Wong, Hui Hui, et al. “Accessory Proteins 8b and 8ab of Severe Acute Respiratory
Syndrome Coronavirus Suppress the Interferon Signaling Pathway by Mediating
Ubiquitin-Dependent Rapid Degradation of Interferon Regulatory Factor 3.”
Virology, vol. 515, Feb. 2018, pp. 165–75, doi:10.1016/j.virol.2017.12.028.
Wright, Sewall. "Statistical genetics and evolution." Bulletin of the American Mathematical
Society 48, 4, Apr. 1942, pp. 223-246. doi:10.1090/S0002-9904-1942-07641-5
Yang, Ziheng. “PAML 4: Phylogenetic Analysis by Maximum Likelihood.” Molecular
Biology and Evolution, vol. 24, no. 8, Aug. 2007, pp. 1586–91,
doi:10.1093/molbev/msm088.
Figure legends.
Figure 1. A visualisation of the genetic variation observed in the SARS-CoV-2 pandemic
sequences up until the 12th March 2020. Nonsynonymous (pink) and synonymous
(green) substitutions (with respect to Wuhan-Hu-1, GenBank accession number
MN908947) are represented in colour in each row, with rows labelled with the genome
position and corresponding ORF on the side. The mutations are plotted in a grid format
where each column is a sample and each row is a unique mutation at a given genome
position; mutations have been filtered to only display those observed in more than one
sample (74 nonsynonymous and 41 synonymous). The genome positions of some of the
most common mutations have been labelled directly on the plot. The plot was created
using the d3heatmap package in R, and the sample columns are clustered using Ward’s
method.
Figure 2. A phylogenetic tree of the SARS-CoV-2 outbreak data as of 2/3/20. The tree
was generated by the CoV-GLUE resource which uses the RAXML software (Stamatakis
2014). Branches and tips coloured blue have a serine at codon 84 in ORF8, red tips and
branches have a leucine.
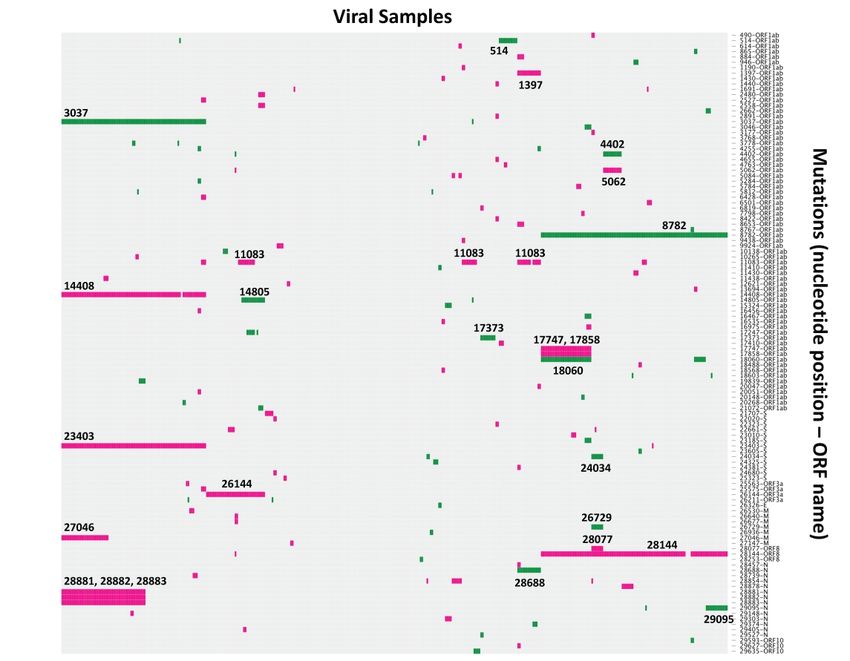
Figure 3. Schematic phylogenetic trees, not drawn to scale, inferred from
nonsynonymous (left) and synonymous sites (right) using the estimated divergence
values per site from Table 1 of Tang et al. (2020), assuming clock-like mutation rates.
https://mc.manuscriptcentral.com/vevoluThe last common ancestor (LCA) of the SARS-CoV-2 outbreak is much closer to that of
the LCA shared with the bat-infecting RaTG13 sample in nonsynonymous sites than in
synonymous sites. Accession numbers from gisaid for the RaTG13 and GD Pangolin-
CoV samples are EPI_ISL_402131 and EPI_ISL_410721 respectively.
Acknowledgements.
We would like to thank all the authors who have kindly deposited and shared genome
data on GISAID. A table with genome sequence acknowledgments can be found on the
Downloaded from https://academic.oup.com/ve/advance-article-abstract/doi/10.1093/ve/veaa034/5827470 by guest on 06 May 2020
CoV-GLUE website at http://cov-glue.cvr.gla.ac.uk/#/sequenceAcks. We thank Joseph
Hughes and Massimo Palmarini for helpful comments. All authors are funded by the
MRC (MC UU 1201412).
https://mc.manuscriptcentral.com/vevoluDownloaded from https://academic.oup.com/ve/advance-article-abstract/doi/10.1093/ve/veaa034/5827470 by guest on 06 May 2020
Figure 1. A visualisation of the genetic variation observed in the SARS-CoV-2 pandemic sequences up until
the 12th March 2020. Nonsynonymous (pink) and synonymous (green) substitutions (with respect to
Wuhan-Hu-1, GenBank accession number MN908947) are represented in colour in each row, with rows
labelled with the genome position and corresponding ORF on the side. The mutations are plotted in a grid
format where each column is a sample and each row is a unique mutation at a given genome position;
mutations have been filtered to only display those observed in more than one sample (74 nonsynonymous
and 41 synonymous). The genome positions of some of the most common mutations have been labelled
directly on the plot. The plot was created using the d3heatmap package in R, and the sample columns are
clustered using Ward’s method.
450x350mm (300 x 300 DPI)
https://mc.manuscriptcentral.com/vevoluDownloaded from https://academic.oup.com/ve/advance-article-abstract/doi/10.1093/ve/veaa034/5827470 by guest on 06 May 2020
Figure 2. A phylogenetic tree of the SARS-CoV-2 outbreak data as of 2/3/20. The tree was output from the
CoV-GLUE resource which uses the RAXML software (Stamatakis 2014). Branches and tips coloured blue
have a serine at codon 84 in ORF8, red tips and branches have a leucine.
763x630mm (72 x 72 DPI)
https://mc.manuscriptcentral.com/vevoluDownloaded from https://academic.oup.com/ve/advance-article-abstract/doi/10.1093/ve/veaa034/5827470 by guest on 06 May 2020
Figure 3. Schematic phylogenetic trees, not drawn to scale, inferred from nonsynonymous (left) and
synonymous sites (right) using the estimated divergence values per site from Table 1 of Tang et al. (2020),
assuming clock-like mutation rates. The last common ancestor (LCA) of the SARS-CoV-2 outbreak is much
closer to that of the LCA shared with the bat-infecting RaTG13 sample in nonsynonymous sites than in
synonymous sites.
422x157mm (192 x 192 DPI)
https://mc.manuscriptcentral.com/vevoluYou can also read