NORTH RODNEY UNITARY COUNCIL (NRUC) FINANCIAL BENCHMARKING MODEL - NORTHERN ACTION GROUP INC.
←
→
Page content transcription
If your browser does not render page correctly, please read the page content below
NRUC financial benchmarking model report – November 2017

NORTH RODNEY UNITARY COUNCIL (NRUC)
FINANCIAL BENCHMARKING MODEL

PREPARED FOR

NORTHERN ACTION GROUP INC.

BY

APR CONSULTANTS LTD

14 NOVEMBER 2017

APR Consultants Ltd                                                          i

NRUC financial benchmarking model report – November 2017

DISCLAIMER
Care has been taken in the production of this report to ensure its contents are as accurate as
possible. However, neither APR Consultants Ltd (APR) nor any other organisation takes
responsibility for incorrect information or decisions by any persons based on information in this
report.

ABOUT THE CONSULTANTS
APR Consultants Ltd (APR) is an award-winning multi-disciplinary company providing services for a
wide variety of organisations throughout New Zealand for the past 34 years. Clients include local
authorities, community trusts, voluntary organisations, central government agencies, major public
companies, private businesses, and individuals. The company has experience in a wide range of
strategic and business planning projects across a variety of fields.

CONTACT DETAILS
APR Consultants
PO Box 1715
ROTORUA 3040
www.aprconsultants.co.nz

APR Consultants Ltd                                                                             ii
NRUC financial benchmarking model report – November 2017
ABSTRACT
In August 2017, Morrison Low (ML) delivered a report to the Local Government Commission (LGC)
based on an investigation of options for local government reorganisation in Auckland. This included
findings for an option like the proposed new North Rodney Unitary Council (NRUC). ML concluded
there would be a year one (2015/16) deficit of $13.5 million and hence rates would need to increase
by 48% to cover the deficit. The Northern Action Group (NAG) has criticised the ML report for its
lack of transparency and absence of comparative data for councils other than Auckland.
This report by APR Consultants (APR) presents an independent financial model for the proposed
NRUC. The analysis uses publicly available data and transparent assumptions. It is based on
benchmarking the operating income and expenses of comparator unitary councils on a per capita
and per rating unit basis.
Council financial data was compiled from two sources to enable ‘triangulation’ of results:
Statistics New Zealand’s Infoshare online database (2015/16 data for all councils); and
Budgeted 2015/16 income and expenditure data for all councils from Long Term Plan online
pivot tables.
Key findings are:
Depending on the modelling approach taken, the year one (2015/16) operating position
ranges from approximately $5.5 million deficit to $5.0 million surplus. This indicates potential
for viability, subject to NRUC being committed to core service provision and financially
sustainable business practices.
Under alternative scenario assumptions for higher roading subsidies and lower debt levels,
the operating position improves materially.
Ten-year projections based on ML’s annual increases indicate that the operating position
would improve over the period 2015/16 to 2018/19, reduce for a period and then recover at
the end of the decade.
The APR analysis suggests the NRUC could be financially viable, subject to effective
implementation.
APR Consultants Ltd iii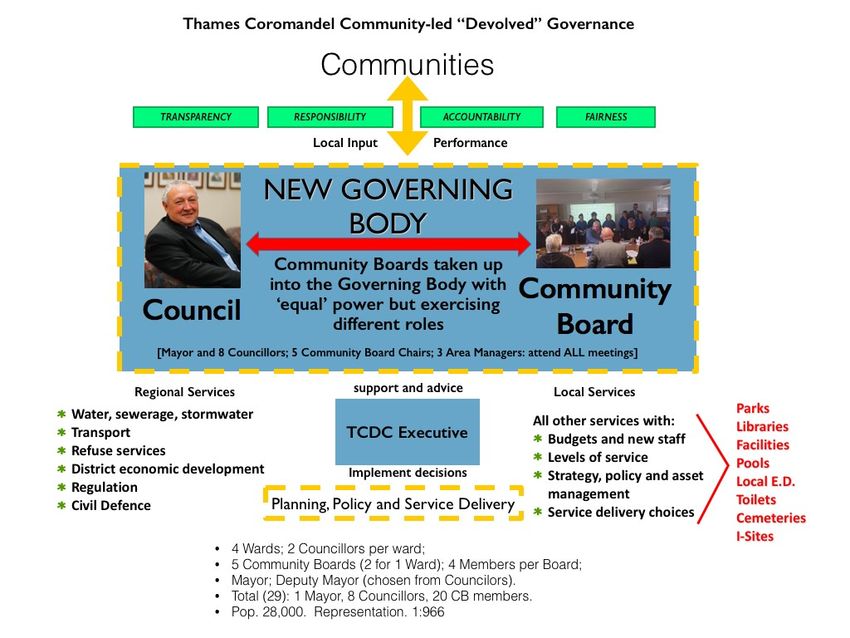
NRUC financial benchmarking model report – November 2017
EXECUTIVE SUMMARY
Introduction
This report presents an independent financial model of operating a new North Rodney Unitary
Council (NRUC). The analysis uses publicly available data and transparent assumptions. The report
was prepared by APR Consultants Ltd (APR) and commissioned by the Northern Action Group
(NAG) to inform its advocacy for the creation of the proposed NRUC.
The proposed NRUC would be focused on delivering:
a) ‘core business’ of statutory regulatory functions and community infrastructure such as roading
network, water reticulation, wastewater systems and storm-water management; and
b) a lower-cost but more community-engaged service model than is currently provided to
Northern Rodney by Auckland Council.
The analysis is based on benchmarking the operating income and expenses of comparator councils
on a per capita and per rating unit basis. Comparator councils were selected with relatively similar
attributes to the proposed NRUC, based on key metrics and client feedback. Council financial data
was compiled from two sources to enable ‘triangulation’ of results:
Statistics New Zealand’s Infoshare online database; and
Long Term Plan budgeted data for all councils, from online pivot tables.
Background – Morrison Low report 2017
In August 2017, Morrison Low (ML) delivered a report to the Local Government Commission (LGC)
based on an investigation of options identified by the LGC for local government reorganisation in
Auckland. For an option like the proposed NRUC, and based on the various assumptions
underpinning the analysis, ML concluded there would be a year one (2015/16) deficit of $13.5
million and hence rates would need to increase by 48% to cover the deficit. Moreover, the ML
analysis projected that the deficit would increase over the ten-year forecast period
NAG has publicly criticised the ML report, describing it as ‘fatally flawed’ and ‘of no credible value’.
Key criticisms of the report include:
ML and LGC have not made their full modelling analysis and data available for scrutiny.
ML’s expenditure analysis is largely based on Auckland Council (AC) figures. Hence a key
assumption of the analysis is that the cost structure of AC would apply in a separate NRUC.
No allowance has been made for the prospect of smaller councils benchmarking lower than
the analysis using AC data, either in general or in relation to specific activities. Moreover, AC
has not been able to provide accurate localised financial information for North Rodney at a
detailed level, so there is a low level of transparency behind the ML analysis.
The ML governance approach modelled for North Rodney is different from that proposed by
NAG (i.e. Thames-Coromandel District Council community empowerment model), nor does it
reflect the intended focus on core activities that benefit and are sought after by residents.
NAG argues that one can reasonably assume that due to diseconomies of scale, AC’s people
costs are up to 20% higher than in smaller more rural areas (i.e. approximately 8% higher
total expenses before finance costs).
Finance costs overstated. NAG contends the financing cost attributed to NRUC should be no
more than a small council average.
Reducing waste. NAG anticipates a conservative 2% reduction in costs across the NRUC by
reducing wasteful spending (i.e. an efficiency dividend).
APR Consultants Ltd iv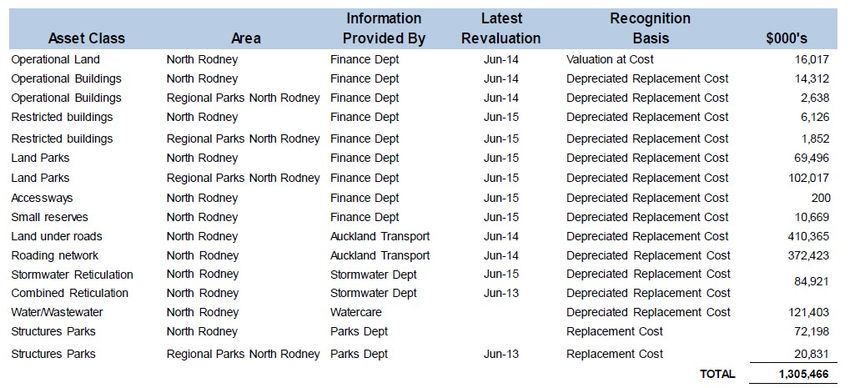
NRUC financial benchmarking model report – November 2017
In summary, NAG has argued that a leaner staffing approach, alternative assumptions in relation to
finance costs and an allowance for reducing waste would reduce annual expenditure and result in a
small annual surplus.
APR modelling approach and data
The modelling approach used for this report makes use of data from Infoshare, online Long-Term
Plan 2015/16 data and other publicly available sources. The approach is summarised as follows:
For comparison, use the same time horizon as the ML one-year and ten-year estimates.
Ensure a high level of documentation and transparency.
Use consistent national financial benchmarking datasets to enable inter-council comparability:
a) Infoshare government finance statistics for 2015/16 operating income and operating
expenditure by activity; and
b) Long Term Plan 2015/16 budgeted income and expenditure figures.
Identify prospective comparator councils with relatively similar characteristics to the proposed
NRUC, with the final selection of benchmark councils based on client feedback.
Compile additional financial indicator data to inform the context and findings.
Calculate the NRUC income and cost components based on comparator councils’ per capita
and per rating unit incomes and costs. Multiply the selected activity costs by the scale of
NRUC to derive a comparative NRUC profile using:
- 24,000 population; and
- 15,238 rating units.
Develop a one-year financial model based on benchmarked council income and activity costs.
Undertake sensitivity analyses for different assumptions (higher roading subsidy and different
debt finance assumptions).
Project the one-year model to a ten-year model using ML annual increase assumptions. Note
that this approach incorporates ML’s demand projections, price indexation and capital works
assumptions into a single annual increase, for comparability with the ML report’s projections.
This assumes that all AC capex information, as may be available, has already been
incorporated into the modelling (e.g. roading, water and wastewater projects scheduled).
Differences between the APR and ML financial data
The key issue to be addressed by this report is whether, using the best available comparable and
transparent data, the likely revenue and cost profile for the proposed NRUC would enable it to be
financially viable? This is undertaken using publicly available data as input to a financial
benchmarking approach. The approach seeks to establish, based on the 2015/16 financial
performance of comparable councils, whether a NRUC is a reasonably practical financial option;
and hence question the negative conclusion of the ML report (i.e. $13.5 million deficit) based on
AC’s cost data and ML’s assumptions.
There are substantial differences in income and expenditure data between the APR and ML
modelling, along with category differences. Direct comparisons between the APR (Infoshare and
LTP) and ML data and results are unfortunately not possible. General information about the key
differences are described in Appendices to this report. In summary:
Both the LTP and Infoshare data include depreciation expense. Within the Infoshare data, this
is apportioned across activities. Within the LTP data, it is reported at a council level only.
Both the Infoshare and LTP data are GST exclusive.
The Infoshare data is underpinned by the international Government Finance Statistics (GFS)
standard that enables economic analysis of local, central, and general government financial
activity. GFS was developed specifically for measuring government financial activity. It is the
IMF's preferred standard for publishing financial statistics on government. The database
APR Consultants Ltd v
NRUC financial benchmarking model report – November 2017
coverage includes all local authorities (city councils, district councils, unitary authorities, and
regional councils) and local government special-purpose entities, such as Auckland Transport
and museums.
The online LTP pivot table data was compiled from source documents by the Department of
Internal Affairs. Key income and expenditure data used for this report are from Statements of
Financial Performance.
ML created a financial model based on an apportionment of Auckland Council (AC) financial
information to the affected areas based on operational and capital expenditure for 2015/16
(actual) using an apportionment methodology. A key aspect of ML’s assessment methodology
was the assumption that no efficiencies would be achieved through, for example, shared
service arrangements with Auckland Transport or Watercare. To determine the revenue and
expenditure associated with each of the identified options, ML requested AC’s 2015/16
Annual Report financial information on a geographic basis. The split of AC’s activities was
also requested based on regional and territorial functions for the purposes of evaluating the
options. Outputs from this request are available online. Where actual local costs were
deemed to be available, ML incorporated these into its analysis. Where direct actual costs
were not available, assumptions were made regarding the notional apportionment of cost, for
example stormwater revenue and expenditure allocated based on length of the piped
stormwater network in the area.
APR modelling results and sensitivity/scenario analyses
Based on client feedback, the following comparator unitary councils were selected for inclusion in
the financial benchmarking analysis. Note there are currently six unitary authorities in New Zealand,
of which AC and the Chatham Islands are too large and too small respectively for realistic
comparison, and Nelson City is too urban. Also since the cost structure of AC activities are being
questioned, and its characteristics are so different from any other council in New Zealand, it is not
appropriate for use as a comparator council.
Note individual councils may resemble NRUC on some bases but are very different on others, for
example a council may have a similar population profile but different rating unit profile. Hence, the
analysis results are sensitive, not only to the choice of comparator councils but also to the choice of
denominator (per capita or per rating unit). For this reason, a range of financial results are
presented from which the reader can assess the anticipated level of financial viability for NRUC. 1
Selection of comparator unitary councils
Council Population Population Rating Length of Operating Operating
density units unsealed roads expenses per expenses per
per 1000 capita (Infoshare) capita (LTP)
population
NRUC 24,000 18 15,238 20 n/a n/a
Tasman District Council 50,200 5 23,847 31 1,804 2,010
Marlborough District Council 45,500 4 26,479 28 2,226 2,154
Gisborne District Council 47,800 6 23,630 28 1,754 1,754
Based on the above approach, and on publicly available data from Infoshare, LTP and other
sources, the NRUC is estimated to have in year one (2015/16):
annual operating income in the range of approximately $38 million to $69 million depending
on the data source (Infoshare or LTP), the choice of comparator council, and the estimation
approach (per capita or per rating unit);
annual expenses in the range of approximately $42 million to $65 million; and
1
APR developed an integrated financial benchmarking tool using Infoshare, LTP and other publicly available data to enable rapid
analysis of results using alternative sets of comparator councils.
APR Consultants Ltd vi
NRUC financial benchmarking model report – November 2017
annual operating position in the range from approximately $5.5 million deficit to $5.0 million
surplus.
The table below summarises Year One summary results for each of the datasets – the ML report
and the APR results using Infoshare and LTP data, and using both the per capita and per rating unit
approach. Analyses of these results show that:
Across the three comparator councils, two datasets and two financial benchmarking
approaches, the average operating income was approximately $53.9 million and average
operating expenditure approximately $52.2 million, giving an average operating surplus of
approximately $1.7 million.
By comparison, the ML report’s operating income was around 18 per cent higher than the
APR average and the ML report’s operating expenditure was around 48 per cent higher,
resulting in ML’s finding of $13.5 million deficit.
Year One (2015/16) summary results – ML, Infoshare and LTP data ($m)
Operating income Operating expenditure Operating position
ML Report 63.5 77.0 -13.5
APR - Infoshare data - per capita approach:
Tasman DC profile 47.1 43.3 3.8
Marlborough DC profile 54.7 53.4 1.3
Gisborne DC profile 37.8 42.1 -4.3
APR - Infoshare data - per rating unit approach:
Tasman DC profile 62.9 57.9 5.0
Marlborough DC profile 59.7 58.3 1.4
Gisborne DC profile 48.6 54.1 -5.5
APR - LTP data - per capita approach:
Tasman DC profile 51.3 48.2 3.1
Marlborough DC profile 55.2 51.7 3.5
Gisborne DC profile 44.0 42.1 1.9
APR - LTP data - per rating unit approach:
Tasman DC profile 68.6 64.5 4.1
Marlborough DC profile 60.2 56.4 3.8
Gisborne DC profile 56.5 54.1 2.4
Sources: APR modelling results derived using Infoshare and LTP data. ML figures from Table 20 of ML report (2015/16 result).
APR sensitivity/scenario analysis results – per capita approach
The results using per capita benchmarking approach were altered to reflect different assumptions
as shown below. Different results would be achieved using alternative approaches.
Higher roading subsidy (Infoshare data)
There is a reasonable probability that NRUC would attract more than the minimum rate for its
roading subsidy. With the maximum FAR rate set at 75 per cent, the upper range can be
represented by a 50 per cent increase in the assumed subsidy level in NRUC’s year one income.
The results of this analysis are shown below. The additional income would improve the annual
operating position in each case (assuming no other changes in the model) by between $1.2 and
$1.8 million per annum.
Effect of higher roading subsidy on year one operating position ($m) – per capita approach –
Infoshare data
Tasman profile Marlborough profile Gisborne profile
Baseline one-year model $3.8m $1.3m -$4.3m
50% increase in roading subsidy $5.2m $3.1m -$3.1m
Difference +$1.4m +$1.8m +$1.2m
Note: Figures may not sum precisely due to rounding.
APR Consultants Ltd vii
NRUC financial benchmarking model report – November 2017
Different debt levels (LTP data)
A 50 per cent reduction in the interest expense would improve the annual operating position by
between approximately $0.5m and $2.3m (depending on modelling assumptions). Conversely, a 50
per cent increase in the interest expense would decrease the annual operating position by
approximately $0.6m to $2.4m (depending on modelling assumptions).
Effect of different debt levels on year one operating position ($m) – per capita approach –
LTP data
Tasman profile Marlborough profile Gisborne profile
Baseline one-year model $3.1m $3.5m $1.9m
50% decrease in finance cost $5.4m $4.4m $2.4m
Difference +$2.3m +$0.9m +$0.5m
50% increase in finance cost $0.7m $2.5m $1.3m
Difference -$2.4m -$1.0m -$0.6m
Note: Figures may not sum precisely due to rounding.
APR ten-year projection results
Consistent with the ML report, APR extended its year one financial model to project a year two to
year ten model. As per the ML report, the purpose of APR developing a ten-year projection was not
to develop a full operating plan but rather to broadly understand the implications of infrastructure
projects on financial sustainability. APR’s base forecasting assumptions were calculated by ‘back-
solving’ ML’s modelling results at an aggregate annual level in relation to revenue and expenditure
indexation, increases in the rating base, and the financial effects of asset depreciation and
investment in capital works.
Based on APR’s one-year model, extended to a ten-year time horizon using the above assumptions
and Infoshare-based data:
Using the per capita financial benchmarking approach:
– adopting the Tasman District income and expenditure profile, the annual surplus is
projected to peak at $5.4 million in 2018/19, reduce to $2.4 million in 2021/22 and then
recover to $6.6 million in 2024/25;
– adopting the Marlborough District income and expenditure profile, the annual surplus is
projected to peak at $2.9 million in 2018/19, reduce to an annual deficit of $1.3 million in
2021/22 and then recover to a surplus of $3.2 million in 2024/25; and
– adopting the Gisborne District income and expenditure profile, the annual deficit is
projected to reduce to $3.5 million in 2017/18, increase to an annual deficit of $7.8
million in 2021/22 and then reduce to a deficit of $5.3 million in 2024/25.
Using the per rating unit financial benchmarking approach:
– adopting the Tasman District income and expenditure profile, the annual surplus is
projected to peak at $7.2 million in 2018/19, reduce to $3.2 million in 2021/22 and then
recover to $8.8 million in 2024/25;
– adopting the Marlborough District income and expenditure profile, the annual surplus is
projected to peak at $3.1 million in 2018/19, reduce to $1.5 million deficit in 2021/22 and
then recover to $3.5 million in 2024/25; and
– adopting the Gisborne District income and expenditure profile, the annual deficit is
projected to reduce to $4.5 million in 2017/18, increase to an annual deficit of $10.0
million in 2021/22 and then reduce to a deficit of $6.8 million in 2024/25.
APR Consultants Ltd viii
NRUC financial benchmarking model report – November 2017
Summary and conclusion
This report presents an independent financial model of the prospective costs of operating a new
North Rodney Unitary Council (NRUC) using publicly available data and transparent assumptions.
The analysis is based on benchmarking the operating income and activity costs of comparator
councils on a per capita and per rating unit basis. Comparator councils were selected with relatively
similar characteristics to the proposed NRUC. Key findings are:
Depending on the modelling approach taken, the year one (2015/16) operating position
ranges from approximately $5.5 million deficit to $5.0 million surplus. This range confirms a
potential for viability and that a NRUC is a reasonably practical option, subject to NRUC being
committed to core service provision and financially sustainable business practices.
Under alternative scenario assumptions for higher roading subsidies and lower debt levels,
the year one operating position improves materially.
Ten-year projections based on ML’s annual increases indicate that the operating position
would improve over the period 2015/16 to 2018/19, reduce for a period and then recover at
the end of the decade.
Note that due to the lack of detailed information about how ML arrived at their estimates, which
makes it difficult to unpack the differences in accounting approaches and underlying data, it is not
possible to directly compare the ML income and expenditure figures with APR’s Infoshare and LTP
based results.
The findings in this report, based on financial benchmarking of comparable councils, publicly
available data and transparent assumptions, question and ultimately disprove the ML Report’s
contention that the proposed NRUC would not be a reasonably practical option. Overall the results
show that a NRUC could be financially viable, perhaps even showing significant financial benefits to
NR ratepayers, subject to effective implementation.
APR Consultants Ltd ix
NRUC financial benchmarking model report – November 2017

CONTENTS
PART ONE: FINANCIAL BENCHMARK MODELLING ...................................................................... 1

1.0   INTRODUCTION........................................................................................................................ 1
  1.1   Project scope and timeframes................................................................................................ 2
  1.2   Information sources ................................................................................................................ 2

2.0   APR MODELLING APPROACH AND DATA SOURCES ........................................................ 3
  2.1  APR approach ........................................................................................................................ 3
  2.2  Data sources for model development .................................................................................... 4
  2.3  Differences between the APR (Infoshare and LTP) and ML financial data .......................... 6

3.0   APR MODELLING RESULTS AND SENSITIVITY/ SCENARIO ANALYSES ........................ 9
  3.1  Key assumptions .................................................................................................................... 9
  3.2  APR modelling results .......................................................................................................... 11

4.0      SUMMARY AND CONCLUSIONS .......................................................................................... 18

PART TWO: BACKGROUND ............................................................................................................ 19

5.0   PROPOSED NEW COUNCIL .................................................................................................. 19
  5.1  Historical context of local government restructuring............................................................ 19
  5.2  Northern Action Group ......................................................................................................... 21
  5.3  Proposed NRUC – overview ................................................................................................ 23
  5.4  Proposed NRUC – 2013 financial assessment ................................................................... 34
  5.5  Larry N. Mitchell modelling approach .................................................................................. 36
  5.6  Limited data availability ........................................................................................................ 39

6.0   MORRISON LOW REPORT 2017 .......................................................................................... 40
  6.1  ML financial modelling approach ......................................................................................... 41
  6.2  Assumptions and results for ‘NRUC’ option ........................................................................ 47

7.0      NORTHERN ACTION GROUP CRITIQUE OF ML REPORT ................................................ 54

APPENDIX 1: ABOUT THE INFOSHARE FINANCIAL DATA......................................................... 58

APPENDIX 2: ABOUT THE LONG-TERM PLAN (LTP) FINANCIAL DATA ................................... 61

APPENDIX 3: ABOUT THE MORRISON LOW (2017) FINANCIAL DATA ..................................... 63

APPENDIX 4: COMPARISON OF INFOSHARE AND ML INCOME DATA .................................... 65

APPENDIX 5: COMPARISON OF INFOSHARE AND ML EXPENDITURE DATA ......................... 67

APPENDIX 6: CASE STUDY: THAMES-COROMANDEL DISTRICT COUNCIL ............................ 68

APR Consultants Ltd                                                                                                                         x
NRUC financial benchmarking model report – November 2017
PART ONE: FINANCIAL BENCHMARK MODELLING
1.0 INTRODUCTION
This report presents an independent financial model of the prospective operating income and
expenses of operating a new North Rodney Unitary Council (NRUC), based on benchmarking
publicly available financial data for comparator councils on a per capita and per rating unit basis.2
The report was commissioned by The Northern Action Group (NAG). The proposed new council
has been under discussion in North Rodney for many years.
Background is summarised as follows:
There is a perception, strongly held by some community members as reflected in NAG’s
submission and the LGC’s community survey, that Auckland Council provides insufficient
local services and at a relatively high cost. In other words, there is a sense that North
Rodney residents effectively subsidise other parts of Auckland with their rates but receive
little value-for-money from Auckland Council.3
The proposed NRUC would be focused on delivering:
a) ‘core business’ of statutory regulatory functions and community infrastructure such as
roading network, water reticulation, wastewater systems and storm-water management
b) a lower-cost but more community-engaged service model than is currently provided to
Northern Rodney by Auckland Council.
In August 2017, Morrison Low (ML) delivered a report to the Local Government Commission
(LGC) based on an investigation of seven options identified by the LGC for local
government reorganisation in Auckland. To assess the options, ML created a one year and
a forecast ten-year financial model, based on an apportionment of Auckland Council (AC)
financial information to determine if each of the potential local authorities would have the
resources necessary to effectively carry out its responsibilities, duties, and powers. For
Option 4 (like the NRUC), ML concluded that ‘results in a year one, estimated $13.5 million
deficit, which is forecast to increase over the ten-year forecast period. Rates would need to
increase by 48% in year one to cover the deficit. In addition, there are likely to be significant
capability and capacity issues for a unitary authority that has approximately half the
population of the smallest current unitary authority in New Zealand.’ 4
Subsequent comments by NAG to the LGC on the ML report were that the model was not a
correct representation of how such a reorganisation for North Rodney could best work and
was based on false assumptions.
Recent discussions with David Hammond of Hammond Robertson Ltd identified that a cost-
effective method would be based on average costs of councils with around 17,000 rateable
assessments. An alternative set of financial projections based on more robust assumptions
could be developed by examining the average income and expenses of comparator
councils.
This report summarises key results from a transparent financial benchmarking model which
shows that annual operating expenses can be kept within reasonable estimates of revenue.
2
Initial modelling also included ‘per ratepayer’ estimates that were generally between the per capita and per rating unit results.
Following client feedback, it was decided that ‘ratepayer’ numbers would not add value to the analysis and would just complicate it
since the per capita numbers and rating unit (RU) figures should capture the useful information. Note that RUs and population are
related based on density, and comparable councils should have comparable densities.
3
For example, NZ Herald opinion piece 26 October 2017 by environmental and infrastructure specialist Grant McLachlan: ‘Phil Goff
painting himself into corner over North Rodney’: www.nzherald.co.nz/opinion/news/article.cfm?c_id=466&objectid=11936636.
4
Note: excluding Chatham Islands Council which is governed by separate legislation and receives direct funding from the Crown.
APR Consultants Ltd 1NRUC financial benchmarking model report – November 2017
By commissioning an independent analysis, NAG is anticipating it can illustrate how other
councils provide better local services at lower costs than was assumed in the ML report.
1.1 Project scope and timeframes
The scope of this project was to develop and report on a comparative financial model of the likely
annual income and costs of service provision by activity for the proposed NRUC. The consultants
have taken a financial benchmarking approach based completely on publicly-available data to
provide a maximum level of transparency and replicability. The methodology and timeframes as
agreed with the client is summarised as follows:
Table 1: Project tasks and timeframes
Timeframe (2017) Task Description
Sept 1 Project commencement
Sept 2 Desktop review
Oct 3 Draft report and financial model
Oct 4 Final report and financial model
1.2 Information sources
Documents reviewed for the compilation of this report included:
APR Consultants Ltd (APR) Proposal September 2017.
Bill Townson Correspondence September 2017.
Project commencement notes September 2017.
Northern Action Group website: www.nag.org.nz/newcouncil.html
Northern Action Group (2013) ‘A proposal to form the North Rodney Unitary Council’.
Northern Action Group (2016) ‘A supplementary proposal on the formation of a North
Rodney Unitary Council’.
North Rodney asset valuations 2015 (LGOIMA response).
Larry N. Mitchell (2013) ‘The Mitchell Report on Financial viability of NRUC’, Appendix Four
of Northern Action Group (2013).
Bill Foster correspondence September 2017.
Morrison Low (2017) ‘Auckland reorganisation process: Auckland Options Assessment’.
Auckland Council data supplied to ML for the above: www.aucklandcouncil.govt.nz/about-
auckland-council/performance-transparency/privacy-official-information-requests/published-
responses-information-requests/Pages/local-government-commission-information-
request.aspx
Northern Action Group (2017) ‘Comments for the Local Government Commission (LGC) on
the Morrison Low (ML) report’.
Local Matters news article, August 2017.
Infoshare financial data for councils (Government finance): www.stats.govt.nz/infoshare/
Long Term Plan (LTP) financial data for councils:
www.localcouncils.govt.nz/lgip.nsf/wpg_URL/Resources-Download-Data-Local-Authority-
Long-Term-Plans?OpenDocument
Case Study of TCDC model of devolved operations and governance (developed for
Auckland Council review of Local Boards 2016).
Client feedback on initial draft reports.
APR Consultants Ltd 2NRUC financial benchmarking model report – November 2017
2.0 APR MODELLING APPROACH AND DATA SOURCES
2.1 APR approach
The modelling approach used for this report makes use of available existing data reported
through the ML and NAG reports and online through Infoshare and other sources to undertake a
financial benchmarking analysis of comparator councils with relatively similar attributes to the
proposed NRUC. The approach is summarised as follows:
As 2015/16 remains the most up-to-date official financial data, APR has adopted the same
time horizon as ML for its one-year and ten-year revenue and expenditure projections.
The APR analysis uses Infoshare and LTP data for operating income and expenditure to
enable inter-council comparability and consistency. APR’s approach is to develop income
and activity expenditure profiles for NRUC based on clearly identified benchmark councils,
with a clear rationale for each selection. We note that the mix of general and targeted rates
and user pays income will likely vary from the current Auckland Council (AC) status quo
under the proposed NRUC.
An initial set of comparator councils was selected based on gross population density, and
client feedback was sought on the selection. Client feedback primarily related to the need to
consider other unitary councils as key comparators.
Compile key financial data from Infoshare for each of the comparator councils including:
- operating income by source, including regulatory income and petrol tax (to inform
sensitivity analyses around roading subsidy income);
- operating expenditure by activity; and
- operating position (surplus or deficit).
Compile income and expenditure data from online LTP pivot tables compiled by the
Department of Internal Affairs. This secondary dataset used budget figures and is used in
this report to provide ‘triangulation’ of the Infoshare-based results.5
Develop a transparent set of assumptions around specific council benchmarks to adopt for
NRUC for each activity, being cognisant of the commitment to (i) core activities (e.g. roading
cost for North Rodney will be relatively high due to topography) and (ii) implementing a
community-led governance model.
Multiply the selected activity costs per capita, for each activity, by the total population and
number of rating units in NRUC to derive a comparative NRUC income and expenditure
profile range.
Develop one-year financial model based on benchmark council income and activity costs.
Undertake sensitivity analyses for different assumptions (e.g. higher roading subsidy and
different debt finance assumptions).
Project the one-year model to a ten-year model using ML annual increase assumptions.
Note that this approach incorporates ML’s demand projections, price indexation and capital
works assumptions into a single annual increase for comparability with the ML report’s
projections. This assumes that all AC capex information as may be available has already
been incorporated into the modelling (e.g. roading, water and wastewater projects
scheduled).
5
The LTP data was also chosen, somewhat arbitrarily, as the basis for APR’s sensitivity analyses around finance costs. Inherited debt
is an issue to be negotiated. NAG feels that North Rodney had less debt than the rest of the Rodney Council area at inception of the
‘super city’. NAG feels that for modelling purposes, debt needs to be in a reasonable ratio of approximately 1.5 times annual income
and not higher than 2. The approach of this report is to benchmark against similar councils and examine the financial impacts of
alternative assumptions.
APR Consultants Ltd 3NRUC financial benchmarking model report – November 2017 2.2 Data sources for model development The key data sources for this analysis are the Infoshare financial data for councils (Government finance) and online LTP pivot tables.6 This provides comparable financial information consistent between councils nationally.7 Infoshare data Income data items from Infoshare include:8 Rates Regulatory income and petrol tax Current grants, subsidies, and donations income Interest income Dividend income Sales and other operating income Total operating income. Expenditure data from Infoshare covers: Roading Transportation Water supply Wastewater Solid waste/refuse Environmental protection Culture Recreation and sport Property Emergency management Planning and regulation Community development Economic development Governance Council support services Other activities Total. Expenditure data items in Infoshare can also be classified by: Employee costs Depreciation and amortisation Current grants, subsidies, and donations expenditure 6 Refer www.stats.govt.nz/infoshare/ and www.localcouncils.govt.nz/lgip.nsf/wpg_URL/Resources-Download-Data-Local-Authority- Long-Term-Plans?OpenDocument. 7 All three key sources used in this report – the ML Report, Infoshare methodology and LTP online pivot tables – are silent on the topic of Goods and Services Tax (GST). NAG subsequently contacted Statistics New Zealand and the Department of Internal Affairs in late October 2017 and confirmed that the Infoshare and LTP data are both reported GST exclusive. 8 Data on financial position (balance sheet items) and operating surplus are also available in Infoshare. APR Consultants Ltd 4
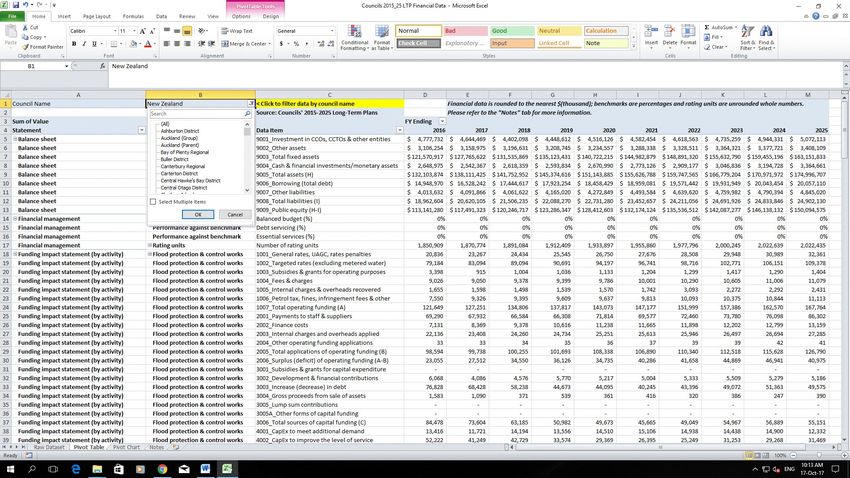
NRUC financial benchmarking model report – November 2017 Interest expenditure Purchases and other operating expenditure Total operating expenditure. Infoshare annual data are available for the full period 2003 to 2016. For this analysis, 2016 data (i.e. financial year 2015/16) has been compiled. Figure 1: Screen capture of online Infoshare database LTP data Income data items from the LTP pivot tables include:9 Rates income Targeted metered water rates Subsidies & grants income Other income Development & financial contributions. Expenditure data items from the LTP pivot tables include: Employee costs Interest expense Depreciation & amortisation Other operating expenditure. 9 The online pivot tables also include balance sheet data (assets and liabilities); Funding Impact Statement data for five infrastructure activities (i.e. partial operating expenditure allocation by activity); Statement of Financial Performance data (income and expenditure); Cash Flow Statement data; and Financial Benchmarks and Rating Units. APR Consultants Ltd 5
NRUC financial benchmarking model report – November 2017

Figure 2: Screen capture of online LTP pivot tables

2.3    Differences between the APR (Infoshare and LTP) and ML
       financial data
The key issue to be addressed by this report is whether, using the best available comparable and
transparent data, a hypothetical income and cost profile for the proposed NRUC could enable the
proposed council to be financially viable? This is undertaken using publicly available data as input
to a benchmarking approach. The approach used does not seek to establish that a NRUC would
be viable, only that it could be viable. In doing so, it questions the ML Report’s contention that a
NRUC would not be a reasonably practical option and provides evidence that disproves the ML
report finding.
There are differences in the scale of income and expenditure between the APR and ML
modelling, along with category differences. Direct comparisons between the APR (Infoshare and
LTP) and ML data and results are unfortunately not possible. Developing a detailed
understanding of these differences would be a major undertaking, and would require disclosure
by ML of their data and how their assumptions have been used. General information about the
key differences is described in the Appendices to this report and summarised below. The critical
issue is not which accounting treatment is better, but whether or the proposed NRUC would be
viable based on available financial data and transparent assumptions.
2.3.1 About the Infoshare financial data
Comparable financial data for every local authority in New Zealand is available on Statistics New
Zealand’s Infoshare online database: www.stats.govt.nz/infoshare/. The data collection and
reporting are underpinned by the international Government Finance Statistics (GFS) standard that
enables economic analysis of local, central, and general government financial activity based on
concepts and principles developed by the International Monetary Fund (IMF). GFS is a set of
concepts and principles developed specifically for measuring government financial activity.
Unlike accounting-based financial statements, GFS is an economic representation of a
government's financial activity. It is the IMF's preferred standard for publishing financial statistics
on government. Key Infoshare/GFS data for the purposes of this NRUC analysis are:
•     Operating income – funding earned to provide core services.
•     Operating expenditure – the amount spent on providing core services.

APR Consultants Ltd                                                                                  6
NRUC financial benchmarking model report – November 2017
The coverage of Infoshare’s online database includes all local authorities (city councils, district
councils, unitary authorities, and regional councils) and local government special-purpose entities,
such as Auckland Transport and museums.
The operations of council-controlled organisations (CCOs), which include local authority-owned
corporations or trading entities, are generally not part of the local government sector covered by
GFS, except for two CCOs that operate as non-market entities: Auckland Transport and Auckland
Tourism Events and Economic Development (ATEED).10
GFS are distinct from other government statistics, such as the national accounts and the Financial
Statements of the Government of New Zealand produced by Treasury, as they:
• are formatted to show all sectors of government and all levels of government distinctly;
• enable the analysis of not just the transactions within levels of government and between
levels of government, but also the transactions between the total public and private sectors;
• treat government as if it were one entity and net off all the transactions (and assets and
liabilities) it has with itself;
• provide an economic view of government, as opposed to an accounting view; and
• enable cross-country comparisons.
GST treatment
It is unclear from documentation whether the Infoshare expenditure data by activity are GST
exclusive. NAG subsequently followed up with Statistics New Zealand staff and confirmed that the
Infoshare data reported are GST exclusive, apart from some minor expenditure where councils
regard themselves as an end-user.
Depreciation
The Infoshare expenditure data include allowance for depreciation expense by activity and in
total.
2.3.2 About the LTP data
Data from online LTP pivot tables is used to ‘triangulate’ the results from the Infoshare analysis to
provide a greater sense of confidence in the overall results. The Department of Internal Affairs
website provides a series of financial tables compiled from councils’ LTPs.
Unlike the Infoshare data, LTP expenditure is not full classified by activity but rather by:
• Employee costs
• Interest expense
• Depreciation & amortisation
• Other operating expenditure.
Hence, this dataset does not enable sensitivity testing of expenses by activity (as is possible with
the Infoshare data). Another difference from the Infoshare data is that the LTP figures for 2015/16
are budgeted rather than actual reported values.
GST treatment
It is unclear from online documentation whether the Infoshare expenditure data by activity are
GST exclusive. NAG subsequently followed up with Department of Internal Affairs staff who
confirmed that the data compiled for all councils are GST exclusive.
Depreciation
The LTP expenditure data includes allowance for depreciation expense at the council level but
does not apportion this to individual activities.
10
Note: Further research by NAG and APR confirmed that in fact the 2015/16 total application of operating funding recorded in the
Infoshare database for Auckland Council ($2.623 billion) relates to the consolidated Auckland Council Group. The financial information
for CCOs will be included in the Group numbers.
APR Consultants Ltd 7NRUC financial benchmarking model report – November 2017
2.3.3 About the Morrison Low (2017) financial data
Morrison Low (ML) was commissioned by the LGC to independently investigate options identified
by the LGC for Auckland. To assess the options, ML created a financial model based on an
apportionment of Auckland Council (AC) financial information to the affected areas. More
specifically, the one-year model development was based on operational and capital expenditure
for 2015/16 (actual) using an apportionment methodology.
A key aspect of ML’s assessment methodology was the assumption that no efficiencies would be
achieved through, for example, shared service arrangements with Auckland Transport or
Watercare. ML assessed the options from the point of view of a district, regional or unitary
authority acting as a stand-alone entity.
ML created a one-year snapshot of the financial statements for each option based on the
Councils’ 2015/16 Annual Reports. ML used publicly available information from the Councils’
Long-Term Plans (LTP), Annual Plans and Annual Reports. Information was sourced from AC,
KDC, NRC, the LGC and Statistics New Zealand. Further details are not reported, for example on
level of comparability between the data sources or the scope of the financial data compiled.
To determine the revenue and expenditure associated with each of the identified options, ML
requested AC’s 2015/16 Annual Report financial information on a geographic basis. The split of
AC’s activities was also requested based on regional and territorial functions for the purposes of
evaluating the options. Outputs from this request are available online.
Where actual costs were deemed to be available, ML incorporated these into its analysis, for
example 'local activities' whose allocation is based on local board areas. Where direct actual
costs were not available, assumptions were made regarding the notional apportionment of cost to
the areas. Examples include stormwater revenue and expenditure being allocated based on
length of the piped stormwater network in the area, and regulation costs based on the number of
applications and licences in the area.
ML also reviewed major areas of expenditure where most of the costs are not asset based, for
example Governance and Organisational Support costs to identify if the total cost and the share
of overall costs was in line with their experience of working with other New Zealand councils. ML
state that where appropriate, they have compared these results with other similar councils under
the proposed option to provide confidence that the results were appropriate. ML noted that
“Benchmarking across councils is inherently difficult because of the differences between councils
due to such factors as population, land area, topography, rating base, demographics and local
economic characteristics. Councils also report costs in different ways, with allocation of
overheads having a significant impact on the reported cost of service delivery. Some New
Zealand councils have the benefit of substantial investments and well-maintained assets, while
others are facing a delayed maintenance and renewals workload on top of a falling rating base.
Our assessment is based on a typical New Zealand council operating model with a growing rating
base, as is the case for Auckland.”11
GST treatment
The ML report is silent on the topic of GST. Online information from AC as compiled for the ML
report says that the rating revenue figures exclude GST, whereas in the online financial
expenditure information AC is silent on GST treatment. AC’s 2015/16 LTP includes a mix of GST
exclusive and inclusive figures.
Depreciation
Depreciation expense was apportioned to different activity expenses using a range of methods
(e.g. asset values in each local area).
11
NAG and APR note that Auckland Council does not represent a typical New Zealand council operating model.
APR Consultants Ltd 8NRUC financial benchmarking model report – November 2017
2.3.4 Comparison of APR/Infoshare and ML income data (initial analyses)
APR modelling using benchmark Infoshare and LTP data for comparator councils arrives at a
similar level of rating revenue for NRUC as actual AC figures (i.e. approximately $30 million).12
However, there is a marked difference between the APR Infoshare and LTP-based estimates for
non-rating income and the ML estimates. APR’s initial estimate as part of a first-draft analysis for
client feedback was approximately $11 million non-rating revenue, for a total of approximately $41
million. In contrast, ML’s income estimates for the ‘NRUC’ option indicate non-rating revenue of
approximately $35 million for a total of $63.5 million (i.e. approximately 55% larger scale).
We note that depending on the choice of unitary council comparator subsequently used to
benchmark a NRUC, revenue could be as high as that estimated by ML.
2.3.5 Comparison of APR/Infoshare and ML expenditure data (initial analyses)
The expenditure data used by APR is measured in a consistent manner using Infoshare and LTP
methodologies. The figures arising from the ML analysis are underpinned by a less transparent
methodology that is not directly comparable.
Across the three comparator councils, two datasets and two financial benchmarking approaches
used in the APR analyses, the average operating expenditure was approximately $52.2 million,
giving an average operating surplus of approximately $1.7 million. By comparison, the ML report’s
operating income was around 18 per cent higher than the APR average and the ML report’s
operating expenditure was around 48 per cent higher, resulting in ML’s finding of $13.5 million
deficit.
To reiterate, the key issue to be addressed by this report is whether, using the best available
comparable and transparent data for benchmarking, the proposed NRUC could be financially
viable? Direct comparisons between the APR (Infoshare and LTP) and ML data and results are
unfortunately not possible. However, the critical question is not which accounting treatment is
better, but whether the proposed NRUC could be viable based on available financial data and
transparent assumptions. The following section seeks to address this question.
3.0 APR MODELLING RESULTS AND SENSITIVITY/
SCENARIO ANALYSES
3.1 Key assumptions
3.1.1 Establishment costs
Establishment costs are a one-off, stand-alone item that is not incorporated into subsequent
operational income and expenditure analysis. The estimation of establishment costs is outside the
scope of this project and not relevant to an assessment of the ongoing financial viability of a
NRUC. Positive findings from the APR analysis in terms of a projected surplus would be expected
in part to contribute towards the payment of any initial establishment costs.
3.1.2 Prospective comparative councils
An initial set of prospective comparator councils shown in the table below were selected based on
their broadly similar population and rural dominance, with Auckland Council also included for
comparison. An initial peer group was selected based primarily on gross population density (and
data availability), with client feedback sought on this selection. The population density variable is
expected to correlate well with the quantum of urban-focussed local government services required
by the resident population. NRUC’s density was estimated at 18.3 people per square kilometre,
which is around the mid-range of the selected district councils (ranging from 4.2 in South
Wairarapa up to 29.3 in Rotorua District). Three unitary councils were subsequently added to the
list based on client feedback: Tasman District, Marlborough District, and Gisborne District.
12
According to AC-provided information, total rates revenue excluding GST for the Wellsford and Warkworth subdivisions (the ML
proxy for North Rodney) in 2016/17 was $30.9 million.
APR Consultants Ltd 9NRUC financial benchmarking model report – November 2017
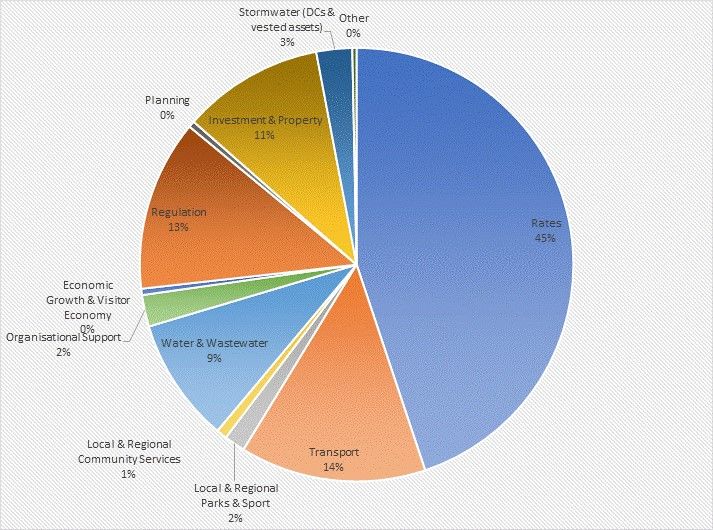
Key observations from the table below include:
The three unitary councils other than AC all have around twice the population count of the
proposed NRUC. However, they all have considerably lower population density than the
proposed NRUC. Hence, the operating expenses per capita for these councils could in
fact be higher than those of the proposed NRUC. In this regard, using the unitary councils
for financial benchmarking could be considered a conservative approach to testing the
viability of the NRUC (i.e. NRUC expenses per capita may in fact be lower).
The length of unsealed roads per 1,000 population for the three unitary councils other than
AC is around 50 per cent higher than the proposed NRUC. Again, using unitary councils
for benchmarking should therefore provide for a conservative approach to cost estimation
(i.e. NRUC roading expenses per capita would likely be lower).
Using Infoshare data, total operating expenses per capita for the three unitary councils
other than AC are higher than the overall AC expenses per capita. Using the LTP data, the
expenses per capita are similar or lower than AC. This highlights that there are substantial
differences between the Infoshare and LTP expenditure data. For this report, the main
analyses are done using Infoshare data with ‘triangulation’ of the results done using LTP
data to provide additional assurance using an alternate data source.
Table 2: Prospective comparator councils and their attributes
Council Population Population Rating Length of Operating Operating
density units unsealed expenses per expenses
roads per capita per capita
1,000 (Infoshare) (LTP)
population
NRUC 24,000 18 15,238 20 n/a n/a
Auckland Council 1,614,400 327 529,792 1 1,285 2,135
Hastings District Council 78,600 15 30,775 8 1,273 1,277
Hauraki District Council 19,550 15 10,669 7 1,659 1,669
Matamata-Piako District Council 34,100 19 15,160 4 1,306 1,382
Rotorua District Council 70,500 29 28,800 4 1,588 1,541
South Waikato District Council 23,800 13 10,675 1 1,356 1,267
South Wairarapa District Council 10,100 4 6,550 44 1,756 1,675
Thames-Coromandel District Council 28,400 13 27,129 13 2,605 2,829
Timaru District Council 46,700 17 22,599 28 1,504 1,530
Waikato District Council 71,200 16 28,984 11 1,423 1,352
Western Bay of Plenty District Council 47,800 25 20,624 7 1,494 1,592
Whanganui District Council 43,800 18 20,934 12 1,805 1,637
Waimakariri District Council 57,800 26 24,074 24 1,378 1,397
Tasman District Council 50,200 5 23,847 31 1,804 2,010
Marlborough District Council 45,500 4 26,479 28 2,226 2,154
Gisborne District Council 47,800 6 23,630 28 1,754 1,754
Sources: (1) Population data from Statistics NZ 2016 sub-national population estimates; (2) Population density (people for square km)
calculated from land areas extracted from the Taxpayers Union’s 2017 Ratepayers' Report sourced from: www.taxpayers.org.nz/; (3) Rating
units sourced from Department of Internal Affairs website: www.localcouncils.govt.nz/lgip.nsf/wpg_URL/Resources-Download-Data-Local-
Authority-Long-Term-Plans?OpenDocument, apart from a small number of councils for which missing RU data was compiled from online
2015/16 Annual Reports (specifically, Ashburton, Marlborough, Opotiki, Otorohanga, Ruapehu, Wairoa, and Whangarei district councils). (4)
Council expense data sourced from Statistics NZ Infoshare database and divided by population to give per capita amount. (5) Applications of
operating funding sourced from LTP budgeted information for 2015/16 available from spreadsheet on
www.localcouncils.govt.nz/lgip.nsf/wpg_URL/Resources-Download-Data-Local-Authority-Long-Term-Plans?OpenDocument.
3.1.3 Operating income data for prospective comparative councils
Having identified the comparator councils, the next step was to use the Infoshare database and
LTP pivot tables to identify key financial attributes for each council. Details were entered into a
spreadsheet which was developed into a financial benchmarking tool. Note that Infoshare and
LTP each use different accounting approaches.13 Infoshare and LTP data was collated on the
operating income for each comparator council, and then transformed to a per capita and per
rating unit basis. Note that individual councils may resemble NRUC on some bases but be very
13
Classifying detailed differences between the Infoshare and ML methodologies is out-of-scope of this project, however general
information on the key differences is in the Appendices.
APR Consultants Ltd 10You can also read