Latent demand for walking and cycling - Waka Kotahi ...
←
→
Page content transcription
If your browser does not render page correctly, please read the page content below
Latent demand for walking and
cycling
March 2021
J Beetham, WSP, Lower Hutt
V Ivory, WSP, Lower Hutt
J Thomas, WSP, Lower Hutt
P Kortegast, WSP, Nelson
D Cooper, WSP, Lower Hutt
J Burton, WSP, Lower Hutt
C Bowie, WSP, Lower Hutt (formerly)
L Malde, WSP, Napier
C Moore, WSP, Lower Hutt

NZ Transport Agency research report 676
Contracted research organisation – WSP New Zealand Ltd
Latent demand for walking and cycling

ISBN 978-1-99-004410-6 (electronic)
ISSN 1173-3764 (electronic)

Waka Kotahi NZ Transport Agency
Private Bag 6995, Wellington 6141, New Zealand
Telephone 64 4 894 5400; facsimile 64 4 894 6100
NZTAresearch@nzta.govt.nz
www.nzta.govt.nz

Beetham, J., Ivory, V., Thomas, J., Kortegast, P., Cooper, D., Burton, J., Bowie, C., Malde, L., & Moore, C.
(2021). Latent demand for walking and cycling (Waka Kotahi NZ Transport Agency research report 676).

WSP New Zealand Ltd was contracted by Waka Kotahi NZ Transport Agency in 2019 to carry out this
research.

                  This publication is copyright © Waka Kotahi NZ Transport Agency. This copyright work is
                  licensed under the Creative Commons Attribution 4.0 International licence. You are free to
copy, distribute and adapt this work, as long as you attribute the work to Waka Kotahi and abide by the other
licence terms. To view a copy of this licence, visit http://creativecommons.org/licenses/by/4.0/. While you are
free to copy, distribute and adapt this work, we would appreciate you notifying us that you have done so.
Notifications and enquiries about this work should be made to the Manager Research and Evaluation
Programme Team, Research and Analytics Unit, Waka Kotahi NZ Transport Agency, at
NZTAresearch@nzta.govt.nz.

Keywords: behaviour, cycling, latent demand, methods, model, walking

                                                       2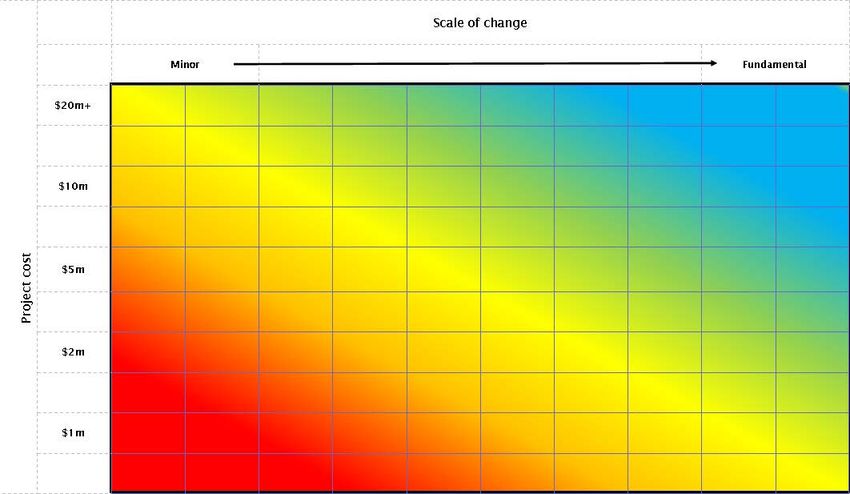
Latent demand for walking and cycling

An important note for the reader
Waka Kotahi NZ Transport Agency is a Crown entity established under the Land Transport Management Act
2003. The objective of Waka Kotahi is to undertake its functions in a way that contributes to an efficient,
effective and safe land transport system in the public interest. Each year, Waka Kotahi funds innovative and
relevant research that contributes to this objective.
The views expressed in research reports are the outcomes of the independent research and should not be
regarded as being the opinion or responsibility of Waka Kotahi. The material contained in the reports should
not be construed in any way as policy adopted by Waka Kotahi or indeed any agency of the New Zealand
Government. The reports may, however, be used by New Zealand Government agencies as a reference in
the development of policy.
While research reports are believed to be correct at the time of their preparation, Waka Kotahi and agents
involved in their preparation and publication do not accept any liability for use of the research. People using
the research, whether directly or indirectly, should apply and rely on their own skill and judgement. They
should not rely on the contents of the research reports in isolation from other sources of advice and
information. If necessary, they should seek appropriate legal or other expert advice.

                                                       3
Latent demand for walking and cycling

Acknowledgements
The authors would like to thank the following people for their contribution to this research.
The members of the steering group:

•   Jo Chang, Waka Kotahi and Research Project Manager

•   Claire Pascoe, Waka Kotahi and Research Owner
•   Leila Tayebi, Ministry of Transport

•   Nadine Dodge, Wellington City Council

•   Peter Nunns, Wellington City Council.

Our two peer reviewers: Michael Jongeneel at Flow Transportation Specialists Ltd and Glen Koorey at
ViaStrada Ltd.

John Lieswyn at ViaStrada Ltd for early input into the decision tree.
And all the study participants who contributed so generously through the survey and interviews.

                                                        4
Latent demand for walking and cycling

Abbreviations and acronyms
AADT                annual average daily traffic
ACCPDM              Auckland City Centre Pedestrian Demand Model

ACM                 Auckland Cycle Model

ARCM                Abley Route Choice Metric
CAU                 census area unit

CSCM                Christchurch Strategic Cycle Model

CyIPT               Cycling Infrastructure Prioritisation Toolkit

EEM                 Economic Evaluation Manual

GIS                 geographic information system

GPS                 Global Positioning System

LTNZ                Land Transport New Zealand

MoPeD               Model of Pedestrian Demand

MSPM                Modified Stated Preference Method

PCT                 Propensity to Cycle Tool

PIE                 Pedestrian Index of the Environment

SAMM                (Auckland) Strategic Active Modes model

SF-CHAMP            San Francisco Chained Activity Modeling Process

SFCTA               San Francisco County Transportation Authority

STEM                Strategic Transport Economic Model
TAZ                 Transport/Traffic Analysis Zone

TCM                 Tauranga Cycle Model

TTM                 Transtheoretical Model (of Intentional Behaviour Change)
WCDM                Wellington Cycle Demand Model

WTSM                Wellington Transport Strategy Model

                                                         5
Latent demand for walking and cycling

Contents
1     Introduction........................................................................................................................................... 12
      1.1      A brief introduction to the concept of latent demand.................................................................... 12
      1.2      The role of latent demand assessments ...................................................................................... 12
      1.3      Research overview ....................................................................................................................... 12
               1.3.1       Objectives ........................................................................................................................ 13
               1.3.2       Approach ......................................................................................................................... 13
      1.4      Report structure............................................................................................................................ 14
2     Review of the factors associated with walking and cycling ............................................................ 15
      2.1      Introduction................................................................................................................................... 15
      2.2      Individual and household factors ................................................................................................. 15
               2.2.1       Perceptions ..................................................................................................................... 15
               2.2.2       Sociodemographic ........................................................................................................... 16
               2.2.3       Capability and competency ............................................................................................. 16
               2.2.4       Trip purpose .................................................................................................................... 17
      2.3      Environments ............................................................................................................................... 17
               2.3.1       Active transport infrastructure ......................................................................................... 17
               2.3.2       Built environment ............................................................................................................. 18
               2.3.3       Natural environment ........................................................................................................ 18
               2.3.4       Policy and society ............................................................................................................ 19
      2.4      Complexity.................................................................................................................................... 19
               2.4.1       Interactions ...................................................................................................................... 19
               2.4.2       A whole-of-environment approach .................................................................................. 19
               2.4.3       Walking and cycling as separate but connected modes .................................................20
               2.4.4       Between-country differences: active transport maturity ..................................................20
      2.5      Behavioural factors discussion..................................................................................................... 20
3     Stocktake and assessment of walking and cycling latent demand estimation methods .............21
      3.1      Introduction................................................................................................................................... 21
               3.1.1       Methodology .................................................................................................................... 21
               3.1.2       Sample ............................................................................................................................ 21
               3.1.3       Presentation .................................................................................................................... 22
      3.2      Findings ........................................................................................................................................ 22
               3.2.1       Conceptualising latent demand estimation methods ......................................................23
               3.2.2       Latent demand estimation method categories ................................................................ 24
      3.3      Stocktake...................................................................................................................................... 25
               3.3.1       Pragmatic approaches .................................................................................................... 25
               3.3.2       Demand typology methods.............................................................................................. 31
               3.3.3       Stated preference ............................................................................................................ 34
               3.3.4       Revealed preference ....................................................................................................... 36
               3.3.5       Traditional transport models ............................................................................................ 39
               3.3.6       Geospatial assessment ................................................................................................... 48
               3.3.7       Accessibility ..................................................................................................................... 52
               3.3.8       Spatial dynamics ............................................................................................................. 53

                                                                              6
Latent demand for walking and cycling

                   3.3.9       Limitations of, and cautions for, latent demand forecasts ...............................................53
         3.4       Stocktake summary ...................................................................................................................... 55
4        Decision tree ......................................................................................................................................... 58
5        Walking and cycling demand case study database.......................................................................... 60
         5.1       Background .................................................................................................................................. 60
         5.2       Method ......................................................................................................................................... 60
         5.3       Database fields............................................................................................................................. 60
                   5.3.1       Fields development ......................................................................................................... 61
         5.4       Database generation .................................................................................................................... 61
         5.5       Results ......................................................................................................................................... 62
         5.6       Future database considerations ................................................................................................... 62
6        Conclusion and recommendations .................................................................................................... 64
                   6.1.1       Recommendations .......................................................................................................... 64
References ...................................................................................................................................................... 66
Appendix A: Stocktake survey ...................................................................................................................... 73
Appendix B: Case study database ................................................................................................................ 97

                                                                                  7
Latent demand for walking and cycling

Executive summary
Why was this research needed?
Various methods exist that attempt to identify and measure latent demand, or the ‘untapped potential’, for
walking and cycling, as well as to aid understanding of how improved provision for walking and cycling may
realise a portion of latent demand. However, estimating latent demand for walking and cycling is an
emerging science in New Zealand, with limited research into the application and effectiveness of the different
methods employed around the country over the past decade.

What was the purpose of the research?
Firstly, this research sought to understand how latent demand for both walking and cycling is currently
estimated in a range of New Zealand and overseas settings. Secondly, it sought to describe preferred
approaches that could be adopted nationally in New Zealand and recommend a method for developing and
testing estimates of latent demand.

How was the research conducted?
Firstly, a targeted review and summary of the literature was used to identify the range of factors associated
with walking and cycling travel behaviour and behaviour change. Next, methods for estimating latent demand
were identified through a review of the literature, as well as through a stakeholder and practitioner survey
that was distributed within New Zealand and internationally. Follow-up interviews were employed with some
survey respondents as required. The latent demand estimation methods were assessed based on the
findings of this process, as well as the findings of the walking and cycling behavioural review. The findings
were presented as a stocktake of the range of methodologies used over the last decade to estimate latent
demand for walking and cycling.

Secondly, findings from the first stage were used to create a decision tree to guide practitioners towards the
most fit-for-purpose methods to estimate latent demand for walking and cycling. The first stage also identified
the need for, and initiated the development of, a walking and cycling demand case study database to help
walking and cycling demand forecasting in New Zealand. This involved developing the database fields
(presented in a spreadsheet format) and populating the database with an initial set of case studies.

What did the research find?

Walking and cycling behaviour and behaviour change

How infrastructure changes affect individuals and communities is a reflection of many factors, as well as the
intended intervention itself. The implication of this for walking and cycling latent demand estimation methods
is that the transferability of data, factor associations, and parameters between places must be assessed
carefully. While the determinants of walking may overlap with those for cycling in some instances, they
diverge in others, and the strength of associations varies between modes. Methods for estimating latent
demand for walking and cycling must therefore consider the modes separately in order to adequately
represent them.

Stocktake of methods for estimating latent demand

The past decade has seen substantial progress made to develop the range and quality of methods used to
forecast latent demand for walking and cycling. It has also seen efforts made to better incorporate insights
from research into walking and cycling behaviour and behaviour change. As expected, this research found

                                                      8
Latent demand for walking and cycling

that methods to forecast demand for cycling were far more abundant and tended to be more advanced than
those for walking. Additionally, the information available about the various methods, their application, and
their evaluation is highly variable. As a result, it is challenging to make a thorough assessment and
comparison of many of the methods. Despite the recent progress that has been made, there was a general
level of caution among respondents as to the reliability of walking and cycling forecasts, with some
commenting that transportation forecasts in general are not seen as highly credible (for any mode).

A conceptual framework was proposed to assess latent demand estimation methods based on what goes in,
the process it goes through, and what comes out. This led to the categorisation of latent demand estimation
methods for walking and cycling into groups. These categories, and briefly summarised assessments, are
listed below.

•   Pragmatic approaches
    –   Tend to be quick and cost effective, employing data at hand, and adaptable to fit the purpose.
        Generally seen as having inconsistent accuracy.

    –   Tend to be used for smaller scale and budget applications.

•   Demand typologies

    –   Useful for understanding demand and latent demand characteristics across a population.

•   Stated preference based

    –   Useful for testing perceptions, and the potential behavioural response of those people with latent
        demand for walking and cycling, or to infrastructure that is new (ie, where there is no data on how it
        may be used).

    –   Can be seen as unreliable and prone to bias.

    –   May be best used in combination with other data (ie, revealed preference data).

•   Revealed preference based
    –   Tend to be seen as being more reliable than stated preference.

    –   Have limitations when real choices are constrained, applied to latent demand, or something new.

•   Traditional transport models
    –   The accuracy of any model is dependent on the quality of data and the robustness of the parameters
        of the model.

    –   May not readily account for behavioural ‘tipping points’ or changes in system dynamics.

    –   Applications for cycling are much more advanced than for walking.

    –   Capable of representing complex land use and transport interactions and trends over time, and
        multimodal transport systems at a network level.
    –   Various enhancements possible to better represent walking and cycling behaviour.

    –   Data and technology intensive.

•   Geospatial assessments

    –   Capable of integrating a wide range of complex geospatial information (including output from
        transport and other models) to form a comprehensive, multi-criteria assessment of walking and
        cycling demand.

                                                       9
Latent demand for walking and cycling

    –   Can be (but not always) more data and technology intensive.
Six core themes related to limitations and cautions of latent demand forecasts emerged from respondent
feedback in the survey and interviews:

1. The potential to reflect and exacerbate inequities: Walking and cycling demand forecasts may reflect
   existing patterns of transport system inequity, and therefore basing investments on them risks potentially
   further exacerbating inequities.

2. Balancing forecasting effort versus value: The importance of balancing the effort and cost of
   producing a reliable demand forecast with the value it provides.
3. Knowledge and data limitations: The major constraint in producing quality walking and cycling demand
   forecasts is a lack of knowledge and data.
4. The unknown future: Many forecasts cannot readily and reliably account for factors of the unknown
   future, such as new technologies and changing preferences.

5. Forecast evaluation limitations: Where evaluation either does not occur or is constrained.

6. Predicting and providing versus setting a target: Some respondents challenged the role of demand
   forecasts that project past trends to see ‘what is possible’ in the future, instead advocating that decision
   making should be vision-based, where the decision is made to achieve a particular result or target and a
   plan is made to achieve it.

Recommendations
The following recommendations are made based on the research findings.

Improved data collection and sharing

•   Efforts should be made to continue to improve the routine collection and sharing of quality walking and
    cycling count data across New Zealand, including establishing data standards and funding and
    contractual mechanisms to promote collection.

•   Consider the upkeep and development of the database of walking and cycling facilities and counts.

Improved demand forecasting guidance

•   Consider target-setting leading the forecast: setting a strategic target based on mode share, level of
    service, amenity, equity, or safety, and then using forecasts to prioritise facilities in reaching the target.

•   Consider promotion and use of the decision-tree approach.

•   Consider updating the New Zealand cycling sketch plan procedure.
•   Ensure that transport modelling guidance in New Zealand is suitable for walking and cycling models.

•   Consider pilot projects validating or adapting successfully tested open-source software tools, such as the
    Cycling Infrastructure Prioritisation Toolkit (CyIPT) and the complementary Propensity to Cycle Tool
    (PCT).

Advancing the state of practice
•   Encourage the sharing of methods, strengths, weaknesses and assessments to improve the state of
    practice and sense of legitimacy in New Zealand, such as peer review, mentoring, and workshops.

                                                        10
Latent demand for walking and cycling
Transparency and consistency
• Encourage demand forecasts to be produced with transparency around their assumptions (and the effect
of these) and limitations.
Abstract
Estimating latent, or suppressed, demand for walking and cycling is an emerging science in New Zealand,
with limited research into the application and effectiveness of the different methods employed around the
country over the past decade. This first stage of this research employed a literature review, and a survey and
interviews of practitioners, to understand how latent demand for both walking and cycling is currently
estimated in a range of New Zealand and overseas settings. It then assessed how well these methods
incorporate data and research about existing travel behaviours and travel behaviour change, and their
accuracy as determined by post-implementation count data (where possible). The second stage of this
research employed the findings from stage one to create a decision tree, or framework, indicating
approaches that could be adopted nationally in New Zealand for greater consistency in walking and cycling
demand estimation. It also identified the need for, and initiated the development of, a walking and cycling
demand case study database to aid the practice of forecasting walking and cycling demand in New Zealand.
This research found that the past decade has seen substantial progress made to develop the range and
quality of methods used to forecast latent demand for walking and cycling. It has also seen efforts being
made to better incorporate insights from research into walking and cycling behaviour and behaviour change.
As expected, it was also found that methods to forecast demand for cycling were far more abundant and
tended to be more advanced than those for walking. Additionally, the information available about the various
methods, their application, and their evaluation is highly variable and inconsistent.
11Latent demand for walking and cycling
1 Introduction
1.1 A brief introduction to the concept of latent demand
Clifton and Moura (2017) conceptualise latent demand simply as the ‘currently desired demand’ for travel
and activities ‘that is not realized because of a wide variety of constraints’ (p. 79). Accordingly, changes or
improvements to the transport system can induce or realise a portion of this latent demand. Clifton and
Moura (2017) suggest latent demand can be realised in two main ways: firstly as a redistribution of existing
travel, which can be as a change in spatial or temporal travel patterns, or a change in travel mode, frequency
or destination; and secondly as generative demand, which is the realisation of previously suppressed travel
or unmade trips. They also point out that the distribution of latent demand across a population may not be
evenly spread, with ‘those bearing the greatest consequences of suppressed demand’ being likely to be ‘the
poor, elderly, those with physical and mental limitations, communities of colour, and other disadvantaged
populations’ (Clifton & Moura, 2017, p. 78). Given that latent demand is likely to be distributed unevenly and
in a way that may compound other inequities, it seems appropriate that investigations into latent demand
should also consider inequities.
A latent (or suppressed) demand for walking and cycling can exist within people who currently exhibit little or
no walking or cycling behaviour. It can also exist within people who do already walk or cycle but would do so
more often if provisions for these modes were improved. For example, people may walk and cycle for some
trips, to some places, some of the time, but may like to walk or cycle for more (or new) trips, to more places,
more of the time, if they felt enabled to do so due to some relevant improvement. Additionally, even people
who walk or cycle at their current maximum capacity can have a latent demand for improvements to walking
and cycling provision. Improved provision may not always encourage them to walk or cycle more often, but it
may improve their walking or cycling experience, such as through increased feelings of safety or comfort, or
through a sense of legitimacy and being valued by society. An improved experience for people currently
walking or cycling may then enable or encourage them to continue to do so into the future, perhaps over the
various stages of their lives. For example, it has been shown that improvements in walking or cycling
provision can arrest an overall trend of decline in levels of walking or cycling (Keall et al., 2015). A stabilising
of levels of walking or cycling through the provision of improvements may not always appear to have realised
a latent demand for these modes, unless it is appropriately viewed within the context of a declining overall
trend.
1.2 The role of latent demand assessments
Various methods exist that attempt to identify and measure latent, or the ‘untapped potential’, demand for
walking and cycling, as well as to aid understanding of how improved provision for walking and cycling may
realise a portion of latent demand. High quality walking or cycling demand forecasts provide essential
evidence for both network planning and investment cases. However, estimating latent demand for walking
and cycling is an emerging science in New Zealand, with limited research into the application and
effectiveness of the different methods employed around the country over the past decade. Additionally,
different sized towns and cities need fit-for-purpose tools and approaches that are appropriate for their
context and levels of investment in walking and cycling infrastructure.
1.3 Research overview
This first stage of this research sought to understand how latent demand for both walking and cycling is
currently estimated in a range of New Zealand and overseas settings. It also assessed how well these
12Latent demand for walking and cycling
methods incorporate data and research about existing travel behaviours and travel behaviour change, and
their accuracy as determined by post-implementation count data (where possible). The second stage of this
research employed the findings from stage 1 to create a decision tree, or framework, indicating approaches
that could be adopted nationally in New Zealand for greater consistency in walking and cycling demand
estimation. It also identified the need for, and initiated the development of, a walking and cycling demand
case study database to aid the practice of forecasting walking and cycling demand in New Zealand.
1.3.1 Objectives
The main objectives of this research were as follows.
1. Review the range of factors known to be associated with walking and cycling travel behaviour and
behaviour change in order to assess their incorporation in latent demand estimation methods.
2. Review the range of methodologies used over the last decade to estimate latent demand for walking and
cycling, including an assessment of:
a. the methods’ advantages and disadvantages
b. how well different methodologies incorporate the insights of research into transport customer
behaviours
c. their accuracy as determined by post-implementation count data.
3. Describe preferred approaches for different geographic scales and levels of network investment that
could be adopted nationally in New Zealand for greater consistency in walking and cycling demand
estimation.
4. Recommend a method for developing and testing estimates of latent demand.
1.3.2 Approach
The approach taken to address each of the research objectives is presented below.
Objective 1 sought to identify the range of factors associated with walking and cycling travel behaviour and
behaviour change. This objective was addressed through a targeted review and summary of the literature.
Objective 2 is presented as a stocktake of the range of methodologies used over the last decade to estimate
latent demand for walking and cycling. Methods for estimating latent demand were identified through a
review of the literature and practice, as well as through a stakeholder and practitioner survey that was
distributed within New Zealand and internationally. Follow-up interviews were employed with some survey
respondents as required. The latent demand estimation methods were assessed based on the findings of
this process, as well as the findings of the walking and cycling behavioural review from Objective 1.
Objective 3 resulted in the creation of a decision tree to guide practitioners towards the most fit-for-purpose
methods to estimate latent demand for walking and cycling.
Objective 4 recommends a method for developing and testing estimates of latent demand. Based on the
findings of objectives 1 and 2, the research identified several potential areas to develop and test estimates of
latent demand, and these were presented to the research steering group. The steering group chose to
proceed with the development of a Walking and Cycling Demand Case Study Database. This involved
developing the database fields (presented in a spreadsheet format) and populating the database with an
initial set of case studies.
13Latent demand for walking and cycling
1.4 Report structure
The report is structured as follows.
• Chapter 2 presents the findings from the targeted review and summary of the literature into factors
associated with walking and cycling travel behaviour and behaviour change.
• Chapter 3 presents the findings of the primary data collected and review of the literature, which is a
stocktake and assessment of the range of methodologies used over the last decade to estimate latent
demand for walking and cycling.
• Chapter 4 contains the decision tree to guide practitioners towards the most fit-for-purpose methods to
estimate latent demand for walking and cycling.
• Chapter 5 outlines the process used to develop the database fields and populate the database with an
initial set of case studies.
• Chapter 6 provides an overall summary of the research and its recommendations.
14Latent demand for walking and cycling
2 Review of the factors associated with walking and
cycling
The purpose of this section is to review and discuss the range of factors associated with walking and cycling
travel behaviour and behaviour change. A particular focus was understanding the similarities and differences
in these factors for walking versus cycling, and the degree of consistency of association from place to place.
The findings from this review are summarised at the end of this section and are employed in Chapter 3 to
support the assessment of walking and cycling latent demand estimation methods.
2.1 Introduction
Identifying factors that lead to behaviour change requires a whole-of-environment approach. Socioecological
models of the determinants of wellbeing position individual behaviours as interacting within multiple contexts:
geographical scales of households, neighbourhoods, settlements, regions and countries, as well as social,
physical, cultural, economic, and political environments (Macintyre et al., 2002; Macmillan & Woodcock,
2017). How infrastructure changes affect individuals and communities will therefore be a reflection of many
other factors, as well as the intended intervention itself.
There has been considerable effort made to determine the factors associated with changing walking and
cycling behaviours. However, finding evidence for the effectiveness of interventions is challenging due to
differences in study goals (and therefore design), the diversity of interventions, and the variable quality of
studies (Stappers et al., 2018). For example, Stappers et al. (2018) found considerable variability in the
quality of how studies managed bias. They observed a greater likelihood of reporting a significant change in
outcomes among studies with a higher risk of bias, which could lead to an overestimation of effect if study
results are taken at face value. Study designs that incorporate wider, more extensive infrastructural changes
have also used more robust, complex survey designs with lower levels of bias risk. However, they argue that
the more rigorous study design may underestimate intervention effectiveness compared to simpler
interventions such as new cycling paths.
For the purposes of this review, we focus on factors at the individual and household level, and environmental
factors, including the natural and built environments as well as specific physical active transport
infrastructure and wider non-physical factors such as policies, so called ‘soft infrastructure’, and social norms
that reflect the context within which the interventions take place (Stappers et al., 2018).
2.2 Individual and household factors
Who you are matters for how much you walk and cycle. Individual and household factors that have been
identified as influencing walking and cycling behaviours include perceptions, sociodemographic
characteristics, capability and competency, and trip purpose. These are now discussed in more detail.
2.2.1 Perceptions
Individual perceptions of modes influence active transport behaviours and experiences. Subjective
perceptions include factors such as safety and aesthetics (Yang et al., 2019) as well as awareness or
knowledge of infrastructure and its accessibility (Goodman et al., 2013; Heesch et al., 2015; Song et al.,
2017). Perception of safety has been consistently identified as a strong factor that can encourage or
discourage active modes (Butler, 2015; Cheyne et al., 2015; Kingham et al., 2011; Rossetti et al., 2018;
Sullivan & O’Fallon, 2006). As Rossetti et al. (2018) state, this is likely because ‘users that feel cycling is
15Latent demand for walking and cycling
safer tend to cycle more’ (p. 252). Safety covers both threats from traffic and personal threats (eg, from
rough surfaces or from crime due to poor lighting) (Sullivan & O’Fallon, 2006). While perceiving cycling to be
safe from traffic has been associated with increased cycling, increased walking is associated with
perceptions of personal safety, particularly among women. Safety factors that have been identified as a
barrier to cycling include perceptions of driver attitudes and behaviours (Butler, 2015; Cheyne et al., 2015;
Kingham et al., 2011).
Route choice is thought to reflect perceptions of safety, comfort and aesthetics (Park & Akar, 2019; Pritchard
et al., 2019; Rossetti et al., 2018). For example, Rossetti et al. (2018) argue that objective safety measures
do not always correspond with subjective measures as a way of explaining the decision to cycle and route
choice. Cyclists are more likely to choose routes with higher comfort and aesthetic factors for recreational
trips, and will also choose slightly longer routes for transport-related trips if they have more comfort and
safety features such as greenery and fewer intersections (Park & Akar, 2019).
Perceptions and knowledge of where walking and cycling infrastructure is located is also related to usage
(Goodman et al., 2013; Song et al., 2017). Not surprisingly, if residents do not know about a walk or cycle
way, it is less likely their activity levels will be influenced by it. It also seems plausible that people may be
less likely to know about walking and cycling improvements when they are located away from more primary
travel routes.
2.2.2 Sociodemographic characteristics
There is mixed evidence for how sociodemographic factors influence walking and cycling behaviours. This
may in part be due to many studies over-representing certain population groups and/or preferences for active
transport. For example, Pritchard et al.’s (2019) study of route choice was sampled primarily from university
students who commute by bike. The iConnect longitudinal study of a natural experiment in infrastructure
intervention was skewed towards older, high socioeconomic status participants (Goodman et al., 2013).
Nevertheless, there are some consistent findings. Rowangould and Tayarani (2016) found that the presence
of bike paths was more important to women than men. In New Zealand, Sullivan and O’Fallon (2006) found
that more men cycled regularly than women, and that more women than men had never learnt to ride. New
Zealand research also shows that while cycling to work is not associated with any particular age group or
level of income, walking to work is more common for people who live in lower-income areas (Shaw et al.,
2015). On the other hand, Ton et al. (2019) did not find a gender effect in the Netherlands. Over and above
whether people cycle or walk, what matters about walking and cycling seems to vary depending on who you
are. Hebenstreit and Fellendorf (2018) found that different factors were more or less important by
sociodemographic factors. For example, natural environment features such as green spaces and flat
gradients were more important to those who were older and retirees than younger age groups and those in
employment or looking for work.
Children’s walking and cycling behaviours are heavily influenced by parental perceptions of safety (Carroll et
al., 2015; Ferenchak & Marshall, 2019) and complex household car-based commuting trips (Quigg &
Freeman, 2008), which can constrain children’s opportunities to be more active. Hinckson et al. (2017) found
in a New Zealand study that adolescent levels of physical activity were associated with aesthetic qualities
such as greenery and attractive buildings, as well as physical characteristics such as residential density.
2.2.3 Capability and competency
Capability and competency matter for both cycling and walking, but perhaps to a greater extent for cycling.
Capability, or experience, with walking and cycling matters for perceptions of safety and tolerance of lower
levels of facilities. For example, Rowangould and Tayarani (2016) found that those who already cycle for
utilitarian purposes would continue even if bike lanes and paths were not present. They concluded that
16Latent demand for walking and cycling
cycling facilities were more important to less experienced cyclists because of perceptions of safety. As well
as perceptions, having access to different forms of transport has been shown to correlate with transport
modes. Having a bicycle in the household is related to increased cycling, while car ownership decreases the
probability of walking and cycling (Ton et al., 2019). An implication of this is that children who grow up
without access to a household (or other) bicycle may be less likely to become capable and competent at
cycling, and this may interact with sociodemographic characteristics such as being from a household that
can afford to purchase and maintain bicycles. Beyond the household capability, bike share programmes that
provide relatively cheap access to bikes are thought to increase motivation to cycle (Kingham et al., 2011).
Enjoyment is also related to capability and capacity factors. Factors that increased enjoyment included:
• competency with cycling, including feeling confident (Kingham et al., 2011)
• experience with cycling, which increases enthusiasm and confidence, even in less-than-friendly cycling
environments (Butler, 2015)
• having the necessary gear (having a bike and helmet, suitable walking footwear, rainwear) (Kingham et
al., 2011)
• having facilities at destinations such as bike storage and changing facilities (Kingham et al., 2011).
2.2.4 Trip purpose
The purpose of cycling or walking also matters for how much people walk and cycle. Living in a
neighbourhood with a higher density of destinations has been associated with increased levels of physical
activity (including walking and cycling for both utility and recreation) (Ivory et al., 2015; Witten et al., 2012),
which is in part thought to be because trips can be made for purposes other than just exercise or recreation.
On the other hand, the need to trip-chain and the need to transport heavy items and children have acted as
barriers (Cheyne et al., 2015), which may interact with sociodemographic factors. For example, traditional
family roles of women with children may have affected the gender balance in cycling. Cheyne et al. (2015)
reported from a number of studies that greater distances to destinations were identified as a point of
resistance to active modes. Kingham et al. (2011) found that the purpose of the trip was part of people’s
mode decisions, such as commuting and recreational purposes, along with considerations such as
convenience, speed, ‘presentability’ on arrival, and trip chaining all featuring in mode choice.
2.3 Environments
Individual walking and cycling practices occur within natural, built and social environmental contexts. They
are influenced by, and in turn influence, what goes on around them at local, daily levels and in wider society
and longer-term timeframes. For example, a decision to cycle to work one day might be affected by local
weather conditions. It may also be influenced by what is considered ‘normal’ – for example, seeing others
walk on clearly marked footpaths as part of an everyday commute.
2.3.1 Active transport infrastructure
The presence and quality of active transport infrastructure influences walking and cycling behaviours. This
includes ‘hard’ infrastructure such as the streetscape (eg, footpaths, lighting), bicycle storage facilities, and
separated bicycle paths (Butler, 2015), and it also includes ‘soft’ infrastructure such as bike share
programmes (Fuller et al., 2013). As well as cycle- and walking-specific infrastructure, general street design
that incorporates cycle friendly features is important; for example, traffic-calming measures such as speed
humps that allow cyclists to easily ride through (Butler, 2015).
17Latent demand for walking and cycling
While shared paths provide separation from vehicle traffic, they do not necessarily increase cycling
behaviours. Shared paths where cyclists and pedestrians are mixed have been shown to negatively affect
cycling propensity (Deegan, 2015). Rowangould and Tayarani (2016) found that bike paths separated from
traffic were a stronger motivator to cycle than bike lanes. However, having something was better than
nothing; having no bike lane or path would lead to a reduction in cycling among less experienced cyclists.
2.3.2 Built environment
As noted above, trip purpose is an important influence on walking and cycling behaviours, and the built
environment acts as a major source of ‘purpose’. The built environment can provide purposeful destinations
such as libraries, playgrounds and shops (Ton et al., 2019; Witten et al., 2012) that motivate walking and
cycling. Mixed land use helps provide a wider density of destinations within a shorter distance than less
dense suburban form. Urban form factors such as higher densities of neighbourhood destinations and
dwellings are associated with higher levels of walking (Witten et al., 2011, 2012), and they encourage cycling
(Bauman et al., 2008).
2.3.3 Natural environment
Natural environment factors appear to play a key influencing role in walking and cycling because of how they
affect the pleasantness of the trip and the effort required. Weather and topography are likely to be factors
because they affect the pleasantness and comfort of the walking or cycling experience, as well as the
amount of physical effort required, which Cheyne et al. (2015) identified as a barrier to cycling. Weather
plays a significant role in mode choice across many studies and countries (Kingham et al., 2011; New
Zealand Transport Agency, 2019). In line with previous studies in New Zealand and overseas, Cheyne et al.
(2015, pp. 21–22) found that weather was cited as a main factor influencing whether or not survey
respondents will walk (62.5%) or cycle (59.3%). In the Netherlands, weather seems to be a stronger factor
for walking than cycling, but no relationship was shown between extreme weather and active transport
modes (Ton et al., 2019), suggesting a persistence in behaviours through varying weather conditions.
The topography of walking and cycling routes also plays a role in mode choice (Kingham et al., 2011). Chen
et al. (2018) showed that steepness is negatively associated with route choice for cycling. They found that
the steeper the route, the less likely a route is to be chosen. Topography for walking has been less
examined; in a review of accessibility measures, Vale et al. (2016) found only one example of topography
being included in accessibility indices (Pearce et al., 2006), but the index was not designed to be a
walkability index. It is not clear whether this is a methodological challenge yet to be overcome or whether
slope steepness is not considered to be a significant factor for predicting walking behaviours. Given the
variable topography in New Zealand towns and cities, capturing the presence of hills on walking routes may
be needed.
The natural environment also influences behaviour through various route qualities. They include aesthetics
(Cambra & Moura, 2020) and natural features such as waterways (blue space) and greenery (green space)
(Chen et al., 2018). Gatrell (2013) referred to such route qualities as providing therapeutic mobilities that
motivate activity in and through more pleasant and restorative environments (Ivory et al., 2015). Conversely,
walking and cycling through unpleasant, hazardous places is thought to bring health dis-benefits (Gatrell,
2013), acting as a disincentive to be active in such places. Such qualities are likely to matter both for
opportunities to engage in walking and cycling for recreation (are there pleasant places to walk?) and for
enhancement (or otherwise) of utilitarian trips. Increasing the pleasantness and comfort could increase the
utilisation of existing walking and cycling infrastructure.
18Latent demand for walking and cycling
2.3.4 Policy and society
Wider policy and societal factors affect walking and cycling behaviours. While not targeted at increasing
active transport modes, the introduction of congestion charges to reduce traffic volumes and speeds has
seen increases in cycling (Deegan, 2015). Traffic speed is consistently identified as a factor for cycling, both
in terms of perceptions of safety (as discussed above) and observed behaviours. For example, Chen et al.
(2018) found that routes with higher speed limits were less likely to be chosen by cyclists. Traffic and speed
reductions in central London from congestion charging appear to be linked to increases in cycling, along with
other infrastructure improvements and terrorism events that shifted people away from public transport to
walking and cycling (Deegan, 2015).
Social norms around walking and cycling will both affect and be affected by behaviour and the wider physical
environment, including provisions made for walking and cycling (Frohlich et al., 2001). That is, not seeing
others cycle can reinforce beliefs that cycling is unsafe and decrease the likelihood that people will cycle,
further reducing the chance of seeing cycling behaviours. Similarly, having visible active transport
infrastructure can normalise active transport practices, increasing the demand for further facilities and
fostering pro-cycling and walking practices. This recursive relationship between environments and
behaviours is likely to underpin observations where cycling and walking begets more cycling and walking
behaviour and demand for more facilities. Butler (2015) reported that comprehensive approaches to
incentivising cycling were more likely to increase cycling levels; as well as infrastructure improvements, wider
strategies such as restricting car use and pro-bike programmes were needed. Bauman et al. (2008) make
the point that the higher the level of cycling, the safer it is, which may in part be due to drivers’ increased
familiarity with, and improved attitudes towards, cyclists and infrastructure.
2.4 Complexity
2.4.1 Interactions
Individual factors often interact. For example, the time taken for a walking or cycling trip was seen as a
barrier only to those who do not walk or cycle for transport (Cheyne et al., 2015). Similarly, what might be
seen as a barrier to some, such as hills, can be seen as a challenge to others (Kingham et al., 2011).
Additionally, the relationships between factors and behaviours varied across countries and walking and
cycling contexts, suggesting social and cultural norms are likely to be part of the system. While ‘safety’ is a
consistent factor, for example, how it plays out may differ depending on the maturity of walking and cycling
infrastructure and behaviour.
2.4.2 A whole-of-environment approach
Walking and cycling infrastructure on its own is not enough, particularly if it is not connected to a wider active
transport network (Goodman et al., 2013; Stappers et al., 2018). Additionally, the choice to walk or cycle for
a trip with be affected by the relative utility (or generalised costs) of other transport options available, such as
driving or public transport. Factors that may affect the relative utility of transport options include monetary
costs (such as for fuel or public transport), congestion, travel time and reliability. In particular, the availability
of car parking has been shown to offset the effect of increased provisions for walking and cycling on mode
choice (Hamre et al., 2014).
The overall quality of the built and natural environment helps to make active transport modes possible and
desired. Urban form is needed to provide meaningful destinations that encourage utilitarian trips. General
street design can support more specific and specialised infrastructure by ensuring that walking and cycling
around neighbourhood streets is safe and efficient.
19Latent demand for walking and cycling
Urban form sets the scene for how easy it is to walk and cycle as well as providing purpose for trips. Factors
such as street connectivity and dwelling density affect the distance travelled, while streetscapes capture how
possible and pleasant it is to walk on pedestrian-appropriate surfaces. Having local destinations provided in
medium- and high-density urban form can provide a reason for local trips to be undertaken on foot or by bike,
rather than by private car. Combining ease and purpose can be key to shifting transport to more active
modes. An example of this is Wellington city, which has a relatively compact urban form and a relatively high
mode share of walk trips compared to other New Zealand cities.
2.4.3 Walking and cycling as separate but connected modes
Ton et al. (2019) found that walking and cycling have different determinants and that these determinants
matter to different extents. This suggests that walking and cycling modes must be considered separately
rather than being grouped together as a homogenous ‘active transport’ mode. On the other hand, active and
public transport modes appear to support each other (although perhaps in different ways). Heesch et al.
(2015) found that linking nodes allowed longer journeys; for example, being able to cycle to a ferry or rail
station where bikes can be loaded for the commute to the central business district. New Zealand research
has also shown that better integration between cycling and public transport would increase both cycling and
public transport levels of use (Ensor et al., 2010).
2.4.4 Between-country differences: active transport maturity
The discussion above has identified a range of factors shown to influence walking and cycling behaviours.
The extent to which they matter appears to vary between countries, suggesting wider socio-cultural factors
around active transport are likely to be at play. In the Netherlands, for example, factors such as weather,
seasonality, trip chaining, gender, and car ownership play much less of a role (Ton et al., 2019). Ton et al.
(2019) suggest this is because in the Netherlands, cycling and walking behaviours are relatively universal
and supportive infrastructure is comprehensive, meaning both of these active transport modes are
normalised. While factors such as cycle ownership are related to cycling behaviours in other countries, no
such relationship was seen in the Netherlands, perhaps showing a degree of active transport behavioural
and infrastructural ‘saturation’. The maturity of walking and cycling within a country may also help to explain
why shared pathways are more of an incentive in some countries than in others. Urban form may also
potentially moderate the ‘maturity’ factor. For example, New Zealand has plenty of footpaths but fewer
destinations in suburban than urban areas (Witten et al., 2011).
2.5 Behavioural factors discussion
This review presented a discussion of the range of factors associated with walking and cycling travel
behaviour and behaviour change. It has shown that while the determinants of walking and cycling may
overlap in some instances, they diverge in others, and also that the strength of association varies between
modes (for further detail see Ton et al., 2019). The implication of this is that methods to assess latent
demand for walking and cycling must consider them separately in order to adequality represent them. This
review has also shown that the factors influencing walking and cycling behaviour are dynamic, in that they
can vary substantially from place to place, perhaps indicated by active transport maturity. The implication of
this for walking and cycling latent demand estimation methods is that the transferability of data, factor
associations, and parameters between places must be assessed carefully.
The findings from this review are further employed in Chapter 3 to support the assessment of walking and
cycling latent demand estimation methods.
20Latent demand for walking and cycling
3 Stocktake and assessment of walking and cycling
latent demand estimation methods
3.1 Introduction
The objective of this chapter is to review the range of methods used over the past decade to estimate latent
demand for walking and cycling, including an assessment of:
• the methods’ advantages and disadvantages
• how well different methodologies incorporate the insights of research into transport customer behaviours
(from Chapter 2)
• their accuracy as determined by post-implementation count data.
3.1.1 Methodology
Methods for estimating latent demand were identified through a review of the literature and published
practice, as well as through a stakeholder and practitioner survey that was distributed within New Zealand
and internationally. Follow-up semi-structured interviews were employed with some survey respondents to
gather additional information as required. The latent demand estimation methods discovered were
categorised and assessed based on the findings of this process, as well as the findings of the walking and
cycling behavioural review from Objective 1.
For each method, we attempted to gather the following information (where available).
• Background
• Purpose
• Development and structural components (modes, variables, relationships, assumptions, data)
• Application and use (projects, before/after count data (accuracy), validation)
• Assessment: strengths and weaknesses, constraints
The survey was distributed using a ‘snowball’ sampling approach to ‘crowdsource’ methods and case studies
from a range of New Zealand and overseas practitioners and academics, as many are not documented or
are at least not publicly available. The survey was sent to an initial list of contacts identified during the
steering group meetings, from the peer reviewers, by the research team, and also through a question in the
survey. The survey also sought reflections of the current state of practice, as well as the need and potential
for improvement. The complete survey is presented in Appendix A.
3.1.2 Sample
The survey generated 31 complete responses. Additionally, five respondents chose to email feedback to the
research team rather than take the survey. Nine follow-up interviews were conducted, representing a range
of stakeholder and practitioner types, both over the phone and in person.
The survey respondents tended to be practitioners or researchers who had been involved in the
development or application of latent demand forecasting methods, with more complex modelling approaches
being highly represented in the sample. Given that, anecdotally at least, more complex modelling
approaches do not tend to be widely used in New Zealand practice, it appears the survey may have been
more engaging to practitioners who had substantial experience and involvement in the field rather than those
21You can also read