NRL Predictability Initiative and SAANGRIA
←
→
Page content transcription
If your browser does not render page correctly, please read the page content below
NRL Predictability Initiative
            and SAANGRIA
                                    James D. Doyle1
           Materhorn Collaboration: Josh Hacker2, and Materhorn Group
NRL Initiative: S. Eckermann3, S. Gabersek1, Q. Jiang1, A. Reinecke1, C. Reynolds1
              SAANGRIA Collaboration: D. Fritts4, R. Smith5, M. Taylor6

                           1NavalResearch Laboratory – Monterey, CA
                           2Naval Postgraduate School– Monterey, CA

                         3Naval Research Laboratory – Washington DC

       4Northwest Research Associates, Colorado Research Associates Division, Boulder, CO

                                5Yale University, New Haven, CT

                               6Utah State University, Logan, UT

                               Outline
                 1.NRL Initiative and SAANGRIA
                 2.T-REX Experiment and Dataset
                 3.COAMPS Predictability Tools
                 4.Research Focus for MURI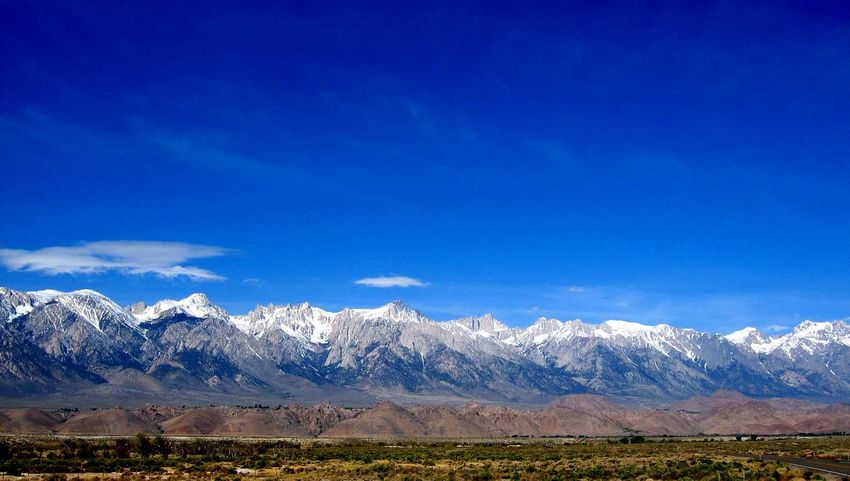
Mesoscale Predictability
Anthes et al. (1985) (and recently) argued
 that the predictability of many mesoscale
phenomena can exceed that suggested by
 Lorenz if they are organized by the large-
scale (e.g., fronts) or controlled by external
   forcing (e.g., orography, land use…).

                                 Questions
• Are mesoscale circulations forced by the synoptic-scale or lower boundary
  (e.g.,terrain) endowed with enhanced predictability? If so, to what degree?
• What are the characteristics of mesoscale predictability in such situations?
• How do gravity waves influence the predictability?
                                  Approach
• Use adjoints and ensembles to examine mesoscale predictability.
• Focus on initial condition sensitivity, perturbations growth, and scale
  interactions for a variety of mesoscale flows.
• Make use of field program datasets to test predictability hypotheses.
                                                                             2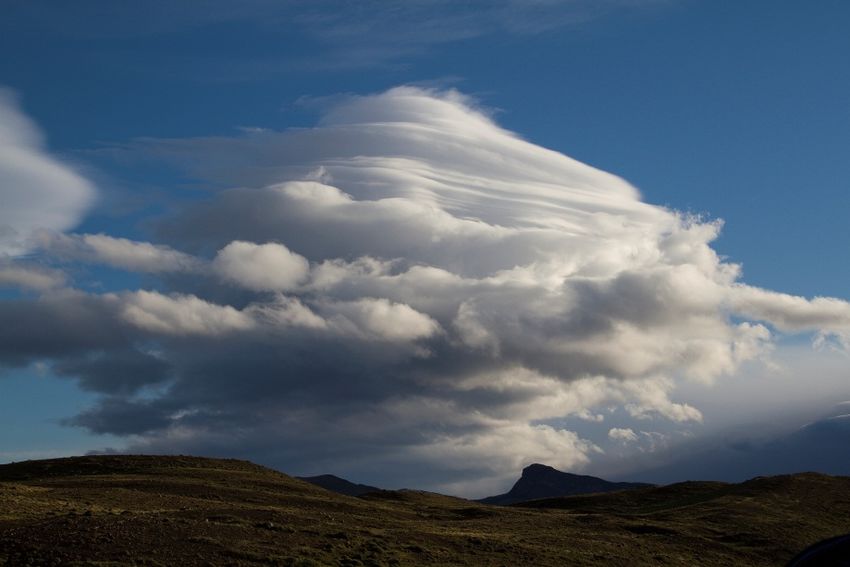
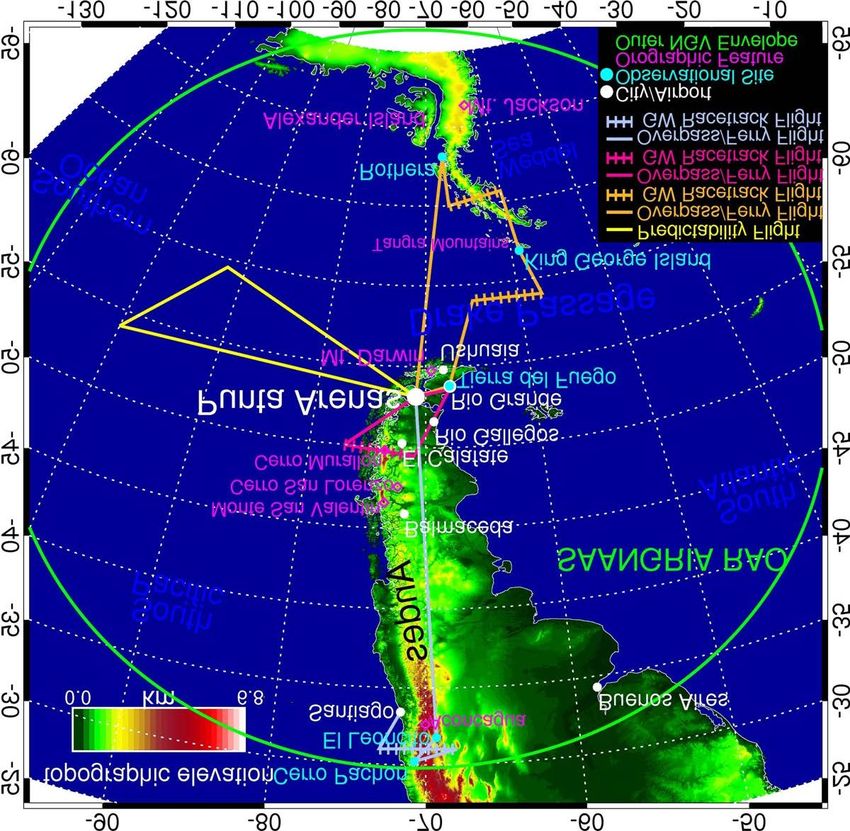
SAANGRIA
  Southern Andes – ANtarctic Gravity-wave InitiAtive
 PIs: D. Fritts, R. Smith, J. Doyle, S. Eckermann, M. Taylor
 Observe Gravity Waves in Planetary “Hotspot”
where they are intense, deep, persistent and generated by all
of the major sources (mountains, cyclones, jets, convection)

                          Gravity Wave Variances from MLS
                             Aura at 32 km (Aug 2006)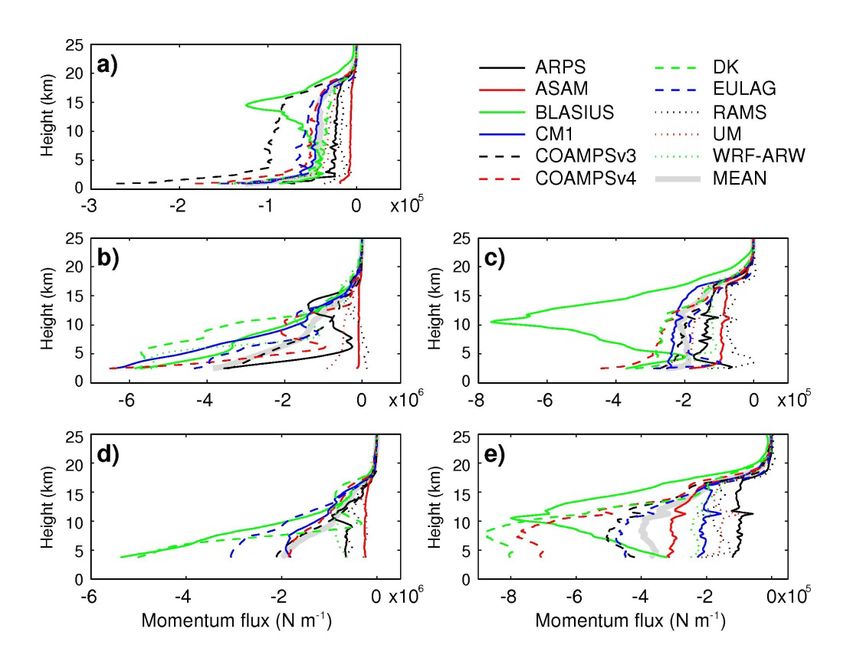
SAANGRIA Experimental Design
   10-week field program in austral winter ~June to September 2013
NSF/NCAR Gulfstream V (NGV)

     May Include Additional Aircraft (DLR Falcon, UK BAe146, European HALO)
Terrain-Induced Rotor Experiment
• Objective: Explore rotor, mountain wave dynamics & interaction with BL
• Included both mountain rotor and quiescent flow objectives
• Sierra Nevada and Owens Valley (March-April 2004 & 2006 with 29 IOPs)
• International effort [NCAR, DRI, NRL, DLR, NOAA, Leeds, Met Office,
  Universities (Yale, Stanford, Utah, Cal.-Berkeley, Washington, Houston)],
  PIs: V. Grubisic (DRI/NCAR/U. Vienna, NSF PI), J. Doyle (NRL)
• Observational Assets: 3 aircraft, 3 lidars, radars, profilers, >130 obs
• T-REX data catalogue, see http://catalog.eol.ucar.edu/trex/

                                                                        Slide 5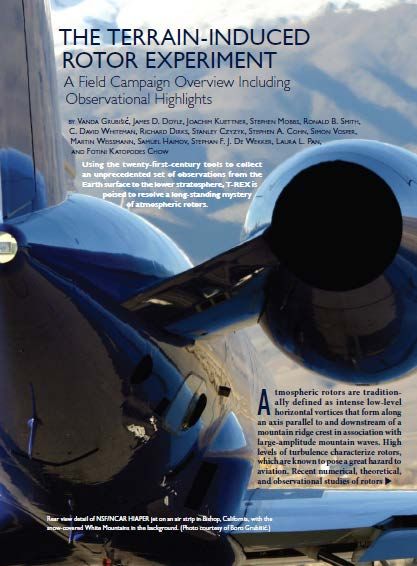
Terrain-Induced Rotor Experiment
              AMS T-REX Special Collection
      (35 papers, BAMS, MWR, JAS, JAMC, JTECH)
Observational, Theory, Modeling, Forecasting, Predictability

                                                          Slide 6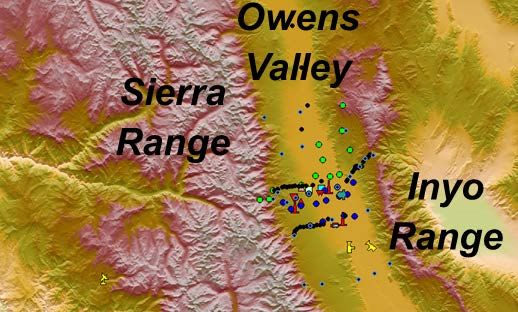
Rotors and Sub-Rotors during T-REX
                       COAMPS Large Eddy Simulation
• Ultra high-resolution simulations of            DLR Doppler Lidar Velocities
  intense subrotor vortices.                        2132 UTC
• Subrotors intensify via vortex stretching.
• Doppler & aerosol lidars, wind profilers,        Sierra
  during T-REX observed similar structures.                                         m s-1

    COAMPS-LES: Subrotor Vortices                  2133 UTC
             ∆x=60 m
       2100 UTC 16 April 2007                                                       m s-1

                                                    2135 UTC

                                                                                    m s-1

                                                                 Doyle et al. (2009) JAS
                                               • Very high-resolution models
                                                 require high-fidelity observations
 η Vorticity (color)
                                               • Models can guide our search for
 η = 0.15 s-1 (red)                              new fine-scale phenomena.
 η = 0.02 s-1 (gray)
                                                                                      Slide 7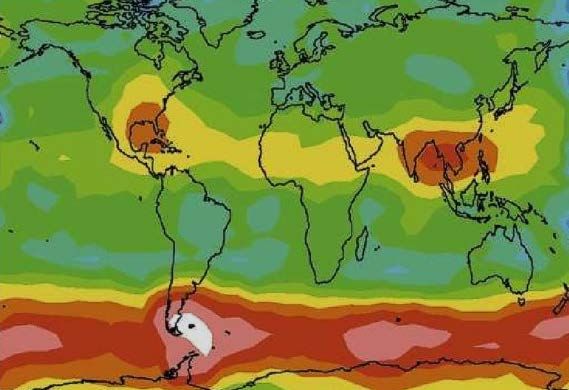
T-REX Model Intercomparison
 Mountain Wave and Thermally-Forced Flows
Mountain Wave Test Cases            Thermally-Forced Flow Test Cases

  Doyle et al. 2011

                                       Schmidli et al. 2011
   Model Simulations are Surprisingly Diverse for T-REX Test Cases.
                                                                      Slide 8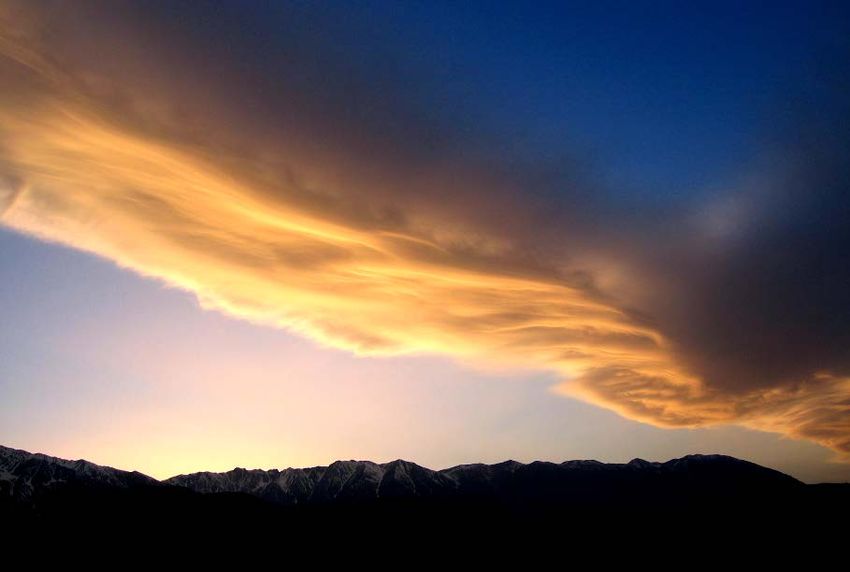
New Dynamical Core
  Nonhydrostatic Unified Model for the Atmosphere (NUMA)
• Spectral Element Dynamical Core:
   • High order accuracy
   • Extremely scalable
   • Mesoscale, Global options (w/ MPI)
   • Semi-implicit solver
   • Incorporation of physics underway
                                                      Clouds (shaded), Rain (contours)
                                                      Accumulation
                                  2D Squall Line
                                w/1000 m resolution
                                   and 10th order
                                    polynomials

   Mountain     Waves
    Density Current
  w/1200
   w/50 mmresolution
             resolution
            th
      and 88th order
     and       order
     polynomials
      polynomials                                     Rainrate

Frank Giraldo (NPS)
Sasa Gabersek (NRL)
                                                                                         9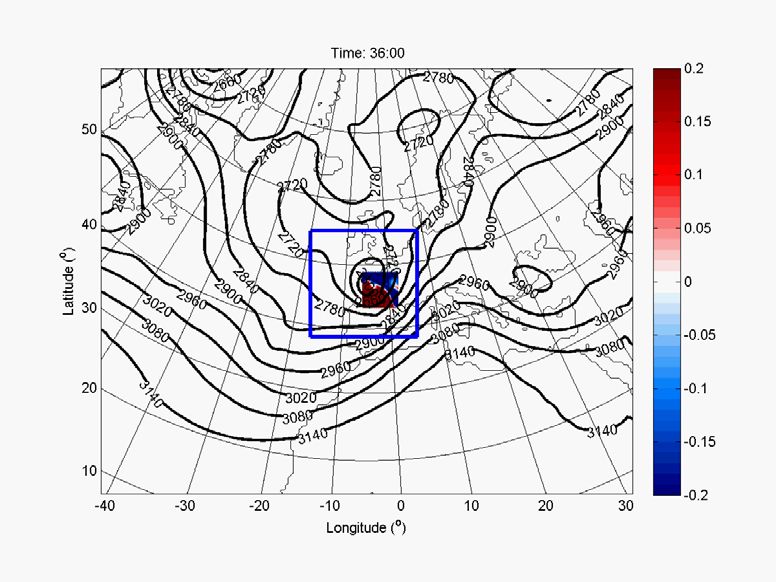
COAMPS Predictability Tools
     Multi-scale Ensemble and Adjoint Capabilities
     Covariance between SLP and             • Nested adjoint modeling system.
       700 hPa Temp (contours)
                                            • Multi-scale sensitivity and observation
       700 hPa RH (fill)
                                              impact capability under development.

                                                 36-h Nested Adjoint Run
                                             Severe European Cyclone Xynthia
                                                       28 Feb 2010
                                              700-mb GHT       ∂KE/∂u (0-36h)

                                                                 15 km
• EnKF-DART capability.                        Nest 1 (45 km)
• 100 member nested ensemble.
• Predictability and data impact studies.
COAMPS Adjoint
Multi-scale Adjoint Summer Example for Dugway
Adjoint 12-h Sensitivity for 00 UTC 1 July 2011
U Sensitivity 850-mb GHT U Evolved Perturbations (12 h) at 300 m
θ Sensitivity
U
300 m
Response Function
KE (lowest 300 m)
5 km
15 km
45 km
Adjoint Optimal Perturbations
5-km Mesh
Initial size ~1 m s-1, after 12 h >5 m s-1
• Sensitivity maxima near the Great Salt Lake (θ sensitivity largest).
• 1 m s-1, 1 K perturbations near lake, grow by 5 times in 12 h.
• Sensitivity is 200 times larger on the fine mesh.
• Winter cass shows greater sensitivity on coarse mesh (stronger flow).
11COAMPS Adjoint
Multi-scale Adjoint Winter Example for Dugway
Adjoint 12-h Sensitivity for 00 UTC 1 Feb 2011
θ Sensitivity 700-mb GHT θ Sensitivity 700-mb GHT, Winds
5 km
15 km
45 km
• Sensitivity (12 h) on the coarse mesh comparable to fine mesh.
• Winter case shows greater sensitivity on coarse mesh (stronger flow).
12COAMPS Observation Impact System
Integration of Data Assimilation and Model Adjoints
COAMPS Impacts 12/24-31 2010
CONUS
Per Observation
Radiosondes Cloud Track
Radiosondes
Cloud Track
EPAC
Radiosondes
Cloud Track
Observations Impact Derived from Data Assimilation and Model Adjoints
13Research Focus
Predictability and Dynamics
• Quantify the predictability limits for terrain-influence mesoscale flows
- terrain can both enhance and degrade predictability
- weak vs. strong forcing (winter vs. summer; winds, fog, clouds)
• Quantify the observation impact for the mesoscale and use this
information for observing network guidance
- quantify conventional and nonconventionial observations impact
as a function of data density (e.g., data spare regions)
• Gain insight into how gravity waves influence mesoscale predictability
• Compare and understand the Torres del Pines
Carlye Calvin, NCAR
strengths and weaknesses of adjoint
and ensemble sensitivity approaches
• Continue to build the NRL
predictability toolbox for COAMPS
• Collaborate with Matterhorn PIs
and incorporate new technology into
the Navy’s COAMPS
14You can also read