NSW Stock Status Summary 2021 - Silver Trevally (Pseudocaranx georgianus) - NSW Stock Status Summary 2021
←
→
Page content transcription
If your browser does not render page correctly, please read the page content below
NSW Stock Status Summary – 2021
Silver Trevally (Pseudocaranx georgianus)

Assessment authors and Year

Fowler, A.M. and Chick, R. C. 2021. Stock assessment report 2020/21 – Ocean Trawl Fishery
– Silver Trevally (Pseudocaranx georgianus). NSW Department of Primary Industries -
Fisheries: .
The current assessment updates a previous assessment on Silver Trevally completed in 2019
(Fowler and Chick, 2020).

Biology and stock structure

Silver Trevally in NSW comprises a single species recently revised as Pseudocaranx
georgianus (previously considered P. dentex; Smith-Vaniz and Jelks 2006, Bearham et al
2019). The species is a medium-bodied bentho-pelagic carnivore inhabiting a broad range of
habitats, from shallow estuaries through to the outer continental shelf. Silver Trevally are
relatively long-lived and slow growing, attaining a maximum age in excess of 25 years
(Rowling and Raines 2000). However, the species is moderately fecund and matures at a
relatively early age (2–4 years).
The stock structure of Silver Trevally is uncertain, with no investigations of potential genetic
structure within NSW. Investigations of population connectivity and post-settlement
movement are also limited. Tag-recapture studies in NSW, Western Australia and New
Zealand indicate restricted post-settlement movement of Silver Trevally despite their fast
swimming ability, potentially leading to ecological stock structuring over moderate (100s of
km) spatial scales (James 1980; Fairclough et al. 2011; Fowler et al. 2018a).
The stock structure of Silver Trevally was reviewed during the 2016 and 2018 Status of
Australian Fish Stocks (SAFS) processes (Chick et al. 2016, Fowler et al 2018b). Due to the
limited information available, and the complex of Pseudocaranx species exploited in some
states, the SAFS stock status reports were conducted at the jurisdictional level.
Acknowledging these constraints, this assessment is also completed at the NSW
jurisdictional level, while considering the stock status determined for the species in the
adjacent state of Victoria and the Commonwealth Trawl Sector (CTS) of the Southern and
Eastern Scalefish and Shark Fishery (SESSF). The CTS was the primary extra-jurisdictional
source of mortality for Silver Trevally until 2018; however, recent catches have declined and
catch from Victoria was greater than that of the CTS during 2019.

Stock Status

The status of the NSW Silver Trevally stock is classified as depleted. The status is based
on:
   1) Declining but variable standardised catch rates in multiple fisheries, areas and time
      periods, particularly during 1998-2009;
   2) Truncation in length structure in the OTF between 1987 and 1999 that has been
      maintained between 2005 and 2020;
   3) B/Bmsy estimates from a catch-only zBRT model at 20% (equivalent to B/B0 at 10%),
      with no improvement when discard estimates were included within catch history;

                                                                       Department of Regional NSW | 1
NSW Stock Status Summary – 2021
Silver Trevally (Pseudocaranx georgianus)
4) B/Bmsy estimates from an OCOM model at or below 30% across a range of stock-
specific natural mortality estimates (equivalent to B/B0 at 15%);
5) High but variable F/M values and low SPR values (1100 t during the early 1980’s,
after which they declined substantially to present day.
Department of Regional NSW | 2NSW Stock Status Summary – 2021
Silver Trevally (Pseudocaranx georgianus)
Figure 1 Annual catch (t) of Silver Trevally from NSW Ocean Trawl, Ocean Trap and Line,
Estuary General, Ocean Hauling and Recreational fisheries from 1998 to 2020.
Recreational and Indigenous cultural catch
Three surveys of recreational fishing have been conducted at the state-wide level in NSW.
Retained landings by recreational fishers resident in NSW have decreased, with landings
estimated from off-site telephone/diary surveys declining from approximately 140,000 fish
during 2000/01 to around 49,000 individuals during 2013/14 (Henry and Lyle 2003, West et
al. 2015) and around 15,000 fish in 2017/18 (Murphy et al. 2020). This corresponds to a
decrease in retained catch weight from approximately 100 t during 2000/01 to around 27 t
during 2013/14 and 8 t in 2017/18 (Figure 1), based on average body weight for the species
(NSW DPI, unpublished). Over half of the retained landings in NSW during 2000/01 were
taken by anglers from other states, with an estimated catch of over 250,000 fish when non-
NSW anglers were included (Henry and Lyle 2003). An estimate of catch by non-NSW
anglers was not available for 2013/14 (West et al. 2015) or 2017/18 (Murphy et al. 2020).
The 2017/18 NSW survey sampled individual one- and three-year licence holders present in
the NSW Recreational Fishing Fee (RFF) Licence database, whereas the previous NSW
survey sampled households from the White Pages (West et al. 2015).
Indigenous catches are unknown.
Illegal, Unregulated, Unreported (IUU) catch
The level of Illegal Unregulated and Unreported (IUU) fishing has not been quantified.
Effort information
Fishing effort (days) in the OTF was relatively high but variable during 1998-2007, then
declined rapidly until 2010. Effort has subsequently remained low, with a gradual decline to
265 days in 2020. The trend in number of days fished between 2010 and 2020, derived from
summing the number of fishing events recorded within a month, was similar to the trend in
Department of Regional NSW | 3NSW Stock Status Summary – 2021
Silver Trevally (Pseudocaranx georgianus)
hours fished. Hours fished is the required reporting metric on catch returns following changes
implemented in 2009.
Catch rate information
Commercial
Catch rates (kg.day-1) were standardised using general linear models in the R package
‘cede’. Variables used included month of capture, ocean zone, depth (from 2010 onward),
fishing business (as a proxy for ‘vessel’ in the trawl fishery) and authorised fisher (as a proxy
for ‘vessel’ in the trap fishery). Substantial discarding has been observed within the OTF
following the introduction of the MLL in 2007 (NSW DPI, unpublished). To examine the
potential effect of discarding on trends in catch rates, discard estimates were added to catch
data from 2008 onward and catch rates were re-standardised.
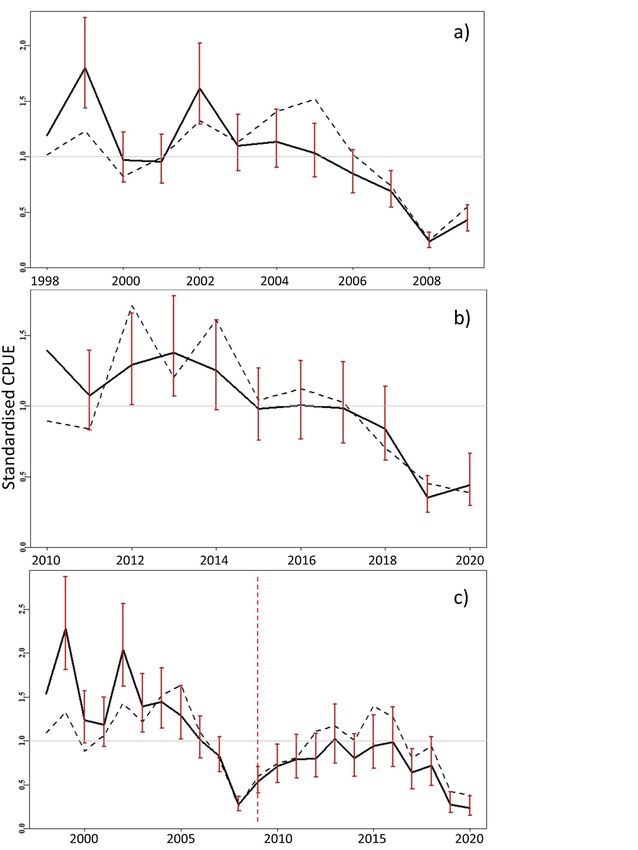
Trends in catch rates of Silver Trevally in the OTF varied between time periods and areas
examined. When data for all ocean zones were combined, catch rates declined during both
the 1998-2009 and 2010-2020 periods (Figure 2). Catch rates across the entire period also
showed the initial decline (1998-2009), but then increased after 2008 and remained relatively
stable between 2011 and 2016. Catch rates then declined again, and in 2020 were at the
lowest level recorded (Figure 2). The addition of discard estimates to catch after 2007 had
little effect on the declining catch rates observed during 1998-2009. However, the recovery of
catch rates observed after 2008 increased substantially and consistently across the range of
discard additions explored. Despite this increase, catch rates during 2019 and 2020
remained low.
Declining catch rates in the OTF during 1998-2009 were also observed in the OTLF.
Substantial declines occurred between 2000 and 2005 when all zones were combined, and
in Ocean Zone 5 separately.
Department of Regional NSW | 4NSW Stock Status Summary – 2021
Silver Trevally (Pseudocaranx georgianus)
Figure 2 OTF – All ocean zones – Standardised catch rate (solid line) of Silver Trevally by
trawling within all ocean zones during: a) 1998 - 2009, b) 2010 - 2020 and c) 1998 -
2020. Units for Panels a and c are kg.day-1, whereas the unit for Panel b is kg.h-1. The
dashed black line indicates the geometric mean catch rate. Red bars indicate 95%
confidence intervals. The dashed red line indicates the reporting discontinuity.
Department of Regional NSW | 5NSW Stock Status Summary – 2021
Silver Trevally (Pseudocaranx georgianus)
Length structure
Length data for Silver Trevally from the OTF have been investigated in numerous studies
between 1987 and 2015/16, including observer-based investigations and fish market
sampling of commercial catches. Truncation of larger size-classes was observed in trawl
catches made between 1987 and 1999 (Liggins 1996; Rowling and Raines 2000). Size
truncation has been maintained since that period, with individuals larger than 30 cm fork
length comprising a small proportion of trawl catches prior to the introduction of the 30 cm
MLL following 2007, and commonly steep declines in size structure thereafter, with median
values within 1-2 cm of the fork length equivalent to the MLL, according to monitoring of
landed catches during fish market sampling.
Catch-only and length-based assessment modelling
Two catch-only models were applied to the historical catch data available from the OTF
(1955-2020); a boosted regression tree (zBRT) model (Zhou et al. 2017a) and an Optimised
Catch-Only Model (OCOM, Zhou et al. 2017b). Estimates of biomass relative to biomass at
maximum sustainable yield (B/Bmsy) from zBRT decreased throughout the period, with a
substantial decline in 2016 to low levels that have not appreciably improved. The B/Bmsy
estimate for 2020 was 20% (equivalent to B/B0 at 10%).
B/Bmsy estimates from OCOM remained stable and above 1.5 between 1955 and the mid-
1970s, then decreased substantially during the 1980s and 1990s, remaining low (≤0.3) and
stable from 2000 to 2020. Fishing mortality relative to fishing mortality at maximum
sustainable yield (F/Fmsy) remained below 1 until the early 1980s, after which they increased
substantially and remained above 1 until the late 2010s. Trends were similar across the
range of natural mortality values examined (0.05-0.15).
To provide a complimentary assessment that does not rely on commercial catch data, a
Length Based – Spawning Potential Ratio (LB-SPR) was applied to commercial length data
sampled from fish markets during 11 years between 2005 and 2020 (Hordyk et al. 2015).
Estimated fishing mortality relative to natural mortality (F/M) was highly variable throughout
the period (range: 2.0 to 8.4), with values in the last three years ranging between 2.9 and
4.9. The spawning potential ratio (SPR) was consistently low and stable across years,
ranging between 0.10 and 0.18.
Stock assessment - list of indicators
Most recent assessment 2020 – depleted
Assessment method Weight of evidence:
- Standardised catch rates (OTF and OTLF)
- Length frequency time-series (OTF)
- Boosted Regression Tree (zBRT) catch-only model
- Optimised Catch Only Model (OCOM)
- LB-SPR model
Department of Regional NSW | 6NSW Stock Status Summary – 2021
Silver Trevally (Pseudocaranx georgianus)
Main data inputs Commercial catch (t) – 1955 to 2020
Commercial effort (days) – 1998 to 2020
Length data (fork length, cm) – 11 years between 2005 and
2011. Taken from fish markets across trawling, trapping and
line methods.
Key model structure and Standardised CPUE: Commercial catch per unit effort
assumptions (CPUE) standardised using a glm including variables of
month of capture, ocean zone, depth (from 2010 onward),
fishing business (as a proxy for ‘vessel’ in the trawl fishery)
and authorised fisher (as a proxy for ‘vessel’ in the trap
fishery).
zBRT: Estimates saturation (i.e. 1- depletion = 0.05*B/BMSY)
from 56 catch history statistics, including linear regression
coefficients, the subseries before and after the maximum
catch, and recent years. Saturation is estimated as the
average of the saturation values predicted by two reduced
and bias-corrected BRT models (8 and 38 predictors each;
Zhou et al. 2017a).
OCOM: Stock reduction analysis (SRA) with priors for
recruitment and stock depletion derived from natural mortality
(0.05-0.15, Rowling and Raines 2000) and saturation from
the zBRT model. The SRA uses a Schaefer biomass
dynamics model and an algorithm for identifying feasible
parameter combinations to estimate a range of biological and
relevant quantitative metrics including unfished biomass,
depletion and exploitation rates (Zhou et al. 2017b).
Catch-only models inherently assume that changes in catch
reflect changes in stock biomass.
LB-SPR: Uses size structure and SPR in harvested
populations, being a function of relative fishing pressure (F/M)
and life history ratios. A maximum likelihood approach is used
to estimate selectivity, F/M and SPR, with a smoother
function used to reduce noise in multi-year estimates (Hordyk
et al. 2015).
Sources of uncertainty The effect of discarding on catch rate trends and zBRT
evaluated estimates was evaluated through sensitivity analyses across
a range of discarding rates taken from a NSW DPI onboard
observer program in the trawl fishery during 2015/16.
Uncertainty in natural mortality estimates was evaluated
using sensitivity analyses across the range of natural
Department of Regional NSW | 7NSW Stock Status Summary – 2021
Silver Trevally (Pseudocaranx georgianus)
mortality values previously estimated for the NSW Silver
Trevally stock (Rowling and Raines 2000).
Uncertainty in catch-only model estimates relating to the use
of trawl catch, rather than total catch, was evaluated through
model application to an additional dataset including catch
across all fisheries and methods in NSW.
Status indicators and limits – reference levels
Biomass indicator or proxy Standardised CPUE, B/Bmsy, SPR
Biomass limit reference NA – no biomass limits or targets have been set
level
Fishing mortality indicator F/Fmsy, F/M
or proxy
Fishing mortality limit NA – no fishing mortality limit has been set
reference level
Target reference level NA – no fishing mortality targets have been set
Stock assessment results – review of indicators
Biomass status in relation NA – no biomass limits or targets have been set
to limit
Fishing mortality in NA – no fishing mortality limit has been set
relation to limit
Previous SAFS stock SAFS 2016 (NSW) – Transitional-depleting
status
Current SAFS stock SAFS 2018 (NSW) - Depleting
status
Fishery interactions
Silver Trevally are fished in the Commonwealth Trawl Sector (CTS) of the Southern and
Eastern Scalefish and Shark Fishery (SESSF) as well as Victorian fisheries.
Department of Regional NSW | 8NSW Stock Status Summary – 2021
Silver Trevally (Pseudocaranx georgianus)
Qualifying comments
NSW catch and effort logbook data vary spatially and temporally across different eras,
delineated by changes in fisher reporting requirements and other management changes. The
change in the method of effort reporting during 2009/10 limits the certainty with which
conclusions can be made regarding shifts in effort and catch rates around that time. The
establishment of the Batemans Bay Marine Park may also have affected trends in fishery
metrics, potentially reducing catches and catch rates following 2007, however these are likely
to be restricted to that area of the coast. Lastly, the introduction of the MLL likely reduced
landings across the state after 2007.
Results from data-limited assessment methods must be interpreted with caution, given the
limited information used to model population parameters and stock status. Catch-only
models inherently assume that changes in catch reflect changes in stock biomass, yet catch
is also influenced by a number of other factors including fishery operations.
Factors other than fishing, including climate change and other environmental processes, may
affect changes in the abundance and biological functioning of the NSW Silver Trevally stock
through time. Temporal and spatial variations in oceanographic conditions, including
temperature change, may influence available trophic resources, growth, population
connectivity and ultimately recruitment.
References
Bearham, D., Robert, M., Chaplin, J. A., Moore, G. I., Fairclough, D. V., and Bertram, A.
2019. Molecular evidence of three species in the Pseudocaranx dentex complex
(Carangidae) in Australian waters. Marine and Freshwater Research.
doi.org/10.1071/MF18445
Chick, R. Roelofs, A., Green, C., Fairclough, D., Stewart, J., Georgeson, L., and Emery, T.
2016. Silver Trevally Pseudocaranx georgianus, Pseudocaranx sp. "dentex" and
Pseudocaranx wrighti. In: Stewardson, C., Andrews, J., Ashby, C., Haddon, M.,
Hartmann, K., Hone, P., Horvat, P., Mayfield, S., Roelofs, A., Sainsbury, K.,
Saunders, T., Stewart, J., Stobutzki I. and B. Wise, Eds. Status of Australian fish
stocks reports 2016. Fisheries Research and Development Corporation, Canberra.
Fairclough, D. V., Potter, I. C., Lek, E., Bivoltsis, A. K. and Babcock, R. C. 2011. The fish
communities and main fish populations of the Jurien Bay Marine Park. Strategic
Research Fund for the Marine Environment Final Report. Centre for Fish and
Fisheries Research, Murdoch University, Murdoch, Western Australia.
Fowler, A.M. and Chick, R. C. 2020. Stock assessment report 2019 – Ocean Trawl Fishery -
Silver Trevally (Pseudocaranx georgianus). NSW Department of Primary Industries –
Fisheries, 46 p.
Fowler, A. M., Chick, R. C. and Stewart, J. 2018a. Patterns and drivers of movement for a
coastal benthopelagic fish, Pseudocaranx georgianus, on Australia’s southeast coast.
Scientific Reports, 8: 16738.
Fowler, A., Chick, R. Moore, B., Fairclough, D., Womersley, B., Georgeson, L., Albury, L. and
Rogers, P. 2018b. Silver Trevally Pseudocaranx georgianus, Pseudocaranx sp.
"dentex" and Pseudocaranx wrighti. In: Stewardson, C., Andrews, J., Ashby, C.,
Haddon, M., Hartmann, K., Hone, P., Horvat, P., Mayfield, S., Roelofs, A., Sainsbury,
Department of Regional NSW | 9NSW Stock Status Summary – 2021
Silver Trevally (Pseudocaranx georgianus)
K., Saunders, T., Stewart, J., Nicol, S. and Wise, B. (eds). Status of Australian fish
stocks reports 2018. Fisheries Research and Development Corporation, Canberra.
Henry, G. W. and Lyle, J. M. 2003. The national recreational and Indigenous fishing survey.
Fisheries Research and Development Corporation, Canberra.
Hordyk, A., Ono, K., Valencia, S., Loneragan, N., and Prince, J. 2015. A novel length-based
empirical estimation method of spawning potential ratio (SPR), and tests of its
performance, for small-scale, data-poor fisheries. ICES Journal of Marine Science,
72: 217-231.
James, G. D. 1980. Tagging experiments on trawl-caught trevally, Caranx georgianus, off
north-east New Zealand, 1973–79. New Zealand Journal of Marine and Freshwater
Research 14: 249-254.
Liggins, G. W. 1996. The interaction between fish trawling (in NSW) and other commercial
and recreational fisheries. Final Report, FRDC Project No. 92/79. NSW Fisheries
Research Institute, Cronulla.
Murphy, J. J., Ochwada-Doyle, F. A., West, L. D., Stark, K. E. and Hughes, J. M. 2020. The
NSW Recreational Fisheries Monitoring Program - survey of recreational fishing,
2017/18. NSW DPI - Fisheries Final Report Series No. 158.
Pease, B.C. and Grinberg, A. 1995. New South Wales Commercial Fisheries Statistics, 1940
to 1992. NSW Fisheries Research Institute, Cronulla.
Rowling, K. R. and Raines, L. P. 2000. Description of the biology and an assessment of the
fishery for silver trevally Pseudocaranx dentex off New South Wales. NSW Fisheries
Final Report Series No. 24. NSW DPI Fisheries, Cronulla.
Rowling, K. R. 2006. Silver Trevally – Estimating catches by fishing method for NSW historic
data. NSW DPI Fisheries, Cronulla.
Smith-Vaniz, W. F. and Jelks, H. L. 2006. Australian trevallies of the genus Pseudocaranx
(Teleostei: Carangidae), with description of a new species from Western Australia.
Memoirs of the Museum of Victoria 63: 97-106.
West, L. D., Stark, K. E., Murphy, J. J., Lyle, J. M. and Ochwada-Doyle, F. A. 2015. Survey
of recreational fishing in New South Wales and the ACT, 2013/14. Fisheries Final
Report Series No. 149. NSW Department of Primary Industries, Wollongong.
Zhou, S., Punt, A.E., Ye, Y., Ellis, N., Dichmont, C.M., Haddon, M., Smith, D.C. and Smith,
A.D. 2017a. Estimating stock depletion level from patterns of catch history. Fish and
Fisheries 187: 42-751.
Zhou, S., Punt, A.E., Smith, A.D., Ye, Y., Haddon, M., Dichmont, C.M. and Smith, D.C.,
2017b. An optimized catch-only assessment method for data poor fisheries. ICES
Journal of Marine Science 75: 964-976.
Department of Regional NSW | 10You can also read