NUMERICAL AND EXPERIMENTAL STUDY ON MECHANICAL BEHAVIOUR OF THE ALSI10MG ALUMINIUM STRUCTURES MANUFACTURED ADDITIVELY AND SUBJECTED TO A BLAST ...
←
→
Page content transcription
If your browser does not render page correctly, please read the page content below
EPJ Web of Conferences 250, 02017 (2021) https://doi.org/10.1051/epjconf/202125002017
DYMAT 2021

 NUMERICAL AND EXPERIMENTAL STUDY ON
 MECHANICAL BEHAVIOUR OF THE AlSi10Mg
 ALUMINIUM STRUCTURES MANUFACTURED
 ADDITIVELY AND SUBJECTED TO A BLAST
 WAVE
 M. Stanczak 1*,3, T. Fras 1, L. Blanc 1, P. Pawlowski 2, and A. Rusinek 3

 1 Department of Protection Technologies, Security & Situational Awareness, French-German Research
 Institute of Saint-Louis (ISL), 68301 Saint-Louis, France
 2 Institute of Fundamental Technological Research Polish Academy of Sciences, Polish Academy of

 Sciences (PAS) 02-106 Warsaw, Poland
 3 Laboratory of Microstructure Studies and Mechanics of Materials, LEM3 Laboratory, Lorraine

 University, 57070 Metz, France

 Abstract. The paper is related to energy absorptive properties of additively
 manufactured metallic cellular structures. The samples of Honeycomb,
 Auxetic, rhomboidal Lattice and a regular Foam are subjected to a dynamic
 compression due to the blast tests. The cuboidal samples are manufactured
 by the Direct Metal Laser Sintering (DMLS) method using AlSi10Mg
 aluminium powder. The experimental tests are performed by means of an
 Explosive Driven Shock Tube (EDST). The measured results of the
 transmitted forces in relation to the shortening of the samples allow to
 analyse the deformation processes of each selected geometry. In addition,
 the evaluation of the structural responses leads to identification of the
 structure properties, such as the equivalent stress over equivalent strain or
 the energy absorption per a unit of mass. Moreover, the process of
 compression is modelled numerically using the explicit code LS-DYNA
 R9.0.1. The obtained simulations provide the complete analysis of the
 experimentally observed mechanisms.

 1 Introduction
 Nowadays, numerous research studies focus on improvements of protection systems against
 impacts or explosions, e.g. [1-5]. Modern and advanced techniques of manufacturing, like an
 additive manufacturing (AM) may be used to produce structures with optimized geometrical
 properties. The AM methods provide a freedom in designing geometry or defining density of
 manufactured samples. Thanks to additive manufacturing, spare parts adaptable to already
 existing components may be fast and efficiently produced. However, the behaviour of
 structures produced due to the AM technique is complex and it still requires investigations.
 A particular attention should be focused on the behaviour of AM structures affected by an

 *Magda.STANCZAK@isl.eu

© The Authors, published by EDP Sciences. This is an open access article distributed under the terms of the Creative Commons
Attribution License 4.0 (http://creativecommons.org/licenses/by/4.0/).
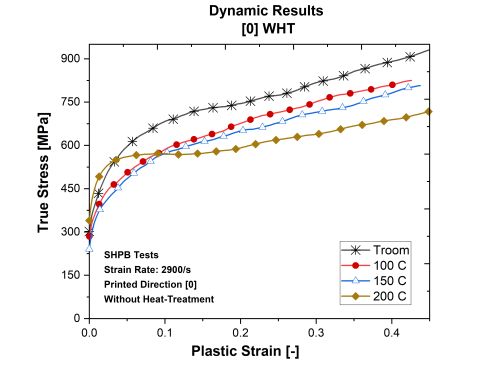
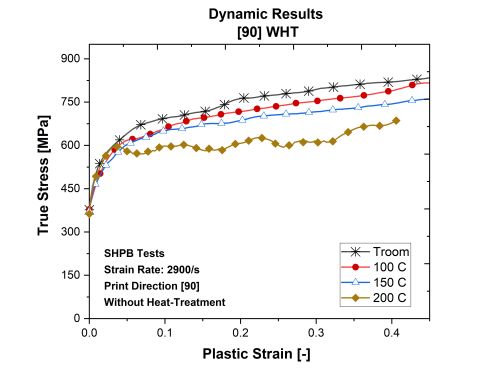
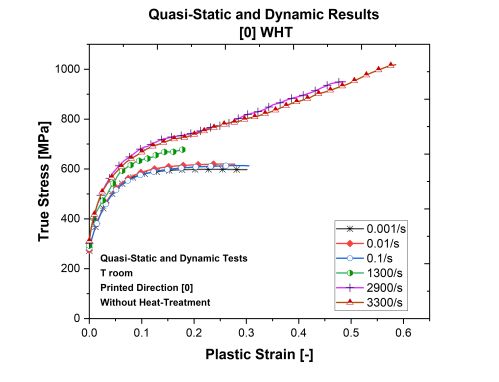
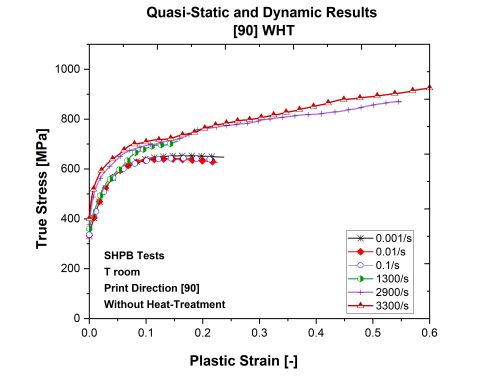
EPJ Web of Conferences 250, 02017 (2021) https://doi.org/10.1051/epjconf/202125002017
DYMAT 2021

 explosion. So far, only several works refer to dynamic responses of AM samples in blast
 conditions [6-7].
 In consequence, the hereby discussed experimental tests, performed by means of the
 Explosive Drive Shock Tube (EDST) test stand, concern four different AM structures under
 an influence of an explosive wave. To compare the absorptive properties, two structures
 consisting of 2D unit cells (Honeycomb and Auxetic) and two others characterized by a 3D
 geometry (rhomboidal Lattice and regular Foam) are selected. The studies are based on the
 printed cubic samples without any additional post-treatment, often called ‘as built’ [8]. An
 analysis of the deformation and damaged processes is realized due to explicit simulations in
 LS-DYNA R9.0.1.

 2 Material characteristics and manufacturing process
 The tested aluminium AlSi10Mg samples are additively manufactured by the Direct Metal
 Laser Sintering (DMLS) method applied in the EOSINT M 280 3D printer. The DMLS is
 based on the selective sintering of an evenly distributed powder on the build platform. The
 30 µm powder layer is melted according to a bidirectional scanning strategy at an angle of
 67° by a 370 W laser beam. The printing technique contributes to the formation of a fine
 microstructure during the solidification process and unification the macro properties [9]. The
 settings during manufacturing, a type of the powder, as well as the sample position in relation
 to the build platform or the final treatment may significantly affect the properties of the
 obtained product [10].
 In order to determine the material characteristics of AlSi10Mg aluminium, the quasi-static
 and dynamic compression tests has been carried out. The performed tests are based on the
 samples printed horizontally and vertically with respect to the build platform. Figure 1 shows
 the obtained results of the true stress over the plastic strain. The tests are performed at the
 strain rate between 0.001/s – 3300/s and at the temperature range of 293 K – 473 K. An
 adiabatic-isothermal correction of the registered stress-strain material curves is introduced to
 the results at high strain rates, according to [11].
 The results indicate that the print direction affect the material response. The vertically
 printed samples exhibit the highest values of the stress in the first deformation stage (up to
 0.25 strain). However, the horizontally printed samples exhibit highest hardening in second
 regime. It is observed that the AlSi10Mg aluminium is only slightly sensitive to the strain
 rate changes, however the temperature increase causes a stronger material softening.

 Table 1. The tested structures and their geometrical properties.
 Honeycomb Auxetic Lattice Foam

 [ ] 813.87 879.91 896.34 900.96
 [ ] 30.01 29.98 30.06 30.01
 [ ] 12.13 11.31 18.19 11.84
 [−] 0.173 0.151 0.250 0.164

 The objective of the study is a comparison of the absorptive properties of four different
 geometries: Honeycomb, Auxetic, Lattice and regular Foam (Table 1). The Honeycomb and
 Auxetic represent the structures with 2D unit cells and Lattice and Regular Foam are

 2

EPJ Web of Conferences 250, 02017 (2021) https://doi.org/10.1051/epjconf/202125002017
DYMAT 2021

 characterized by three-dimensional (3D) geometries. The tests were based on the ‘as built’
 cubic samples with the edge length of 30 mm. The samples are characterized by a similar
 relative density equalled 0.2 ±0.05.

 a) b)

 c) d)
 Fig. 1. The experimental material test results describing the horizontally and vertically printed samples
 at different strain rates (a, b) and at different temperatures (c, d).

 3 Experimental set-up
 The manufactured samples are subjected to blast loadings using an Explosive Driven Shock
 Tube (EDST), presented in Figure 2a-b. This experimental set-up consists of the 1.75 m long
 shock tube, in front of which 30 g of the C-4 explosive charge is located. An explosion
 generates a spherical wave which travels through the tube. Due to internal reflections and the
 travelled distance, the blast wave forms a planar front at the end of the tube. The final blast
 loadings applied to the front plate depends on the mass of the charge and the length of the
 tube. Their measured profiles are presented in Figure 2c [12].
 The movement of the front steel plate accelerated by the explosive wave causes a
 compression of the tested samples. During the damage process, the force transmitted to the
 back plate is measured by a PCE 206C piezoelectric force sensor, Figure 2b. In addition, a
 high-speed camera Phantom V311 records the whole deformation process. Then, the Digital
 Image Correlation (DIC) allows to obtain the displacement of the front plate over the time.
 The correlation of the force and the displacement enables to calculate the stress (t ) over
 the strain (t ) for each sample according to the Equations 1 and 2.

 3
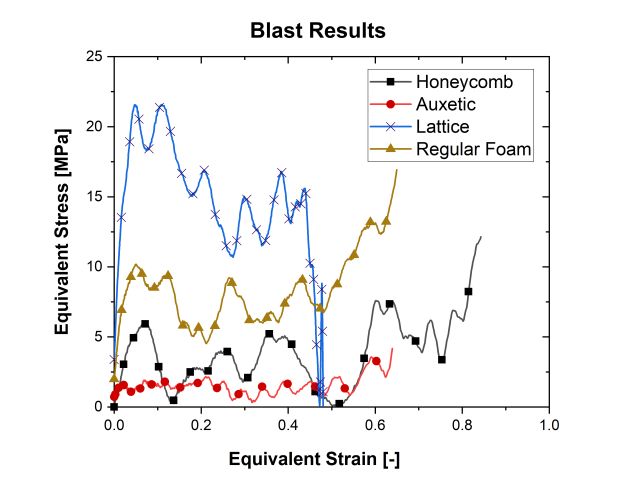
EPJ Web of Conferences 250, 02017 (2021) https://doi.org/10.1051/epjconf/202125002017
DYMAT 2021

 Ftrans (t)
 (t ) = (1)
 Aref
 x(t)
 (t ) = (2)
 L0

 where: Ftrans (t) – total force transmitted to the back plate, Aref – reference cross-section area
 of the sample, x(t) – displacement of the front plate, L0 – initial height of the sample.

 Fig. 2. The test stand of the Explosive Driven Shock Tube: a) side view, b) schema of the EDST, c)
 initial impulse profiles of the load dependent on the used charges.

 4 Results
 Typically, the response of a compressed metallic cellular structures may be described by
 three main phases [13-14], which is also observed for the tested structures. The elastic
 response of cellular structures ends with a first stress peak. This is often the maximum
 obtained value before the total damage of the sample. Then the deformation follows a plateau
 regime, in which the registered force oscillates around a certain value. In this region, the
 structure undergoes the plastic deformation such as bending or stretching. Finally, a sudden
 sharp rise in the obtained stress corresponds to a fully damaged structure.
 Figure 3 presents the summary of the obtained results of the stress over the strain for
 Honeycomb, Auxetic, Lattice and Foam. It can be seen that each sample is characterized by
 the peak stress and plateau regime. However, Lattice does not exhibit the densification phase.
 It means that the sample absorbs the whole generated load before its full damage. The Foam
 structure is also characterized by a high value of the transmitted force, which results in the
 plateau stress of 7.8 MPa. The structures composed with the 2D unit cells turn out to be the
 least efficient, wherein the plateau stress of Auxetic (equal to 1.44 MPa) is more than two
 times lower than that of the Honeycomb structure (3.37 MPa).

 4
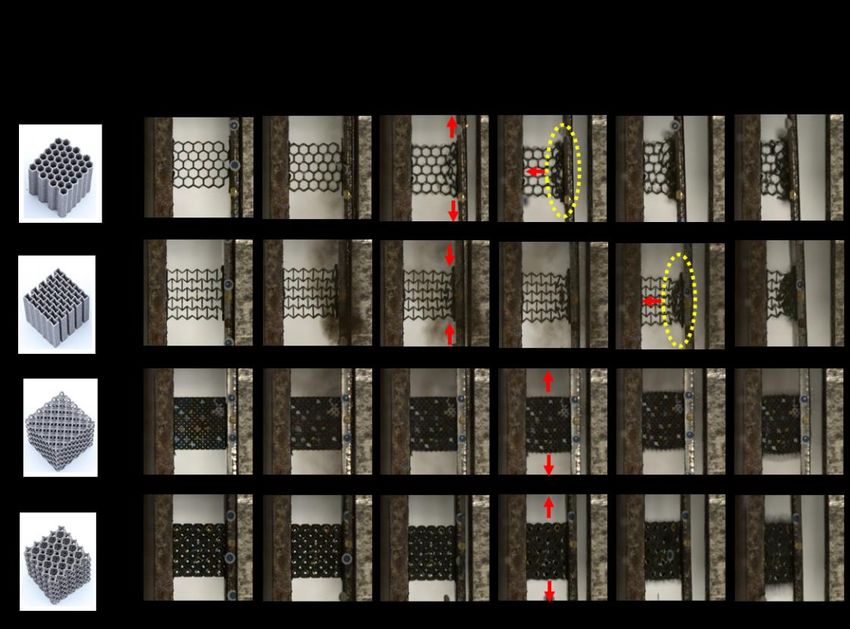
EPJ Web of Conferences 250, 02017 (2021) https://doi.org/10.1051/epjconf/202125002017
DYMAT 2021

 Fig. 3. The experimental blast results for the tested structures of Honeycomb, Auxetic, Lattice and
 Foam, performed by means of the EDST with 30g of the C4 explosive charge.

 The results are correlated with the damage process registered by a high-speed camera
 (Figure 4). It can be seen that Honeycomb and Auxetic exhibit a progressive, brittle-type
 damage as the cells collapse row-by-row. Wherein, the Honeycomb’s cells deform in an
 outward direction, enlarging the observed surface transversely to the applied load. The cells
 of Auxetic collapse to the middle of the structure. The observed process proved the typical
 behaviour of the structures with a negative Poisson ratio. The Lattice and Foam exhibit strong
 elastic - plastic deformations. Both structures expand in the direction perpendicular to the
 applied load, along with the height reduction.

 Fig. 4. The subsequent frames recorded by a high-speed camera during the performed blast tests.

 5
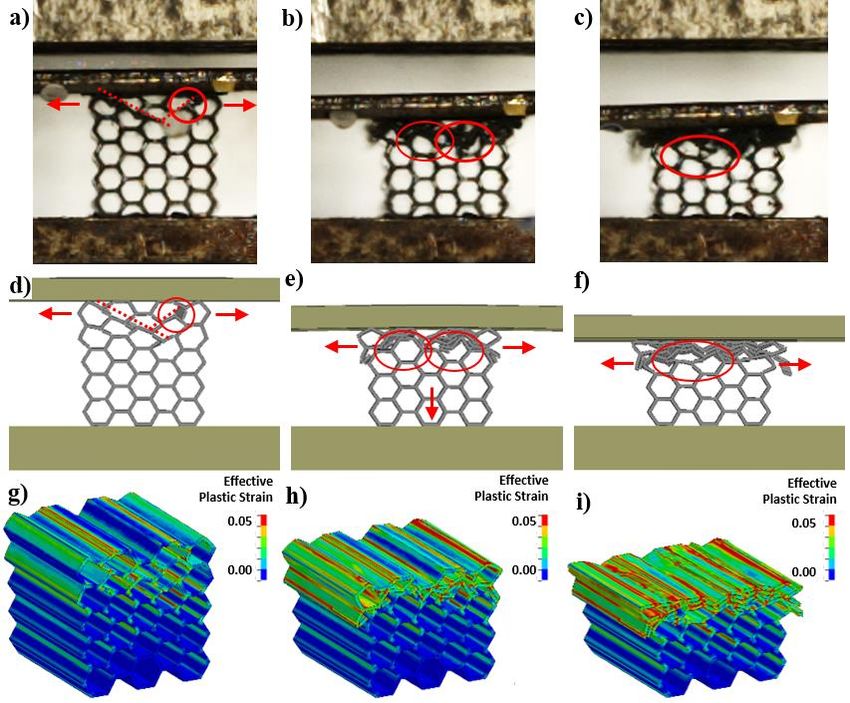
EPJ Web of Conferences 250, 02017 (2021) https://doi.org/10.1051/epjconf/202125002017
DYMAT 2021

 5 Numerical approach

 In order to analyse the damage process in details, the explicit simulation in the LS-DYNA
 R9.0.1 is developed. The experimental set up is prepared in Ls-PrePost and consists of the
 Lagrange solid parts of the tested sample, placed between two steel plates. The contact
 between the components is obtained by the function
 *AUTOMATIC_SURFACE_TO_SURFACE. The crushing load is assigned to the nodes of
 the upper surface of the front plate.
 The in-house obtained characteristics of the AlSi10Mg aluminium alloy are used to
 describe the material properties of the tested structure (see Section 2). To introduce the
 experimental curves, the *MAT_Linear_Pleasticity 024 is chosen to simulate the material
 behaviour of structures. The *MAT_Simplified_Johnson_Cook 098 is used to describe the
 material behaviour of the steel blocks. *Mat_098 is a simplified Johnson-Cook constitutive
 function which does not account for temperature effects and is decoupled from the Johnson-
 Cook fracture model [16]. A maximum effective strain at failure of 0.1 is used to simulate a
 brittle damage. The bottom surface of the second block is fully constrained, simulating the
 experimental bunker wall. A more exact description of the numerical configuration is
 presented in [12,16].

 Fig. 5. The comparison of the blast experiment of the Honeycomb structure (a,b,c) with its numerical
 simulation: front view (d,e,f) and the isometric view presented in maps of the effective plastic strain
 (g,h,i).

 6
EPJ Web of Conferences 250, 02017 (2021) https://doi.org/10.1051/epjconf/202125002017
DYMAT 2021

 Figure 5 presents the comparison between the blast test results for the Honeycomb
 structure alongside with the developed simulation. Figures 5d-f show a progressive damage
 of cells (row-by-row) that is also observed during the experimental test. The cells bend and
 stretch outwards the structure. The simulation allows to indicate the most strained and
 damaged walls of the structure, which may be difficult to observe during the test. The
 deformation explains the differences in the strained cells mod at the same row level (the red
 circles at Figures 5b-e).
 In addition, Figures 5 g-i indicate the areas which undergo the strongest strain during the
 compression. In the undeformed zones, the geometry may be optimized without affecting the
 response of the structure.

 6 Discussion
 The results from the performed quasi-static and dynamic tests are referred to the mass of each
 sample. The specific energy absorption (SEA) is determined according to the Equation 3.

 ∫0 ( )
 = = (3)

 where: EA – absorbed energy, m – mass of the sample, F(x) – registered force and x – change
 in height of the sample.

 a) b)
 Fig. 6. a) Absorbed energy and b) specific energy absorption of each sample.

 The resulted absorbed energy (Figure 6a) is in line with the trend shown in the stress-
 strain diagram (Figure 3). The Lattice structure absorbs most energy during the performed
 explosive test. The Foam, in contrast to the Auxetic structure ( ≈ 21 ), is proven also to
 have a high absorptive properties ( ≈ 133 ). However, when the mass of structures is
 taken into account, both samples with 3D unit cells exhibit similar values of the SEA (close
 to 11 kJ/kg), which are higher than the characteristics of the 2D-cells structures Figure 6b. It
 is worth noticing that although the SEA parameter is similar for Lattice and Foam, the
 differences between the EA parameters are more distinct. The Lattice structure has the
 highest EA parameter but the conducted tests do not allow for a precise comparison of the
 absorption properties, as Lattice has not reached the densification phase. The analysis shows
 also that the auxetic properties of the negative Poisson ratio possessed by the Auxcetic do
 not result in its improved performance in application to blast mitigation. The SEA parameter
 of the tested Auxetic is 2 to 5 times smaller when compared to Honeycomb or to the structures
 with 3D unit cells, respectively.

 7
EPJ Web of Conferences 250, 02017 (2021) https://doi.org/10.1051/epjconf/202125002017
DYMAT 2021

 7 Conclusion
 The conducted blast compression tests of the additively manufactured samples resulted in a
 comparison of the dynamic behaviour of four geometries of Honeycomb, Auxetic, Lattice
 and Foam. The analysis of the mechanical deformations shows that the structures composed
 with the 3D unit cell absorb more energy during the blast loading carried out by means of the
 EDST set-up. Based on the calculated energy absorption characteristics, it may be concluded
 that despite that these samples are characterized by a higher mass, they mitigate more
 efficiently an explosive load than the structures with 2D unit cells.
 The developed simulation, built on the example of Honeycomb analyses the deformation
 mechanism observed experimentally. The numerical results indicate non-strained areas
 which removal should not change the mechanism of the blast energy absorption but which
 may improve the SEA parameter. The conducted research provides a good basis for an
 analysis and a further geometry optimization of structures applied to attenuate explosive
 waves.

 References
 1. L. Blanc, M.-O. Sturtzer, T. Schunck, D. Eckenfels, J.-F. Legendre, Blast wave
 mitigation using multi-phase solid material in a sandwich cladding, in Proceedings of
 the 25th Military Aspects of Blast and Shock, The Hague, NL, September 2018
 2. A.S.M. AymanAshab, D. Ruan, G. Lu, A.A. Bhuiyan, Mater. 9, 162 (2016)
 3. M. Yamashita, M. Gotoh, Int. J. Imp. Eng. 32, 618-630 (2005)
 4. T. Fras Spr. Sci. B. Med., LLC 69, 1-30 (2020)
 5. T. Fras, L. Colard, P. Pawlowski, Int. J. Multiphys. 9, 267-285 (2015)
 6. S. McKown, Y. Shen, W.K. Brookes, C.J.Sutcliffe, W.J. Cantwell, G.S. Langdon, G.N.
 Nutrick, M.D. Theobald, Int. J. Imp. Eng 35, 795-810 (2008)
 7. B. Branch, A. Ionita, B.E. Clements, D.S. Montgomery, B.J. Jensen, B. Patterson, A.
 Schmalzer, A. Mueller, D.M. Dattelbauma J. Appl. Phys. 121, 135102-1-125102-9
 (2017)
 8. EOS GmbH - Electro Optical Systems, AD, 1-4 (2010)
 9. M. Moataz, L. N. C. Attallah, Q. Chunlei, R. Noriko, W. Wei, CRC Press, Taylor &
 Francis 3, 59-110 (2018)
 10. Z.H. Xionga, S.L. Liub, S.F. Lia, Y. Shic, Y.F. Yanga, R.D.K. Misrad, Mater. Sci.
 Eng. 156, 148–156 (2019)
 11. J.R. Klepaczko, A. Rusinek, J.A. Rodríguez-Martínez, R.B. Pęcherski, A. Arias, Mech.
 Mater. 41, 599-621 (2009)
 12. M. Stanczak, T. Fras, L. Blanc, P. Pawlowski, A. Rusinek Met. 9, 1350:1-24 (2019)
 13. M.F. Ashby, L.J. Gibson, CUP, 93-174 (1997)
 14. T. Wierzbicki, W. Abramowicz, J. Appl. Mech. 50, 727-734 (1983)
 15. T. Fras, I. Szachogluchowicz, L. Sniezek, Eur. Phys. J. 227, 17-27 (2018)
 16. M. Stanczak, T. Fras, L. Blanc, P. Pawlowski, A. Rusinek, Numerical modelling of
 honeycomb structure subjected to blast loading, in Proceedings of the 12th European
 Ls-Dyna Conference 2019, 13-16 May 2019, Koblenz, Germany (2019)

 8
You can also read