Oceana Sustainability Report 2020 Status and Management of West Coast Rock Lobster - Oceana Group
←
→
Page content transcription
If your browser does not render page correctly, please read the page content below
Oceana Sustainability Report 2020
Status and Management of
West Coast Rock LobsterOceana Sustainability Report 2020
1 West Coast rock lobster: TAC determination for 2020/2021
In the past the global Total Allowable Catch (TAC) for the West Coast rock lobster resource was calculated
using an Operational Management Procedure (OMP) approach, similar to the management approach used for
the hake, pelagic fish and South Coast rock lobster resources. However, because the resource has been
judged to be in exceptional circumstance, the TAC recommendations in recent years have not been based on
an OMP, and the TAC has been based on stock assessments and resource biomass projections updated
annually.
The global TAC is divided amongst different sectors each of which is further divided and allocated to the
following super-areas:
• Areas 1 and 2 (Port Nolloth and Hondeklipbaai);
• Areas 3 and 4 (Lamberts Bay and Elandsbaai);
• Areas 5 and 6 (Saldanha Bay Area);
• Area 7 (Dassen Island); and
• Area 8+ (Cape Point, and east to Gansbaai).
1.1 Management considerations for 2020/2021
During 2020, as a result of limited analytical resources, no new stock assessment calculations and forward
projections of resource performance were run. Instead management deliberations relied on the stock
assessment analysis and resource projections that were developed in 2019, in combination with the following
new information:
a. Statistically standardized CPUE trends – there were mixed outcomes by area, some increasing, some
stable, some decreasing.
b. Growth rate calculations based on the OLSPS Marine moult probability model - from these latest
results it is clear that the somatic growth rate reduction last year was an anomaly and the somatic
growth rate has now returned to a level close to the average over the last 10 years.
c. Traffic estimates of IUU fishing catches that are exported – the exported IUU catch is estimated to be
larger than was assumed last year.
d. Summary information from the compliance and policing effort data - these latest results suggest that
the decline in IUU fishing previously estimated for 2018 has not persisted during 2019.
Although the FIMS survey was run in 2020, there were no analytical resources available to analyse the data
from the FIMS and so these data were not available for management deliberations.
Past levels of IUU fishing in the sector, and assumptions about future levels are a critical driver of the results
of those calculations. During 2020 these IUU fishing levels for exports were revised to a level of 500 MT, 182
MT larger than the estimate of 382 MT used as a future projected value in 2019 scientific deliberations.
For the 2020/2021 fishing season, the recommendations tabled in October 2019 are in all likelihood going to
be resubmitted to DEFF decision makers, but adjusted downwards by an appropriate factor linked to the
additional 182 MT of IUU catch. In October 2019 decision makers received information about four different
constant catch options
a. a zero growth constant catch option of 1280 MT,
2b. a status quo catch of 1084 MT (equal to the 2018/2019 TAC), consistent with a resource growth
between 2006 and 2025 of approximately 4%,
c. a catch level of 640 MT consistent with a resource growth between 2006 and 2025 of approximately
15%.
d. a zero constant catch consistent with future growth of 30%.
The final 2019/2020 decision was (b).
In revising these values for reconsideration for the 2020/2021 TAC, the 182 MT was not applied equally to
each of these, rather the tonnages associated with the resource growth rate levels shown of 0%, 4%, 15% and
30% were used as the basis for recalculating these quantities. The value associated with (b) was 837 MT, and
this is the value finally selected by decision makers for the 2020/2021 fishing season.
The trend in the WCRL global TAC since 1991/1992 is shown in Figure 1.
Figure 1. TACs for the West Coast rock lobster resource, 1991/1992 to 2020/2021 fishing seasons. In this plot
1991 refers to the 1991/92 fishing season.
2 South Coast rock lobster: Status, TAC, Prospects
Although also based on the exploitation of a spiny rock lobster resource, the South Coast rock lobster is a
capital intensive and high cost fishery, features more commonly associated with a trawl fishery. The SCRL
fishery is conducted from 7 vessels which range in length from 30 to 40 metres and deploy between 3500 and
6000 plastic traps per vessel. These plastic traps are deployed along a main line roughly 2 km in length and
spaced such that each line carries between 150 and 200 traps. A typical set involves the deployment of 20
such lines and the usual configuration is to deploy two sets of 20 lines which are hauled on alternative days
with an average soak time of 48 hours. Fishing depth ranges from 100 to 250 metres. Traps are winched
collectively by line. Catch rates in the order of 1 lobster per every three traps per set are typical in this fishery,
yielding catch rates in the order of 0.1 kg / trap / pull on a tail weight basis. Crew complements per vessel
vary between 25 and 40. The SCRL fishery is therefore a complex and high cost operation where running a
3vessel above its breakeven point requires careful management of vessel schedules, the selection of fishing
locations, and capital financing.
The South Coast rock lobster (SCRL) fishery is managed by a combination of input and output controls. The
output control is a TAC with associated IQs (Individual Quotas), and the input control is a Total Allowable
Effort (TAE) which is a limitation on the number of fishing days. The TAC is the primary control measure. The
TAE, based on a fishing day allocation, is a secondary measure. Up until the 2015/2016 fishing season, the TAE
was designed to be an active constraint on the fishery roughly 1 in 20 years. An important development
during 2015 was a revision of the effort controls (TAE) used in the management of the fishery. Up to 2014 the
TAE was set on the basis of a 1:40, pool out basis. This means that the effort control, expressed as fishing
days, was at a level of “tightness” that only in one year out of 40 would the industry have difficulty landing
their TAC, because effort levels were too low. The pool out aspect means that a 10% buffer of fishing days
would be held in reserve to assist worthy applicants with additional extra-ordinary effort. This pool amount is
added on to the basic 1:40 years calculated number of fishing days. During 2015 as a result of an initiative by
DAFF and an agreement between DAFF and the South Coast Rock Lobster Industry Association, the basis for
the TAE was tightened to a level of 1:20 “Pool-In”, where the pool of 10% is subtracted from the basic number
of fishing days calculated.
The TAC for the fishery is being managed by means of an OMP in which the TAC is capped at 450 MT, and with
an objective to rebuild the spawning biomass by 30% over the period 2006/07 to 2025/26, an increase in the
rebuilding amount of 20% used in the previous OMP.
The following data are used in the management of the resource:
a. Catch-per-unit-effort – measured as kg tails per trap set
b. Catch-at-length data
c. Tagging data
2.1 Summary of the 2020/2021 TAC decision.
During 2020 the OMP for the SCRL resource, revised in 2019, was applied. The 2019/2020 TAC advice was for
a TAC of 321 MT, and the Minister followed these recommendations and set a TAC of 321 MT tail weight. For
the 2020/2021 TAC it is positive that there has been an increase in the CPUE in 2 out of 3 areas, viz. at Area 1E
and Area 2+3. Using these new CPUE inputs to the OMP formula, the TAC for 2020/2021 is calculated to be
337 MT, and it is very likely therefore that this was the recommendation made by the scientific working group
responsible for South Coast rock lobster. Figure 2 shows the TACs since the 1989/1990 fishing season, and up
to the 2019/2020 fishing season.
4Figure 2. TACs in the South Coast rock lobster fishery 1989/90 – 2019/20.
2.2 MPAs
A series of new MPAs have been established in the South African EEZ and a number of these are located
within the SCRL fishing area. These MPAs are detailed in the Government Gazette No. 42479, dated 23 May
2019. Some of these MPAs are subdivided into areas where SCLR is permitted (controlled zones), and those
where no SCRL fishing is permitted. Based on historical catches, the new MPAs affect about 4.5% of the SCRL
catch. Controlled Zones allow only for fishing of specified species. Four of the designated Controlled Zones
allow for SCRL fishing. These are: Sundays Offshore Controlled Zone, Cannon Rocks Offshore Controlled Zone
(both Addo Elephant Park MPA); Agulhas Bank Controlled Zone (Agulhas Bank Complex MPA); and the Gxulu
Offshore Controlled Zone (Amathole Offshore MPA).
Figure 2. The fishing grounds showing the statistical areas that are used in the formulation of
scientific advice for resource management, South Coast rock lobster resource.
53 Squid jigging industry
The fishery is an effort-controlled fishery, where effort is managed by a combination of vessel and crew
allocation permits and closed seasons. A safe effort level is estimated by mathematical models which use the
following input data:
• Jig catch data
• Trawl catch data
• Jig CPUE data
• Trawl CPUE data
• Spring survey biomass index from demersal trawl surveys
• Autumn survey biomass index from demersal trawl surveys
The management of the resource was reviewed at an international workshop held at the University of Cape
Town in 2012. Some of the scenarios submitted to this meeting suggested that the scope for effort increases
in the fishery was limited.
The following is a summary of important milestones in the fishery:
• Total effort in the fishery rose between the period 1995 to 2010, while the number of crew permits in
the fishery remained unchanged and the number of vessels was reduced. The catch rates peaked in
the period 2008 and 2009 as did effort levels despite the existence of an additional closed season of 6
weeks duration in 2008, 2009 and 2010.
• From 2010 to 2013, catch rates declined to a low point. Although it may be that the effort level
reached a point at which it impaired the recruitment reproductive capacity of the resource, similar
declines in the availability and/or productivity of other resources (notably sole and horse mackerel) at
about the same time suggests that the experience in 2013 was more likely an environmentally driven
event.
The mathematical models of the resource suggest that the effort level in 2010 was 15%-20% higher than
would produce a 5% chance that the 2022 resource biomass would fall less than 20% of the pristine resource
biomass. Any appraisal of this result needs to recognise the semi-arbitrary nature of this risk measure.
Nevertheless, this was a motivation for proposals for effort reductions in the fishery. Two approaches to
reduce effort were considered:
• Reduce crew permits only: One was to eliminate vessels which had previously under-utilised their
opportunities (i.e. days at sea) in the fishery. Under this approach the required 15 - 20% reduction in
effort (to 250 000 man days) is achieved when the total number of crew permits are reduced by 57%.
This calculation assumes that the vessels which remain in the fishery utilise an average number of
fishing days as typical for each vessel in recent years.
• Introduce an additional 4 month closed season, reduce crew permits slightly: Another approach
considered to achieve a target effort level of 250 000 man days was to declare an additional 4 month
long closed season, coupled with eliminating vessels which previously underutilised the time available
for fishing. Under this approach the number of crew permits are reduced by about 7.6% from 2422 to
2238 crew permits by eliminating vessels that have underutilised seadays in the past. This calculation
assumes that the remaining vessel do not increase their seaday usage per month beyond what was
typical in recent years for the remaining open period of fishing.
Managers are concerned about latent effort in the fishery which could increase effort levels. The reality of
latent effort is however strongly contested by industry representatives, they suggest that the data are either
incorrect and/or that the majority of vessels are already turning trips around at close to the maximum level.
6The final management recommendation was to retain crew permits at 2422 and institute extra seasonal
closures during April, May and June, additional to the regular five week closure during October and
November. No vessel specific effort caps were imposed. On paper, this amounts to far less than the desired
reduction in effort. Calculations presented in this document indicate that the net effect of this measure is
very little, if any, reduction in effort. The best available science predicts that as a consequence of these
measures there will be a larger than 5% frequency of resource biomass falling below 20% of pristine.
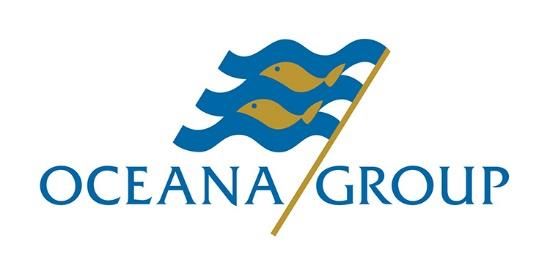
Figure 4. Catches in the squid jigging fishery 1985 to 2019.
Table 1. Table of effort controls and closed seasons for the squid jigging fishery.
Year Effort Controls Closed Season
2005 2423 unrestricted crew, 22 restricted crew 5 weeks Oct / Nov
2006 2423 crew or 138 vessels 5 weeks Oct / Nov
2007 2422 crew or 138 vessels 5 weeks Oct / Nov
2008 2422 crew or 136 vessels 5 weeks Oct / Nov + 6 weeks
2009 2422 crew or 136 vessels 5 weeks Oct / Nov + 6 weeks
2010 2422 crew or 136 vessels 5 weeks Oct / Nov + 6 weeks
2011 2422 crew or 136 vessels 5 weeks Oct / Nov
2012 2422 crew or 136 vessels 5 weeks Oct / Nov
2013 2422 crew or 136 vessels 5 weeks Oct / Nov
2014 2422 crew or 136 vessels April, May, June + 5 weeks Oct / Nov (19
October to 30 November)
72015 2422 crew or 136 vessels April, May, June + 5 weeks Oct / Nov (19
October to 30 November)
2016 2422 crew or 136 vessels April, May, June + 5 weeks Oct / Nov (19
October to 30 November)
2017 2422 crew or 136 vessels April, May, June + 5 weeks Oct / Nov (19
October to 30 November)
2018 2422 crew or 136 vessels April, May, June + 5 weeks Oct / Nov (19
October to 30 November)
2019 2422 crew or 136 vessels April, May, June + 5 weeks Oct / Nov (19
October to 30 November)
8You can also read