Columbia River Recreational Advisor Group Meeting - February 10, 2021 4:00p-5:30p Virtual - WDFW
←
→
Page content transcription
If your browser does not render page correctly, please read the page content below
Columbia River
Recreational
Advisor Group
Meeting
February 10, 2021
4:00p-5:30p
Virtual

Prepared by: Columbia River Joint Staff
Columbia River Recreational Advisor Group Meeting

                                  Virtual
                     Join on your computer or mobile app
                         Click here to join the meeting
                             Or call in (audio only)
              +1 564-999-2000,,334461542# United States, Olympia
                      Phone Conference ID: 334 461 542#

                    4:00p – 5:30p February 10, 2021

                                     Agenda
Introduction                                                       (10 minutes)
    o Roll call
    o Ground rules
    o Agenda review
Spring fishery planning                                            (60 minutes)
    o Summary of management guidelines
   o Lower Columbia River modeling
    o Bonneville-OR/WA state line modeling
Additional Topics                                                  (15 minutes)
   o Other/General discussion
      o Coho forecast
      o Summer Chinook
Future Meetings                                                    (5 minutes)
    o Compact (Select Area Commercial), February 16, 10 am
    o Joint State Hearing, February 23, 10 am
    o North of Falcon Forecast meeting (WA), February 26
    o North of Falcon #1, March 17, 10 am
    o North of Falcon #2, April 1, 10 am

                                      2
Ground rules
• Focus on the task at hand – stick to the agenda
• One person at a time to speak – speak your name to be added to the
speaking list
o Non-advisers will observe meeting and stay on mute – comments
may be permitted at the end of the meeting if time permits
• Be respectful of others
o Mute phone or line
o Be tough on issues and questions, not on people or organizations
o No personal attacks, insults or threats
o Listen
o Speak and act professional – no offensive, disrespectful, or
derogatory language, including profanity
o Allow for a balance of speaking time – limit length and number of
times to speak on each topic
• Be a conduit – share information
3Spring fishery planning
Columbia River Adult Salmon Returns: Actual and Forecasted †
2020 2020 2021
Forecast Return Forecast
Spring Chinook Upriver Total * 81,700 81,300 75,200
Upper Columbia 13,600 12,815 13,000
Upper Columbia natural-origin 2,300 2,189 2,200
** 56,400 51,605 40,000
Snake River Spring/Summer
Snake River natural-origin ** 9,600 14,574 11,100
Lower River Total 54,100 61,194 68,000
Total Spring Chinook 135,800 142,494 143,200
Area-specific detail
Willamette River 40,800 45,965 50,000
Sandy River 5,200 7,518 5,300
Select Areas *** 4,300 3,714 6,300
Cowlitz River 1,400 908 1,800
Kalama River 1,000 1,215 2,200
Lewis River 1,400 1,874 2,400
Wind River*** 2,000 2,076 1,200
***
Drano Lake/Little White Salmon River 4,600 3,850 3,900
Hood River*** 2,300 n/a n/a
***
Klickitat River 1,800 1,517 1,500
***
Deschutes River n/a 1,015 n/a
John Day River*** 2,800 2,095 n/a
Umatilla River*** 900 516 900
***
Yakima River 2,800 2,830 3,200
Summer Chinook Upper Columbia 38,300 65,494 77,600
Sockeye Total Sockeye 246,300 345,018 155,600
Wenatchee 39,400 56,111 27,300
Okanogan 201,800 273,667 127,300
Yakima 2,500 11,790 200
Deschutes 300 n/a 100
Snake River 2,300 734 700
† All forecasts are rounded to the nearest 100s place.
* Upriver totals are developed by T AC for use in management of U.S. v. OR fisheries. Wild components are included in the stock
total. Area-specific estimates for upriver tributaries detailed here are provided by other agencies/entities and may not sum to T AC's
upriver abundance estimates.
** 2020 return is based on current T AC run reconstruction methodology.
*** Return to tributary mouth.
12/11/2020
4Spring Chinook Management Guidelines
Upriver Chinook Stocks
• The 2018-2027 U.S. v Oregon Management Agreement (MA) provides the treaty Indian and
non-treaty fishery harvest frameworks and harvest rate schedules for salmon and steelhead
stocks destined for areas upstream of Bonneville Dam.
• Fisheries are also managed to meet the catch balance provision in the MA for upriver spring
Chinook, which requires that mortalities in non-treaty fisheries not exceed the total allowable
catch available for treaty Indian fisheries. The following table is derived from the harvest
schedule within the MA and reflects the allowable catch and associated ESA impacts for treaty
Indian and non-treaty fisheries.
Spring Management Period Harvest Rate Schedule
Treaty
Indian Treaty Non-Treaty Non-Treaty Total
Total Upriver Snake River Harvest Indian Catch Harvest Mortality Harvest
Run Size Natural Run Size Rate Guideline Rate Guideline Rate
44,000 4,400 6.0% 2,640 1.0% 2,640 7.0%
55,000 5,500 7.0% 3,850 1.5% 3,850 8.5%
82,000 8,200 7.4% 6,068 1.6% 6,068 9.0%
109,000 10,900 8.3% 9,047 1.7% 9,047 10.0%
141,000 14,100 9.1% 12,831 1.9% 12,831 11.0%
217,000 21,700 10.0% 21,700 2.0% 21,700 12.0%
271,000 27,100 10.8% 29,268 2.2% 29,268 13.0%
326,000 32,600 11.7% 38,142 2.3% 38,142 14.0%
380,000 38,000 12.5% 47,500 2.5% 47,500 15.0%
434,000 43,400 13.4% 58,156 2.6% 58,156 16.0%
488,000 48,800 14.3% 69,784 2.7% 69,784 17.0%
• The MA also specifies non-treaty and treaty fisheries occurring prior to a run size update be
managed for a run size that is at least 30% less than the predicted upriver spring Chinook run
size. Buffering the 2021 preseason forecast of 75,200 fish results in an abundance of 52,640
fish for determining pre-update allocations.
Lower Columbia Chinook Stocks (spring run)
• ESA authorization for fisheries impacting listed lower Columbia River Chinook requires
specific hatchery escapement goals be met.
• From NMFS Guidance letter to the Pacific Fishery Management Council in 2019: “The
Cowlitz Salmon Hatchery and Lewis River Salmon Hatchery are being used … for
reintroduction of LCR spring-run Chinook salmon into the upper basins above the existing
dams. The hatchery programs are critical to the overall recovery effort. Given the
circumstances, maintaining the hatchery brood stocks for the Cowlitz and Lewis River
Hatcheries is essential for implementation of specified recovery actions.”
• The 2021 forecasts for the Cowlitz and Lewis rivers are sufficient to provide for the
recreational spring Chinook fishery to occur throughout the LCR, except a no-boat-angling
bubble is being considered for the Cowlitz River mouth.
5Table X. Cowlitz, Kalama, and Lewis River spring Chinook run-size forecasts for 2021 and
hatchery escapement needs. Actual annual hatchery escapement needs may vary slightly to
account for changes in fecundity, sex ratios, pre-spawn loss, etc.
2021 Expectations
Details Cowlitz Kalama Lewis
Forecasted return to Col. R. Mouth 1,830 2,200 2,350
Expected CR mainstem harvest for 2021 30 100 50
Forecasted return to tributary mouth 1,800 2,100 2,300
Avg. % natural-origin return 10.4% 3.3% 1.6%
Natural-origin return 188 70 37
Hatchery-origin return 1,612 2,030 2,263
Hatchery-origin escapement need to trib. mouth* 1,518 680 1,578
Est. lower river hatchery-origin spawners 181 80 198
Broodstock need at hatchery (from Mitchell Act
BIOP when applicable) 1,337 400 1,380
Upstream** if available NA if available
SRKW prey enhancement if available if available if available
SAFE Deep River Net Pen off-channel program 200
Total hatchery-origin broodstock needs 1,337 600 1,380
Harvestable hatchery-origin surplus 94 1,350 685
*Includes fish spawning downriver from hatchery
**Fish are trucked and released above dams for population recovery
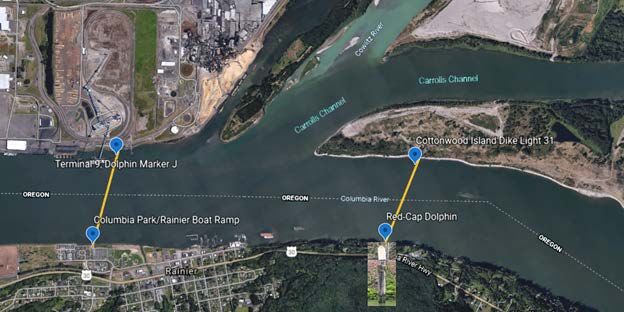
Spring Salmonid Boat Angling Area Closure: Columbia River mainstem adjacent to the Cowlitz River
within the described boundary below, including all of Carrolls Channel, is closed to boat angling for
Salmon and Steelhead.
Downstream boundary – From a point on the Washington shore adjacent to Shipping Terminal 9, Dolphin
Marker J, southerly across Columbia River to Columbia Park Boat Ramp in Rainier, Oregon.
Upstream boundary – From a point on the Washington shore adjacent to Cottonwood Island Dike Light
“31”, southerly across Columbia River to a red-cap dolphin near the Oregon shore (46°05’04.1”N
latitude; 122°54’56.1” W longitude).
6Willamette Spring Chinook
• The Willamette River Fisheries Management Evaluation Plan (FMEP) limits freshwater
fishery impacts on wild Willamette River spring Chinook to ≤15%.
• The Willamette River FMEP includes a sliding scale for escapement goals based on abundance
of hatchery fish which determines the allocation of surplus hatchery spring Chinook to
recreational and commercial fisheries downstream of Willamette Falls. The escapement goals
are also intended to allow for full recreational fisheries in the upper Willamette River.
• The forecasted hatchery fish surplus for recreational fisheries is 15,000 fish and is not expected
to be a constraint.
2021 Mainstem Recreational - preseason management guidelines
• Based on the MA and the preseason forecast of 75,200 upriver spring Chinook, ESA impacts
for 2021 fisheries are limited to 8.5%, with 1.5% for non-treaty fisheries and 7.0% for treaty
Indian fisheries.
• To allow for uncertainty in the preseason forecast, the MA requires a 30% reduction from the
forecast (i.e. a run-size buffer) to start the season, which equates to 52,640 upriver spring
Chinook. At this run size, the MA allows for a non-treaty ESA limit of 1.0%, or an allowable
harvest (kept plus release mortalities) of 3,158 fish prior to a run size update, of which 2,933
are allocated to recreational fisheries (at 80% recreational share of non-treaty impacts as
outlined in current Policy guidance).
• The 2021 allocation policies specific to recreational fishery sub-allocations differ between OR
and WA and are subject to change. All modeling in this document assumes no more than 70%
of the recreational allocation can be allocated to the LCR (WA Policy) and no more than 25%
can be allocated to recreational fisheries upstream of Bonneville Dam (OR Rule). If additional
guidance is provided, staff will modify the modeling results described below and adjust the
staff recommendation if necessary for the Joint State Hearing on February 23, 2021.
72021 Spring Chinook Preseason Management Guidelines
2020 2021
Difference
postseason preseason
Upriver CHS abundance (adults) 81,300 75,200 -6,100
ESA impact rate 1.50% 1.00% -0.5%
Willamette CHS abundance (adults) 45,965 50,000 +4,035
Commission Guidance
2020 2021 Difference
(ESA impact allocation)
Sport allocation* 75% 80% +5%
Commercial allocation 25% 20% -5%
2020 2021
U.S. v OR Catch Balance
preseason preseason
30% Buffered Run 57,190 52,640 -4,550
ESA Impact rate 1.50% 1.00% -0.5%
Catch Balance Available Pre-update 4,003 3,158 -845
Sport Fisheries (LCR, Z6, Snake) 3,686 2,922 -764
Lower Columbia (below Bonneville) 2,899 2,206 -693
Bonneville to OR/WA border 387 315 -72
Snake River (WA waters) 400 243 -157
Sport unallocated NA 158
Commercial Mainstem TBD TBD
Commercial Select Area ≤306 ≤226 -80
*For 2021, assumes current Commission guidance which is non-concurrent with
respect to recreational sub-allocations. Under current Policy guidance, no more
than 70% of the recreational share can be allocated to fisheries Bonneville (OR rule;
10% to fisheries between Bonn-OR/WA border, and 15% to Snake River sport and
Wanapum tribal fisheries).
2021 LCR Spring recreational season - preliminary considerations
• Weekly mainstem test fishing is expected to occur on Monday’s beginning March 15 (up to 9
days, March 15-May 10).
• Provides stock composition, catch rates and bycatch information, and continues long-term
data set; test fishing is helpful in setting potential future commercial fisheries.
• Hatchery fish are sold at fair market value to off-set test fishing operational costs.
• All information can be found at: https://wdfw.wa.gov/fishing/commercial/columbia-river-
test.
• A total of 2,206 total upriver spring Chinook mortalities are available prior to an inseason run
update under existing OR/WA guidance.
• Since the projected escapement of Lower Columbia Chinook is expected to meet minimum
hatchery broodstock needs, modelling assumes the recreational fishery will be open
downstream of the Lewis River for the first time since 2018.
• As described above, staff intends to implement a no-boat angling bubble at the Cowlitz River
mouth to provide additional protection for that stock during pre-update fisheries.
8• Prior to the onset of the COVID-19 pandemic, the 2020 season was adopted for March 1-31
and Thursdays-Saturdays beginning April 2 until the catch balance guideline is met. The actual
season was limited to March 1-26 and May 5, 7, 9, 13, 15-17, and 20.
• Results from 2018-2020 LCR fisheries are not useful for modelling a fishery in 2021; therefore,
staff utilized data from 2007 which had a similar open area and run sizes as expected this year.
• Results from 2019-2020 LCR fisheries are not useful for modeling a fishery in 2021; therefore,
staff utilized data from 2018 which had the same open area and similar run sizes as expected
this year.
• Assuming a seven-day per week fishery from B10 upstream to Bonneville Dam (bank only
upstream of Beacon Rock), model results indicate the season would need to close after April
4 to remain within the pre-update guideline. Staff estimates this season structure could result
in 4,066 fish handled (3,024 kept), including 2,159 upriver CHS mortalities (98% of pre-update
guideline).
• As always, actual fishery results will be monitored in-season and recommended adjustments
to the season will be made as necessary.
2021 BON-S/L Spring recreational season - preliminary considerations
• Based on the assumptions described above, the fishery will be managed for 315 total
mortalities pre run update (387 in 2020).
• The run update is typically not available until early/mid-May, but wasn’t available until later
in May the past four years.
• Prior to the onset of the COVID-19 pandemic, the 2020 season was adopted for April 1-May
5. The actual season was limited to May 5, 7, 9, 13, 15-17, and 20.
• Permanent regulations allow steelhead open through March 31, and closed thereafter except
when spring Chinook is open. Scenario #3 or #4 would result in a multi-week block where
steelhead fishing would be closed.
Season scenarios for the BON-S/L (Zone 6) recreational spring Chinook fishery, 2021
% of
Total May Weekend Catch
Scenario Dates Days days Kept Morts Balance
1 Mar 16-May 4 50 2 246 253 80%
2 April 1-May 4 34 2 245 253 80%
3 April 16-May 5 20 2 247 255 81%
4 May 1-5 5 2 264 273 87%
*Accounts for steelhead fishery impacts and effort shift.
92021 Snake River Spring recreational season preliminary considerations
• Based on the assumptions described above, the fishery will be managed for 243 total
mortalities pre run update (400 in 2020). This total mortality allocation is dependent on the
forecasted mark rate; the actual allocation will change if the observed fishery mark rate differs
from forecasted.
• Snake River fishery managers to determine the season.
• Fishery typically opens in late April on a days-per-week basis in up to four areas.
POST Season ALLOWED Catch Balance for Adult Upriver Spring Chinook in Non-Treaty Fisheries 1,2
2011 2012 2013 2014 2015 2016 2017 2018 3 2019 3 2020 3
Mainstem salmon Winter/Spring 6,492 4,454 2,439 4,547 5,942 3,053 0
SAF Commercial Winter/Spring 333 305 185 364 433 282 ≤347 ≤391 ≤219 ≤305
Commercial Total 6,825 4,759 2,624 4,911 6,376 3,335 347 391 219 305
Lower Columbia Rec (below Bonn) 12,647 11,260 6,168 15,682 19,316 10,791 6,334 7,264 3,899 3,872
Bonneville to McNary Rec 1,686 1,340 822 2,091 2,615 1,439 845 968 520 516
Snake River Spt/Wanapum Tribal 1,012 1,120 603 1,574 2,904 1,527 582 928 479 997
Recreational Total 15,345 13,720 7,593 19,347 24,836 13,756 7,760 9,160 4,898 5,386
Total allowed 22,170 18,479 10,217 24,258 31,211 17,091 8,107 9,552 5,117 5,691
POST Season USED Catch Balance for Adult Upriver Spring Chinook in Non-Treaty Fisheries 1,2
2011 2012 2013 2014 2015 4 2016 4 2017 2018 2019 2020
Mainstem salmon Winter/Spring 3527 4,276 1,498 3,364 5,724 2,954 0 0 0 0
SAF Commercial Winter/Spring 305 329 259 257 804 331 463 311 203 83
Commercial Total 3,832 4,605 1,757 3,621 6,528 3,285 463 311 203 83
Lower Columbia Rec (below Bonn) 9,505 10,428 5,343 13,572 15,689 10,167 7,198 5,868 1,478 1,381
Bonneville to McNary Rec 2,379 886 613 2,231 1,696 1,480 18 623 288 546
Snake River Spt/Wanapum Tribal 1,957 2,377 374 1,546 1,996 1,397 101 773 342 340
Recreational Total 13,842 13,691 6,330 17,349 19,381 13,043 7,316 7,263 2,108 2,267
Total take 17,674 18,297 8,087 20,970 25,909 16,328 7,779 7,574 2,311 2,350
1. Includes release mortalities
2. All data subject to change, recent year data preliminary
3. Due to an unused balance from Select Area commercial fisheries, some amount of Catch Balance allocation would
have been available for mainstem commercial fisheries.
4. Towards the end of the season, some unused ESA/CB allocations available for non-Indian fisheries shifted to
Snake River sport and mainstem commercial fisheries to gain access to harvestable fish.
10Summer Chinook
2021 Summer recreational season - preliminary considerations
• Considering the projected 2021 run size (77,600), OR/WA Policy guidance regarding
allocation of ESA impacts for 2021 commercial and recreational fisheries are not concurrent.
Oregon rule allocates non-treaty sharing downstream of Priest Rapids Dam as 80% recreational
and 20% commercial. Washington Policy sharing is for 70% recreational and 30% commercial
for the expected return.
• The improved forecast for 2021 should provide for recreational fishing opportunity in all areas.
• The first run update is typically not available until around July 1.
• Discussions regarding 2021 summer Chinook will continue at the North of Falcon meetings.
Ocean fishery regulations are set through the Pacific Fishery Management Council process as
non-treaty ocean area fisheries are part of the non-treaty share.
Coho Forecast (Ocean Abundance)
2020 abundance and 2021 forecast of ocean coho run
components prior to harvest (thousands of fish)
2020 2021
Pre Post Pre/Post Forecast
Columbia River Early 130.7 240.7 54% 1,014.0
Columbia River Late 50.3 122.9 41% 576.0
Columbia River Subtotal 181.0 363.6 50% 1,590.0
Coast Subtotal 4.70 6.0 78% 17.9
Total (OPI-H) 185.7 369.6 50% 1,607.9
OCN Rivers 77.1 99.5 77% 116.3
OCN Lakes 5.9 10.5 56% 8.7
OCN Total 83.0 110.0 75% 125.0
Grand Total 268.7 479.6 56% 1,732.9
11You can also read


