Oil Markets: Whipsawed by Trump Wild Cards, Geopolitics, Fundamentals, and IMO 2020
←
→
Page content transcription
If your browser does not render page correctly, please read the page content below
Commodities Strategy | September 2018

Oil Markets: Whipsawed by Trump Wild Cards,
     Geopolitics, Fundamentals, and IMO 2020

Ed MorseAC
Global Head | Commodities Strategy
ed.morse@citi.com
+1 212-723-3871

See Appendix A-1 for Analyst Certification, Important Disclosures and non-US research analyst disclosures
Citi Research is a division of Citigroup Global Markets Inc. (the "Firm"), which does and seeks to do business with companies covered in its research reports. As a result, investors should be
aware that the Firm may have a conflict of interest that could affect the objectivity of this report. Investors should consider this report as only a single factor in making their investment decision.
Certain products (not inconsistent with the author’s published research) are available only on Citi's portals.
This presentation was approved for distribution on 31 August 2018; the disclosures in Appendix A1 are current as of the same date
Near-term price risks are skewed to the upside but longer-term to the downside
                            95                                           91
                                                                                  88        87
                            90                                85                                     85
                                                                                                                83
                            85
                                                                         79
                            80                    75               78             76
                                                                                            74
                            75                          75
                            70           67       75                                                 67
                            65                                69                                                62
                                         67
                            60
                                                                         61
                            55                                                    58
                            50                                                              54
                                                                                                     52    49
                            45
                                      1Q18       2Q18        3Q18E      4Q18E    1Q19E    2Q19E    3Q19E    4Q19E

                                       Bull Case (35%)         Base Case (55%)         Bear Case (10%)     Futures

       ● All things being equal, non-OPEC supply growth should dampen prices through 2019, with
         inventories growing. Is OPEC+ up to the goal of buoying prices ?

       ● But with limited spare capacities and heightened geopolitical risks from Iran sanctions and
         potentially Iraq, Libya, Nigeria, and Venezuela, risks are skewed toward higher prices.

       ● Growing middle distillate demand globally, accompanying higher economic growth, plus IMO
         2020 could push product prices higher, especially from end-2019 through 2020.
    Source: Bloomberg, Citi Research estimates

1
Is a supply gap emerging?
OPEC+ spare capacity at June 2018 output? (k b/d) Iranian oil exports by key importers countries (m b/d)
June Production Potential Effective
Output Capacity Spare Spare 3.0
Saudi Arabia 10,489 12,250 1,761 511
Iran 3,810 3,810 0 0 2.5
Iraq 4,584 4,834 250 0
Other
Kuwait 2,707 3,100 393 143
2.0
UAE 2,890 3,200 310 310 Turkey
Qatar 622 622 0 0
Venezuela 1,321 1,321 0 0 1.5 China
Nigeria 1,511 1,711 200 0 Japan
Libya 650 1,000 350 0 1.0
Algeria 1,054 1,054 0 0 S Korea
Angola 1,448 1,448 0 0 0.5 India
Ecuador 517 517 0 0
Congo (Brazzaville) 319 319 0 0 Europe
0.0
Equatorial Guinea 124 124 0 0
Mar-16
Mar-17
Mar-18
Jan-16
May-16
May-17
Nov-17
May-18
Nov-15
Nov-16
Jan-17
Jan-18
Jul-15
Sep-15
Jul-16
Sep-16
Jul-17
Sep-17
Gabon 180 180 0 0
Total Opec Crude 32,226 35,490 3,264 964
Russia 11,090 11,340 250 250
Total Spare - - 3,514 1,214
Capex has been falling since the 2014 oil price crash but is …and F&D and RRC costs are falling, efficiency of capex is
recovering in 2018… ($bn, complete data only to 2016) rising, discoveries are accelerating ($/boe)
$750 Citi F&D costs IHS F&D costs IHS RRC
$40
$600
$35
$30
$450
$25
$300 $20
$15
$150
$10
$5
$0
199819992000200120022003200420052006200720082009201020112012 2013201420152016 $0
Acquisition costs - proved Acquisition costs - unproved Exploration costs Development & other costs
Source: IHS Herold, EIG, Bloomberg, Citi Equity Research, Citi Research
2Even if not, supply disruption risks should keep markets volatile
Global Oil Supply Disruptions (m b/d) and Petro-state Failure
4.5
Libya Neutral Zone Iran Iraq Nigeria Angola Kuwait Non-OPEC
4.0
3.5
3.0
2.5
2.0
1.5
1.0
0.5
0.0
Jan-11 Oct-11 Jul-12 Apr-13 Jan-14 Oct-14 Jul-15 Apr-16 Jan-17 Oct-17 Jul-18
● Venezuela, Iran, and Iraq hold 49% of global reserves
● The OPEC growers – Saudi Arabia, UAE, Kuwait, Qatar
● The decliners – Venezuela, Angola, Iran
● The swingers – Nigeria, Libya, Iraq
● The rest – Algeria, Gabon, Equatorial Guinea, Ecuador
Source: IEA, Petrologistics, CDU-TEK, OPEC, EIA, Citi Research estimates
3The Camel and the Bear – uncommon bedfellows; limits to common interests?
OPEC and Russia’s crude oil production Russia’s greenfield list adds a ~1.4-m b/d tailwind to
(m b/d, 2014-19E) supply
Russia’s greenfield list, kbd – Adding a 1.4mmbpd tailwind
46 (k2,500
b/d) Yamal LNG
N. Russkoye cluster
Chonsky
2,250
Pyakyakhinskoye
45 2,000
Kuyumba
Erginskoye
Kondinskoye
1,750 Naul
44 Lodochnoye
Tagul
1,500 +1.4mmbpd
Y.-Tokhomskoye
Russkoye
43 1,250 Imilorskoye OPEC+ deal
Suzun effect
E. Messoyakh
1,000
Novoport
42 Arcticgaz
750 Prirazlomnoye
Taas-Yuriakh
Achimgaz
41 500
Rospan
Lukoil's Caspian Sea
250 Trebs & Titov
40 0
Jan-14 Oct-14 Jul-15 Apr-16 Jan-17 Oct-17 Jul-18 Apr-19 '12 '13 '14 '15 '16 '17E '18E '19E '20E '21E '22E
Source: Rosneft, Novatek, Gazpromneft, Lukoil, Interfax, CDU TEK, WoodMac, and Citi Research estimates
Russian crude oil exports westward and eastward China crude imports by selected countries
(k b/d, 2006-18) (k b/d, 2004-18)
Source: Company reports, Interfax, CDU TEK, Wood Mackenzie, JODI, EIA, China Customs, Citi Research estimates
4The US, Saudi Arabia, and Russia are the Big Three of oil markets
The US, Saudi Arabia, and Russia—the Eagle, the Camel, and the Bear—are now the Big Three of oil markets,
accounting for ~40-m b/d of the ~100-m b/d global liquid fuel market in 2018.
US, Saudi, Russian production of liquid fuels* US, Saudi, Russian production of crude oil only
(m b/d, 2005-2022E) (m b/d, 2005-2022E)
20 15
19 14
18
13
17
16 12
15 11
14 US 10 US crude oil only
13
12 Russia 9 Saudi crude only
11 8
Saudi Arabia Russia crude only
10 7
9
6
8
7 5
6 4
2012
2020
2015
2019
2005
2006
2007
2008
2009
2010
2011
2013
2014
2015
2016
2017
2018
2019
2021
2022
2005
2006
2007
2008
2009
2010
2011
2012
2013
2014
2016
2017
2018
2020
2021
2022
Source: IEA, EIA, JODI, Citi Research estimates * Includes crude oil, petroleum products, NGLs, biofuels, refinery gains; Saudi projections are a high case, dependent on investment
5The Rise of the Eagle, the Sultan of Swing
The US has gone from worrying about growing import dependence to seeking global market share as its crude
oil, NGLs, and petroleum product exports surge. With short-cycle shale oil, the US is the new “Sultan of Swing.”
US gross exports of crude, products, NGLs US gross imports and exports of crude, products, NGLs
(m b/d, 1981-2018) (m b/d, 1981-2018)
Crude exports Product exports NGL exports Total Imports Exports
8 16
7 14
6 12
5 10
4 8
3 6
2 4
1 2
0 0
2001
2015
1981
1983
1985
1987
1989
1991
1993
1995
1997
1999
2003
2005
2007
2009
2011
2013
2017
1999
1981
1983
1985
1987
1989
1991
1993
1995
1997
2001
2003
2005
2007
2009
2011
2013
2015
2017
● Growth in US crude, NGLs, and product exports grew ~1.7-m b/d exit to exit in 2017 to 7.3-m b/d.
● In 2018, US liquids production is expected to grow ~1.5-2.0-m b/d, with exports following suit.
● The US has become a massive hydrocarbons hub for the world, focused on the Gulf Coast,
and its position is set to grow as oil exports continue to rise; it is already exporting ~8-m b/d of
crude and products, which should rise +5-7-m b/d by 2025.
● Add LNG and pipeline gas exports, where the US could supply 15-bcf/d by 2020, from 8-bcf/d
in 2017.
Source: EIA, Citi Research
6Medium-term oil: more a crowded market than a supply gap
Citi’s 2017-2022E medium-term oil balances Ex-US non-OPEC crude oil supply growth accelerating
“Supply gap” emerging looks well met by OPEC, non-OPEC, and (Year-on-year growth of annual average, 2013-2019, m b/d)
shale over the next five years; market could be crowded 1.0
110
0.8
0.6 Kazakhstan
105
"Supply gap" to meet oil China
demand growth 0.4 Russia
100 OPEC supply UK
0.2
Norway
Brazil
95 Non-OPEC ex-shale 0.0
Mexico
growth
-0.2 Canada
Non-OPEC supply Ex-US Non-OPEC
90
declines -0.4
85 -0.6
13' 14' 15' 16' 17' 18' 19'
2017 2018 2019 2020 2021 2022
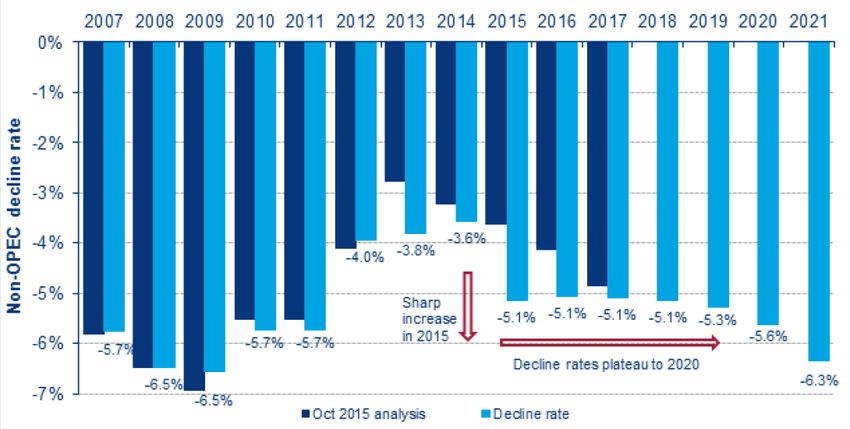
Call on shale is limited, given crowded markets Annual average non-OPEC decline rates (ex-shale)
OPEC expansions meet non-OPEC supply growth, leaving limited space for …have risen since 2014 but may hold steady this decade
shale production growth, implying prices back in the $40s (m b/d)
12
11
Shale @ $70
10
Shale @ $60
9
Shale @ $50
8
Shale @ $45
7
Shale @ $40
6 Shale @ $35
5 Call on shale
4
2015 2016 2017 2018 2019 2020 2021 2022
Source: IEA, EIA, Wood Mackenzie, Citi Research estimates
7IMO 2020 Prelude: Macro indicators support robust distillate demand growth
Global Manufacturing PMI Weighted Index Global Baltic Indices
6
Baltic Dry Baltic Clean Baltic Dirty
5
2500
4
3
2000
2
1
1500
0
1000
-1
-2 500
Jan-11 Oct-11 Jul-12 Apr-13 Jan-14 Oct-14 Jul-15 Apr-16 Jan-17 Oct-17
US Eurozone UK Japan SouthKorea 0
Mexico India China Russia Brazil
Jan-12 Jan-13 Jan-14 Jan-15 Jan-16 Jan-17 Jan-18
Saudi Indonesia Taiwan Total
IATA Global Passenger Traffic – Jun-18 Update US Trucking Tonnage Y/Y Growth (%)
Passenger traffic (RPK), % Year-on-Year
US Trucking Tonnage
8.5
Passenger capacity (ASK) % Year-on-Year
12
8.0
10
7.5
8
7.0
6
6.5
4
6.0
2
5.5
5.0 0
4.5 -2
4.0 -4
Jan-13 Aug-13 Mar-14 Oct-14 May-15 Dec-15 Jul-16 Feb-17 Sep-17 Apr-18
2011 2012 2013 2014 2015 2016 2017 2018E
Source: Markit, ISM, World Bank, Baltic Index, IATA, ATA, Citi Research
8Key marine bunker fuel market scenarios and 2020 prices
2020 snapshot—global marine bunker fuel market scenarios and illustrative prices and cracks (base, bull, bear) with the
IMO sulfur spec change, versus estimated baseline without IMO sulfur spec change
(m b/d, $/bbl)
MGO (m b/d) HSFO (m b/d) Diesel ($/bbl) HSFO ($/bbl) Brent ($/bbl)
vs. vs.
Demand baseline Demand baseline Price Crack Price Crack Price
Baseline 1.4 3.3 63 8 43 -12 55
Base case 2.6 1.3 1.5 -1.8 85 30 25 -30 55
Bull case 3.4 2.1 1.3 -2.1 95 40 15 -40 55
Bear case 1.8 0.4 2.2 -1.1 65 10 45 -10 55
Scenario analysis: boost to MGO demand and drop in HSFO demand* Scrubbers installed or on order
(k b/d, 2020 base case with IMO sulfur spec change, versus 2020 baseline without IMO sulfur spec change) (number of vessels, % of fleet of that vessel type)
2500
2000
1500
1000
500
0 MGO
-500 HSFO
-1000
-1500
-2000
-2500
LBB
BLB
LBH
HHB
LBL
HHL
BHL
BLH
BHH
BHB
HHH
BBL
LHL
LLH
HBH
HBB
BLL
HBL
LLB
LLL
BBH
BBB
LHH
LHB
HLH
HLB
HLL
Source: S&P Platts, Citi Research * Based on scenarios for (1) bunker market demand growth, (2) scrubber installation, (3) non-compliance; for these three factors considered,
each had a base (“B”), low (“L”), and high (“H”) case; for example, high bunker market demand growth, low scrubber installation scenario, and base-case non-compliance is “HLB”
9Appendix A-1
Analyst Certification
The research analysts primarily responsible for the preparation and content of this research report are either (i) designated by “AC” in the author block or (ii) listed
in bold alongside content which is attributable to that analyst. If multiple AC analysts are designated in the author block, each analyst is certifying with respect to
the entire research report other than (a) content attributable to another AC certifying analyst listed in bold alongside the content and (b) views expressed solely with
respect to a specific issuer which are attributable to another AC certifying analyst identified in the price charts or rating history tables for that issuer shown below.
Each of these analysts certify, with respect to the sections of the report for which they are responsible: (1) that the views expressed therein accurately reflect their
personal views about each issuer and security referenced and were prepared in an independent manner, including with respect to Citigroup Global Markets Inc. and
its affiliates; and (2) no part of the research analyst's compensation was, is, or will be, directly or indirectly, related to the specific recommendations or views
expressed by that research analyst in this report.
IMPORTANT DISCLOSURES
Within the past 12 months, Citigroup Global Markets Inc. or its affiliates has acted as manager or co-manager of an offering of securities of Saudi Arabia, United States.
Citigroup Global Markets Inc. owns a position of 1 million USD or more in the debt securities of Saudi Arabia, United States.
Citigroup Global Markets Inc. or its affiliates has received compensation for investment banking services provided within the past 12 months from Saudi Arabia, Russian
Federation, United States.
Citigroup Global Markets Inc. or its affiliates expects to receive or intends to seek, within the next three months, compensation for investment banking services from Saudi
Arabia, Russian Federation.
Citigroup Global Markets Inc. or an affiliate received compensation for products and services other than investment banking services from Saudi Arabia, Russian Federation,
United States in the past 12 months.
Citigroup Global Markets Inc. currently has, or had within the past 12 months, the following as investment banking client(s): Saudi Arabia, Russian Federation, United States.
Citigroup Global Markets Inc. currently has, or had within the past 12 months, the following as clients, and the services provided were non-investment-banking, securities-
related: Saudi Arabia, Russian Federation, United States.
Citigroup Global Markets Inc. currently has, or had within the past 12 months, the following as clients, and the services provided were non-investment-banking, non-securities-
related: Saudi Arabia, Russian Federation, United States.
Citigroup Global Markets Inc. and/or its affiliates has a significant financial interest in relation to Saudi Arabia, Russian Federation, United States. (For an explanation of the
determination of significant financial interest, please refer to the policy for managing conflicts of interest which can be found at www.citiVelocity.com.)
Disclosure for investors in the Republic of Turkey: Under Capital Markets Law of Turkey (Law No: 6362), the investment information, comments and recommendations
stated here, are not within the scope of investment advisory activity. Investment advisory service is provided in accordance with a contract of engagement on investment
advisory concluded between brokerage houses, portfolio management companies, non-deposit banks and clients. Comments and recommendations stated here rely on the
10individual opinions of the ones providing these comments and recommendations. These opinions may not fit to your financial status, risk and return preferences. For this reason,
to make an investment decision by relying solely to this information stated here may not bring about outcomes that fit your expectations. Furthermore, Citi Research is a division
of Citigroup Global Markets Inc. (the “Firm”), which does and seeks to do business with companies and/or trades on securities covered in this research reports. As a result,
investors should be aware that the Firm may have a conflict of interest that could affect the objectivity of this report, however investors should also note that the Firm has in
place organisational and administrative arrangements to manage potential conflicts of interest of this nature.
Analysts’ compensation is determined by Citi Research management and Citigroup’s senior management and is based upon activities and services intended to benefit the
investor clients of Citigroup Global Markets Inc. and its affiliates (the “Firm”). Compensation is not linked to specific transactions or recommendations. Like all Firm employees,
analysts receive compensation that is impacted by overall Firm profitability which includes investment banking, sales and trading, and principal trading revenues. One factor in
equity research analyst compensation is arranging corporate access events between institutional clients and the management teams of covered companies. Typically, company
management is more likely to participate when the analyst has a positive view of the company.
For securities recommended in the Product in which the Firm is not a market maker, the Firm is a liquidity provider in the issuers' financial instruments and may act as principal
in connection with such transactions. The Firm is a regular issuer of traded financial instruments linked to securities that may have been recommended in the Product. The Firm
regularly trades in the securities of the issuer(s) discussed in the Product. The Firm may engage in securities transactions in a manner inconsistent with the Product and, with
respect to securities covered by the Product, will buy or sell from customers on a principal basis.
For important disclosures (including copies of historical disclosures) regarding the companies that are the subject of this Citi Research product ("the Product"), please contact
Citi Research, 388 Greenwich Street, 28th Floor, New York, NY, 10013, Attention: Legal/Compliance [E6WYB6412478]. In addition, the same important disclosures, with the
exception of the Valuation and Risk assessments and historical disclosures, are contained on the Firm's disclosure website at
https://www.citivelocity.com/cvr/eppublic/citi_research_disclosures. Valuation and Risk assessments can be found in the text of the most recent research note/report regarding
the subject company. Pursuant to the Market Abuse Regulation a history of all Citi Research recommendations published during the preceding 12-month period can be
accessed via Citi Velocity (https://www.citivelocity.com/cv2) or your standard distribution portal. Historical disclosures (for up to the past three years) will be provided upon
request.
NON-US RESEARCH ANALYST DISCLOSURES
Non-US research analysts who have prepared this report (i.e., all research analysts listed below other than those identified as employed by Citigroup Global Markets Inc.) are
not registered/qualified as research analysts with FINRA. Such research analysts may not be associated persons of the member organization and therefore may not be subject
to the FINRA Rule 2241 restrictions on communications with a subject company, public appearances and trading securities held by a research analyst account. The legal entities
employing the authors of this report are listed below:
Citigroup Global Markets Inc Edward L Morse
OTHER DISCLOSURES
Any price(s) of instruments mentioned in recommendations are as of the prior day’s market close on the primary market for the instrument, unless otherwise stated.
European regulations require that where a recommendation differs from any of the author’s previous recommendations concerning the same financial instrument or issuer that
has been published during the preceding 12-month period that the change(s) and the date of that previous recommendation are indicated. Please refer to the trade history in
the published research or contact the research analyst.
European regulations require that a firm must establish, implement and make available a policy for managing conflicts of interest arising as a result of publication or distribution
of investment research. The policy applicable to Citi Research's Products can be found at https://www.citivelocity.com/cvr/eppublic/citi_research_disclosures.
11The proportion of all Citi Research research recommendations that were the equivalent to “Buy”,”Hold”,”Sell” at the end of each quarter over the prior 12 months (with the % of
these that had received investment firm services from Citi in the prior 12 months shown in brackets) is as follows: Q2 2018 Buy 33% (70%), Hold 43% (64%), Sell 23% (57%),
RV 0.6% (89%); Q1 2018 Buy 32% (71%), Hold 44% (63%), Sell 24% (56%), RV 0.4% (98%); Q4 2017 Buy 32% (70%), Hold 44% (65%), Sell 24% (57%), RV NA (NA); Q3
2017 Buy 32% (70%), Hold 44% (64%), Sell 24% (58%), RV NA (NA). For the purposes of disclosing recommendations other than for equity or high yield recommendations
(whose definitions can be found in their corresponding disclosure sections), “Buy” means a positive directional trade idea; “Sell” means a negative directional trade idea; and
“Relative Value” means any trade idea which does not have a clear direction to the investment strategy.
European regulations require a 5 year price history when past performance of a security is referenced. CitiVelocity’s Charting Tool
(https://www.citivelocity.com/cv2/#go/CHARTING_3_Equities) provides the facility to create customisable price charts including a five year option. This tool can be found in the
Data & Analytics section under any of the asset class menus in CitiVelocity (https://www.citivelocity.com/). For further information contact CitiVelocity support
(https://www.citivelocity.com/cv2/go/CLIENT_SUPPORT). The source for all referenced prices, unless otherwise stated, is DataCentral, which sources price information from
Thomson Reuters. Past performance is not a guarantee or reliable indicator of future results. Forecasts are not a guarantee or reliable indicator of future performance.
Investors should always consider the investment objectives, risks, and charges and expenses of an ETF carefully before investing. The applicable prospectus and key investor
information document (as applicable) for an ETF should contain this and other information about such ETF. It is important to read carefully any such prospectus before investing.
Clients may obtain prospectuses and key investor information documents for ETFs from the applicable distributor or authorized participant, the exchange upon which an ETF is
listed and/or from the applicable website of the applicable ETF issuer. The value of the investments and any accruing income may fall or rise. Any past performance, prediction
or forecast is not indicative of future or likely performance. Any information on ETFs contained herein is provided strictly for illustrative purposes and should not be deemed an
offer to sell or a solicitation of an offer to purchase units of any ETF either explicitly or implicitly. The opinions expressed are those of the authors and do not necessarily reflect
the views of ETF issuers, any of their agents or their affiliates.
Citigroup Global Markets India Private Limited and/or its affiliates may have, from time to time, actual or beneficial ownership of 1% or more in the debt securities of the subject
issuer.
Citi Research generally disseminates its research to the Firm’s global institutional and retail clients via both proprietary (e.g., Citi Velocity and Citi Personal Wealth Management)
and non-proprietary electronic distribution platforms. Certain research may be disseminated only via the Firm’s proprietary distribution platforms; however such research will not
contain changes to earnings forecasts, target price, investment or risk rating or investment thesis or be otherwise inconsistent with the author’s previously published research.
Certain research is made available only to institutional investors to satisfy regulatory requirements. Individual Citi Research analysts may also opt to circulate published
research to one or more clients by email; such email distribution is discretionary and is done only after the research has been disseminated. The level and types of services
provided by Citi Research analysts to clients may vary depending on various factors such as the client’s individual preferences as to the frequency and manner of receiving
communications from analysts, the client’s risk profile and investment focus and perspective (e.g. market-wide, sector specific, long term, short-term etc.), the size and scope of
the overall client relationship with the Firm and legal and regulatory constraints.
Pursuant to Comissão de Valores Mobiliários Rule 598 and ASIC Regulatory Guide 264, Citi is required to disclose whether a Citi related company or business has a
commercial relationship with the subject company. Considering that Citi operates multiple businesses in more than 100 countries around the world, it is likely that Citi has a
commercial relationship with the subject company.
Securities recommended, offered, or sold by the Firm: (i) are not insured by the Federal Deposit Insurance Corporation; (ii) are not deposits or other obligations of any insured
depository institution (including Citibank); and (iii) are subject to investment risks, including the possible loss of the principal amount invested. The Product is for informational
purposes only and is not intended as an offer or solicitation for the purchase or sale of a security. Any decision to purchase securities mentioned in the Product must take into
account existing public information on such security or any registered prospectus. Although information has been obtained from and is based upon sources that the Firm
believes to be reliable, we do not guarantee its accuracy and it may be incomplete and condensed. Note, however, that the Firm has taken all reasonable steps to determine the
accuracy and completeness of the disclosures made in the Important Disclosures section of the Product. The Firm's research department has received assistance from the
12subject company(ies) referred to in this Product including, but not limited to, discussions with management of the subject company(ies) or visiting company sites. Firm policy
prohibits research analysts from sending draft research to subject companies. However, it should be presumed that the author of the Product has had discussions with the
subject company to ensure factual accuracy prior to publication. All opinions, projections and estimates constitute the judgment of the author as of the date of the Product and
these, plus any other information contained in the Product, are subject to change without notice. Prices and availability of financial instruments also are subject to change
without notice. Notwithstanding other departments within the Firm advising the companies discussed in this Product, information obtained in such role is not used in the
preparation of the Product. Although Citi Research does not set a predetermined frequency for publication, if the Product is a fundamental equity or credit research report, it is
the intention of Citi Research to provide research coverage of the covered issuers, including in response to news affecting the issuer. For non-fundamental research reports, Citi
Research may not provide regular updates to the views, recommendations and facts included in the reports. Notwithstanding that Citi Research maintains coverage on, makes
recommendations concerning or discusses issuers, Citi Research may be periodically restricted from referencing certain issuers due to legal or policy reasons. Where a
component of a published trade idea is subject to a restriction, the trade idea will be removed from any list of open trade ideas included in the Product. Upon the lifting of the
restriction, the trade idea will either be re-instated in the open trade ideas list if the analyst continues to support it or it will be officially closed. Citi Research may provide different
research products and services to different classes of customers (for example, based upon long-term or short-term investment horizons) that may lead to differing conclusions or
recommendations that could impact the price of a security contrary to the recommendations in the alternative research product, provided that each is consistent with the rating
system for each respective product.
Investing in non-U.S. securities, including ADRs, may entail certain risks. The securities of non-U.S. issuers may not be registered with, nor be subject to the reporting
requirements of the U.S. Securities and Exchange Commission. There may be limited information available on foreign securities. Foreign companies are generally not subject to
uniform audit and reporting standards, practices and requirements comparable to those in the U.S. Securities of some foreign companies may be less liquid and their prices
more volatile than securities of comparable U.S. companies. In addition, exchange rate movements may have an adverse effect on the value of an investment in a foreign stock
and its corresponding dividend payment for U.S. investors. Net dividends to ADR investors are estimated, using withholding tax rates conventions, deemed accurate, but
investors are urged to consult their tax advisor for exact dividend computations. Investors who have received the Product from the Firm may be prohibited in certain states or
other jurisdictions from purchasing securities mentioned in the Product from the Firm. Please ask your Financial Consultant for additional details. Citigroup Global Markets Inc.
takes responsibility for the Product in the United States. Any orders by US investors resulting from the information contained in the Product may be placed only through
Citigroup Global Markets Inc.
Important Disclosures for Bell Potter Customers: Bell Potter is making this Product available to its clients pursuant to an agreement with Citigroup Global Markets Australia
Pty Limited. Neither Citigroup Global Markets Australia Pty Limited nor any of its affiliates has made any determination as to the suitability of the information provided herein
and clients should consult with their Bell Potter financial advisor before making any investment decision.
The Citigroup legal entity that takes responsibility for the production of the Product is the legal entity which the first named author is employed by. The Product is
made available in Australia through Citigroup Global Markets Australia Pty Limited. (ABN 64 003 114 832 and AFSL No. 240992), participant of the ASX Group and regulated
by the Australian Securities & Investments Commission. Citigroup Centre, 2 Park Street, Sydney, NSW 2000. Citigroup Global Markets Australia Pty Limited is not an
Authorised Deposit-Taking Institution under the Banking Act 1959, nor is it regulated by the Australian Prudential Regulation Authority. The Product is made available in Australia
to Private Banking wholesale clients through Citigroup Pty Limited (ABN 88 004 325 080 and AFSL 238098). Citigroup Pty Limited provides all financial product advice to
Australian Private Banking wholesale clients through bankers and relationship managers. If there is any doubt about the suitability of investments held in Citigroup Private Bank
accounts, investors should contact the Citigroup Private Bank in Australia. Citigroup companies may compensate affiliates and their representatives for providing products and
services to clients. The Product is made available in Brazil by Citigroup Global Markets Brasil - CCTVM SA, which is regulated by CVM - Comissão de Valores Mobiliários
("CVM"), BACEN - Brazilian Central Bank, APIMEC - Associação dos Analistas e Profissionais de Investimento do Mercado de Capitais and ANBIMA – Associação Brasileira
das Entidades dos Mercados Financeiro e de Capitais. Av. Paulista, 1111 - 14º andar(parte) - CEP: 01311920 - São Paulo - SP. If the Product is being made available in certain
provinces of Canada by Citigroup Global Markets (Canada) Inc. ("CGM Canada"), CGM Canada has approved the Product. Citigroup Place, 123 Front Street West, Suite 1100,
Toronto, Ontario M5J 2M3. This product is available in Chile through Banchile Corredores de Bolsa S.A., an indirect subsidiary of Citigroup Inc., which is regulated by the
13Superintendencia de Valores y Seguros. Agustinas 975, piso 2, Santiago, Chile. The Product is made available in Germany by Citigroup Global Markets Deutschland AG
("CGMD"), which is regulated by Bundesanstalt fuer Finanzdienstleistungsaufsicht (BaFin). CGMD, Reuterweg 16, 60323 Frankfurt am Main. Research which relates to
"securities" (as defined in the Securities and Futures Ordinance (Cap. 571 of the Laws of Hong Kong)) is issued in Hong Kong by, or on behalf of, Citigroup Global Markets Asia
Limited which takes full responsibility for its content. Citigroup Global Markets Asia Ltd. is regulated by Hong Kong Securities and Futures Commission. If the Research is made
available through Citibank, N.A., Hong Kong Branch, for its clients in Citi Private Bank, it is made available by Citibank N.A., Citibank Tower, Citibank Plaza, 3 Garden Road,
Hong Kong. Citibank N.A. is regulated by the Hong Kong Monetary Authority. Please contact your Private Banker in Citibank N.A., Hong Kong, Branch if you have any queries
on or any matters arising from or in connection with this document. The Product is made available in India by Citigroup Global Markets India Private Limited (CGM), which is
regulated by the Securities and Exchange Board of India (SEBI), as a Research Analyst (SEBI Registration No. INH000000438). CGM is also actively involved in the business
of merchant banking and stock brokerage in India, and is registered with SEBI in this regard. CGM’s registered office is at 1202, 12th Floor, FIFC, G Block, Bandra Kurla
Complex, Bandra East, Mumbai – 400098. CGM’s Corporate Identity Number is U99999MH2000PTC126657, and its contact details are: Tel:+9102261759999
Fax:+9102261759961. The Product is made available in Indonesia through PT Citigroup Securities Indonesia. 5/F, Citibank Tower, Bapindo Plaza, Jl. Jend. Sudirman Kav. 54-
55, Jakarta 12190. Neither this Product nor any copy hereof may be distributed in Indonesia or to any Indonesian citizens wherever they are domiciled or to Indonesian
residents except in compliance with applicable capital market laws and regulations. This Product is not an offer of securities in Indonesia. The securities referred to in this
Product have not been registered with the Capital Market and Financial Institutions Supervisory Agency (BAPEPAM-LK) pursuant to relevant capital market laws and
regulations, and may not be offered or sold within the territory of the Republic of Indonesia or to Indonesian citizens through a public offering or in circumstances which
constitute an offer within the meaning of the Indonesian capital market laws and regulations. The Product is made available in Israel through Citibank NA, regulated by the
Bank of Israel and the Israeli Securities Authority. Citibank, N.A, Platinum Building, 21 Ha'arba'ah St, Tel Aviv, Israel. The Product is made available in Italy by Citigroup Global
Markets Limited, which is authorised by the PRA and regulated by the FCA and the PRA. Via dei Mercanti, 12, Milan, 20121, Italy. The Product is made available in Japan by
Citigroup Global Markets Japan Inc. ("CGMJ"), which is regulated by Financial Services Agency, Securities and Exchange Surveillance Commission, Japan Securities Dealers
Association, Tokyo Stock Exchange and Osaka Securities Exchange. Otemachi Park Building, 1-1-1 Otemachi, Chiyoda-ku, Tokyo 100-8132 Japan. If the Product was
distributed by SMBC Nikko Securities Inc. it is being so distributed under license. In the event that an error is found in an CGMJ research report, a revised version will be
posted on the Firm's Citi Velocity website. If you have questions regarding Citi Velocity, please call (81 3) 6270-3019 for help. The Product is made available in Korea by
Citigroup Global Markets Korea Securities Ltd., which is regulated by the Financial Services Commission, the Financial Supervisory Service and the Korea Financial Investment
Association (KOFIA). Citibank Building, 39 Da-dong, Jung-gu, Seoul 100-180, Korea. KOFIA makes available registration information of research analysts on its
website. Please visit the following website if you wish to find KOFIA registration information on research analysts of Citigroup Global Markets Korea Securities
Ltd. http://dis.kofia.or.kr/websquare/index.jsp?w2xPath=/wq/fundMgr/DISFundMgrAnalystList.xml&divisionId=MDIS03002002000000&serviceId=SDIS03002002000. The
Product is made available in Korea by Citibank Korea Inc., which is regulated by the Financial Services Commission and the Financial Supervisory Service. Address is Citibank
Building, 39 Da-dong, Jung-gu, Seoul 100-180, Korea. This research report is intended to be provided only to Professional Investors as defined in the Financial Investment
Services and Capital Market Act and its Enforcement Decree in Korea. The Product is made available in Malaysia by Citigroup Global Markets Malaysia Sdn Bhd (Company
No. 460819-D) (“CGMM”) to its clients and CGMM takes responsibility for its contents. CGMM is regulated by the Securities Commission of Malaysia. Please contact CGMM at
Level 43 Menara Citibank, 165 Jalan Ampang, 50450 Kuala Lumpur, Malaysia in respect of any matters arising from, or in connection with, the Product. The Product is made
available in Mexico by Acciones y Valores Banamex, S.A. De C. V., Casa de Bolsa, Integrante del Grupo Financiero Banamex ("Accival") which is a wholly owned subsidiary of
Citigroup Inc. and is regulated by Comision Nacional Bancaria y de Valores. Reforma 398, Col. Juarez, 06600 Mexico, D.F. In New Zealand the Product is made available to
‘wholesale clients’ only as defined by s5C(1) of the Financial Advisers Act 2008 (‘FAA’) through Citigroup Global Markets Australia Pty Ltd (ABN 64 003 114 832 and AFSL No.
240992), an overseas financial adviser as defined by the FAA, participant of the ASX Group and regulated by the Australian Securities & Investments Commission. Citigroup
Centre, 2 Park Street, Sydney, NSW 2000. The Product is made available in Pakistan by Citibank N.A. Pakistan branch, which is regulated by the State Bank of Pakistan and
Securities Exchange Commission, Pakistan. AWT Plaza, 1.1. Chundrigar Road, P.O. Box 4889, Karachi-74200. The Product is made available in the Philippines through
Citicorp Financial Services and Insurance Brokerage Philippines, Inc., which is regulated by the Philippines Securities and Exchange Commission. 20th Floor Citibank Square
Bldg. The Product is made available in the Philippines through Citibank NA Philippines branch, Citibank Tower, 8741 Paseo De Roxas, Makati City, Manila. Citibank NA
14Philippines NA is regulated by The Bangko Sentral ng Pilipinas. The Product is made available in Poland by Dom Maklerski Banku Handlowego SA an indirect subsidiary of
Citigroup Inc., which is regulated by Komisja Nadzoru Finansowego. Dom Maklerski Banku Handlowego S.A. ul.Senatorska 16, 00-923 Warszawa. The Product is made
available in the Russian Federation through AO Citibank, which is licensed to carry out banking activities in the Russian Federation in accordance with the general banking
license issued by the Central Bank of the Russian Federation and brokerage activities in accordance with the license issued by the Federal Service for Financial
Markets. Neither the Product nor any information contained in the Product shall be considered as advertising the securities mentioned in this report within the territory of the
Russian Federation or outside the Russian Federation. The Product does not constitute an appraisal within the meaning of the Federal Law of the Russian Federation of 29
July 1998 No. 135-FZ (as amended) On Appraisal Activities in the Russian Federation. 8-10 Gasheka Street, 125047 Moscow. The Product is made available in Singapore
through Citigroup Global Markets Singapore Pte. Ltd. (“CGMSPL”), a capital markets services license holder, and regulated by Monetary Authority of Singapore. Please contact
CGMSPL at 8 Marina View, 21st Floor Asia Square Tower 1, Singapore 018960, in respect of any matters arising from, or in connection with, the analysis of this document. This
report is intended for recipients who are accredited, expert and institutional investors as defined under the Securities and Futures Act (Cap. 289). The Product is made available
by The Citigroup Private Bank in Singapore through Citibank, N.A., Singapore Branch, a licensed bank in Singapore that is regulated by Monetary Authority of Singapore.
Please contact your Private Banker in Citibank N.A., Singapore Branch if you have any queries on or any matters arising from or in connection with this document. This report is
intended for recipients who are accredited, expert and institutional investors as defined under the Securities and Futures Act (Cap. 289). This report is distributed in Singapore
by Citibank Singapore Ltd ("CSL") to selected Citigold/Citigold Private Clients. CSL provides no independent research or analysis of the substance or in preparation of this
report. Please contact your Citigold//Citigold Private Client Relationship Manager in CSL if you have any queries on or any matters arising from or in connection with this report.
This report is intended for recipients who are accredited investors as defined under the Securities and Futures Act (Cap. 289). Citigroup Global Markets (Pty) Ltd. is
incorporated in the Republic of South Africa (company registration number 2000/025866/07) and its registered office is at 145 West Street, Sandton, 2196, Saxonwold.
Citigroup Global Markets (Pty) Ltd. is regulated by JSE Securities Exchange South Africa, South African Reserve Bank and the Financial Services Board. The investments and
services contained herein are not available to private customers in South Africa. The Product is made available in the Republic of China through Citigroup Global Markets
Taiwan Securities Company Ltd. ("CGMTS"), 14 and 15F, No. 1, Songzhi Road, Taipei 110, Taiwan, subject to the license scope and the applicable laws and regulations in the
Republic of China. CGMTS is regulated by the Securities and Futures Bureau of the Financial Supervisory Commission of Taiwan, the Republic of China. No portion of the
Product may be reproduced or quoted in the Republic of China by the press or any third parties [without the written authorization of CGMTS]. Pursuant to the applicable laws
and regulations in the Republic of China, the recipient of the Product shall not take advantage of such Product to involve in any matters in which the recipient may have conflicts
of interest. If the Product covers securities which are not allowed to be offered or traded in the Republic of China, neither the Product nor any information contained in the
Product shall be considered as advertising the securities or making recommendation of the securities in the Republic of China. The Product is for informational purposes only
and is not intended as an offer or solicitation for the purchase or sale of a security or financial products. Any decision to purchase securities or financial products mentioned in
the Product must take into account existing public information on such security or the financial products or any registered prospectus. The Product is made available in
Thailand through Citicorp Securities (Thailand) Ltd., which is regulated by the Securities and Exchange Commission of Thailand. 399 Interchange 21 Building, 18th Floor,
Sukhumvit Road, Klongtoey Nua, Wattana ,Bangkok 10110, Thailand. The Product is made available in Turkey through Citibank AS which is regulated by Capital Markets
Board. Tekfen Tower, Eski Buyukdere Caddesi # 209 Kat 2B, 23294 Levent, Istanbul, Turkey. In the U.A.E, these materials (the "Materials") are communicated by Citigroup
Global Markets Limited, DIFC branch ("CGML"), an entity registered in the Dubai International Financial Center ("DIFC") and licensed and regulated by the Dubai Financial
Services Authority ("DFSA") to Professional Clients and Market Counterparties only and should not be relied upon or distributed to Retail Clients. A distribution of the different
Citi Research ratings distribution, in percentage terms for Investments in each sector covered is made available on request. Financial products and/or services to which the
Materials relate will only be made available to Professional Clients and Market Counterparties. The Product is made available in United Kingdom by Citigroup Global Markets
Limited, which is authorised by the Prudential Regulation Authority (“PRA”) and regulated by the Financial Conduct Authority (“FCA”) and the PRA. This material may relate to
investments or services of a person outside of the UK or to other matters which are not authorised by the PRA nor regulated by the FCA and the PRA and further details as to
where this may be the case are available upon request in respect of this material. Citigroup Centre, Canada Square, Canary Wharf, London, E14 5LB. The Product is made
available in United States by Citigroup Global Markets Inc, which is a member of FINRA and registered with the US Securities and Exchange Commission. 388 Greenwich
Street, New York, NY 10013. Unless specified to the contrary, within EU Member States, the Product is made available by Citigroup Global Markets Limited, which is
15authorised by the PRA and regulated by the FCA and the PRA.
The Product is not to be construed as providing investment services in any jurisdiction where the provision of such services would not be permitted.
Subject to the nature and contents of the Product, the investments described therein are subject to fluctuations in price and/or value and investors may get back less than
originally invested. Certain high-volatility investments can be subject to sudden and large falls in value that could equal or exceed the amount invested. Certain investments
contained in the Product may have tax implications for private customers whereby levels and basis of taxation may be subject to change. If in doubt, investors should seek
advice from a tax adviser. The Product does not purport to identify the nature of the specific market or other risks associated with a particular transaction. Advice in the Product
is general and should not be construed as personal advice given it has been prepared without taking account of the objectives, financial situation or needs of any particular
investor. Accordingly, investors should, before acting on the advice, consider the appropriateness of the advice, having regard to their objectives, financial situation and needs.
Prior to acquiring any financial product, it is the client's responsibility to obtain the relevant offer document for the product and consider it before making a decision as to whether
to purchase the product.
Citi Research product may source data from dataCentral. dataCentral is a Citi Research proprietary database, which includes the Firm’s estimates, data from company reports
and feeds from Thomson Reuters. The source for all referenced prices, unless otherwise stated, is DataCentral. Past performance is not a guarantee or reliable indicator of
future results. Forecasts are not a guarantee or reliable indicator of future performance. The printed and printable version of the research report may not include all the
information (e.g., certain financial summary information and comparable company data) that is linked to the online version available on the Firm's proprietary electronic
distribution platforms.
© 2018 Citigroup Global Markets Inc. Citi Research is a division of Citigroup Global Markets Inc. Citi and Citi with Arc Design are trademarks and service marks of Citigroup Inc.
and its affiliates and are used and registered throughout the world. All rights reserved. The research data in this report is not intended to be used for the purpose of (a)
determining the price or amounts due in respect (or to value) of one or more financial products or instruments and/or (b) measuring or comparing the performance of a financial
product, a portfolio of financial instruments, or a collective investment undertaking, and any such use is strictly prohibited without the prior written consent of Citi Research. Any
unauthorized use, duplication, redistribution or disclosure of this report (the “Product”), including, but not limited to, redistribution of the Product by electronic mail, posting of the
Product on a website or page, and/or providing to a third party a link to the Product, is prohibited by law and will result in prosecution. The information contained in the Product is
intended solely for the recipient and may not be further distributed by the recipient to any third party. Where included in this report, MSCI sourced information is the exclusive
property of Morgan Stanley Capital International Inc. (MSCI). Without prior written permission of MSCI, this information and any other MSCI intellectual property may not be
reproduced, redisseminated or used to create any financial products, including any indices. This information is provided on an "as is" basis. The user assumes the entire risk of
any use made of this information. MSCI, its affiliates and any third party involved in, or related to, computing or compiling the information hereby expressly disclaim all
warranties of originality, accuracy, completeness, merchantability or fitness for a particular purpose with respect to any of this information. Without limiting any of the foregoing,
in no event shall MSCI, any of its affiliates or any third party involved in, or related to, computing or compiling the information have any liability for any damages of any kind.
MSCI, Morgan Stanley Capital International and the MSCI indexes are services marks of MSCI and its affiliates. Part of this product may contain Sustainalytics proprietary
information that may not be reproduced, used, disseminated, modified nor published in any manner without the express written consent of Sustainalytics. Sustainalytics, its
affiliates and any third party involved in, or related to, computing or compiling the information hereby expressly disclaim all warranties of originality, accuracy, completeness,
merchantability or fitness for a particular purpose with respect to any of this information. Any information attributed to Sustainalytics is provided solely for informational purposes
and on its own should not be considered an offer to buy or sell a security. Neither Sustainalytics nor all its third-party suppliers provide investment advice (as defined in the
applicable jurisdiction) or any other form of (financial) advice. The information is provided “as is” and, therefore Sustainalytics assumes no responsibility for errors or omissions.
Sustainalytics cannot be held liable for damage arising from the use of this product or information contained herein in any manner whatsoever. The Firm accepts no liability
whatsoever for the actions of third parties. The Product may provide the addresses of, or contain hyperlinks to, websites. Except to the extent to which the Product refers to
website material of the Firm, the Firm has not reviewed the linked site. Equally, except to the extent to which the Product refers to website material of the Firm, the Firm takes no
responsibility for, and makes no representations or warranties whatsoever as to, the data and information contained therein. Such address or hyperlink (including addresses or
hyperlinks to website material of the Firm) is provided solely for your convenience and information and the content of the linked site does not in any way form part of this
16document. Accessing such website or following such link through the Product or the website of the Firm shall be at your own risk and the Firm shall have no liability arising out
of, or in connection with, any such referenced website.
ADDITIONAL INFORMATION IS AVAILABLE UPON REQUEST
17You can also read