OMNIBUS PUBLIC OPINION SURVEY, FREBRUARY 2018 - Methodological report - Wilson Center
←
→
Page content transcription
If your browser does not render page correctly, please read the page content below
Methodological Report

[OMNIBUS PUBLIC OPINION SURVEY,
FREBRUARY 2018]
Methodological report
Contenido

1.     Background ................................................................................................................................. 3
2.     Target population........................................................................................................................ 3
3.     Interviewing mode ...................................................................................................................... 3
4.     Brief summary of field incidents .................................................................................................. 3
5.     First stage: selection of PSUs ....................................................................................................... 3
6.     Second stage: area segments sampling ....................................................................................... 8
7.     Third stage: Sampling of housing units ...................................................................................... 12
8.     Fourth stage: Respondent selection .......................................................................................... 13
9.     Sample size ............................................................................................................................... 14
10. Design effect ............................................................................................................................. 15
11. Nonresponse ............................................................................................................................. 15
12. Response rates .......................................................................................................................... 17
13. Fieldwork .................................................................................................................................. 18
14. Data processing......................................................................................................................... 20
15. Contact information .................................................................................................................. 22
1. Background
This report includes information regarding the methodology of the February edition of our quarterly
omnibus public opinion survey 2018.
2. Target population
Mexican adults enrolled as voters, 18 years of age or older, who reside in housing units within the
national territory.
3. Interviewing mode
Face-to face interviews with structured questionnaires administered by trained interviewers through
personal electronic devices (tablet).
4. Brief summary of field incidents
Due to security reasons we stopped working in sección electoral 2391 in Guerrero.
People in sección electoral 200 in Baja California Sur did not trust our interviewers and were
reluctant to participate in the study.
Police officers did not allow interviewers to work in sección electoral 939.
Sampling design
In order to achieve a representative sample, Buendía & Laredo used a multistage area probability
sample design. The selection of each respondent requires a four step sampling process sketched in
Tables 1, 5, 6, 7 and described under the following headlines.
5. First stage: selection of PSUs
Table 1: First stage
Stage First
Sampling units Sección electoral
Catálogo de Información Geoelectoral
(EDMSLM, INE).
Estadísticos de la Lista Nominal por sección
electoral (October, 2017).
Sampling frame
Cómputos distritales y de circunscripción
plurinominal de la elección de Diputados
Federales de 2015 por ambos principios (INE,
July, 2015).Stratified probability proportional to size
Selection method
systematic sampling
Sampling units
The primary sampling units or (PSUs) are geographical areas termed electoral sections (secciones
electorales). All land area in the country is divided into electoral sections, which constitute the basic
territorial unit of single-member electoral districts for the registering of citizens to enroll as voters (lista
nominal).
The most updated information (October, 2017) shows that national territory is divided into 68,361
electoral sections whose geographical distribution is depicted in Table 2.
Table 2: Geographical distribution of PSUs (October, 2017)
State PSUs Percent
Aguascalientes 602 0.88
Baja California 1,949 2.85
Baja California Sur 486 0.71
Campeche 527 0.77
Chiapas 2,041 2.99
Chihuahua 3,208 4.69
Coahuila 1,688 2.47
Colima 371 0.54
Ciudad de México 5,536 8.1
Durango 1,419 2.08
Guanajuato 3,141 4.59
Guerrero 2,749 4.02
Hidalgo 1,782 2.61
Jalisco 3,570 5.22
Estado de México 6,458 9.45
Michoacán 2,692 3.94
Morelos 907 1.33
Nayarit 960 1.4
Nuevo León 2,666 3.9
Oaxaca 2,450 3.58
Puebla 2,656 3.89
Querétaro 860 1.26
Quintana Roo 940 1.37
San Luis Potosí 1,814 2.65
Sinaloa 3,804 5.56
Sonora 1,533 2.24
Tabasco 1,131 1.65Tamaulipas 2,009 2.94
Tlaxcala 608 0.89
Veracruz 4,815 7.04
Yucatán 1,121 1.64
Zacatecas 1,868 2.73
Total 68,361 100
Sampling frame
The sampling frame is the listing of electoral sections. The sampling frame is based on electoral sections
since the lista nominal is the most updated and complete data readily available. The most recent
release date was October 2017. Table 3 depicts the percentage of people living in their correct electoral
section by state according to de Verificación Nacional Muestral (INE, 2015).
Table 3: People living in the correct electoral section according to the Lista Nominal
State code State Percentage of the
population
National Average 86.1
1 Aguascalientes 81.5
2 Baja California 77
3 Baja California Sur 80.2
4 Campeche 89.5
5 Coahuila 80.8
6 Colima 79.7
7 Chiapas 89.6
8 Chihuahua 80.9
9 Distrito Federal 88.8
10 Durango 84.6
11 Guanajuato 84.7
12 Guerrero 86.5
13 Hidalgo 89.5
14 Jalisco 81.8
15 México 89.1
16 Michoacán 85.4
17 Morelos 86.2
18 Nayarit 79.6
19 Nuevo León 83.6
20 Oaxaca 89
21 Puebla 88.1
22 Querétaro 88.2
23 Quintana Roo 84.5
24 San Luis Potosí 89.3
25 Sinaloa 83.3
26 Sonora 83.4
27 Tabasco 87.228 Tamaulipas 83.4
29 Tlaxcala 91.5
30 Veracruz 88.7
31 Yucatán 86.4
32 Zacatecas 84
Information from the Geoelectoral Information Catalog, acquired in October 2017 from the National
Electoral Institute, augmented with the following sources was assembled to create the sampling frame:
Catálogo de Información Geoelectoral (EDMSLM, INE)
Estadísticos de la Lista Nominal por sección electoral
Cómputos distritales y de circunscripción plurinominal de la elección de Diputados Federales
de 2015 por ambos principios (INE, July 2015).
Selection method
Stratification Each PSU in the sampling frame is assigned to a nonoverlapping sample stratum based
on the following variables:
1. Region of the country
2. Urban/ not urban status
Strata based on region encompass five geographical regions (multi-member districts or
circunscripciones). These regions are used to assign representatives with a Proportional
Representation criteria and have a very similar number of registered voters. The main purpose of this
stratification is to increase the regional dispersion of the sample.
Table 4: Geographical regions (Circunscripciones)
Circunscripción States
One Baja California, Baja California Sur, Chihuahua, Durango,
Jalisco, Nayarit, Sinaloa, Sonora
Two Aguascalientes, Coahuila, Guanajuato, Nuevo León,
Querétaro, San Luis Potosí, Tamaulipas, Zacatecas
Three Campeche, Chiapas, Oaxaca, Quintana Roo, Tabasco,
Veracruz, Yucatán
Four Ciudad de México, Guerrero, Morelos, Puebla, Tlaxcala
Five Colima, Hidalgo, Estado de México, MichoacánFigure 1: Regional strata (Circunscripciones electorales) Strata are also defined according to the state of urbanity of the electoral section (Urban/Not Urban). The purpose of this stratification is to reduce the variance of estimates that may be statistically related with the urbanity of electoral sections. Urban section: It is located in an urban locality and it is formed by well-defined blocks. Urban sections have street names and a series of public services such as tap water and electricity. Usually both street names and public services are officially recognized by the local authorities. These sections are graphically represented on the sectional urban map. Rural section: A rural electoral section is constituted by one or many rural localities that on their own cannot form an electoral section. These sections are characterized by the preeminence of open places that are dedicated to primary economic sectors. The public services in these localities are either limited or inexistent. We collapse rural and mixed section together to form strata. Mixed section: These sections are geographical areas that are divided by a series of blocks that form part of an urban locality; however, one or many rural localities are also present. Due to the fact that these sections are a combination of the characteristics described in urban and rural sections, it is common to witness an interaction of spaces dedicated to primary economic sectors and housing units. We collapse rural and mixed section together to form strata. Sampling method Within each stratum, electoral sections are selected conducting a systematic sampling with probability proportional to its size (PPS). The size of electoral sections is the number of
registered voters (lista nominal). As the number of registered voters varies from one electoral section
to other, PPS enables selecting individuals with equal chances controlling the sample size so it is the
same across other hypothetical samples. This is done by changing the first and further selection
chances in such a way that when multiplied together, the probability is equal for every element. We
combine PPS with a systematic sampling approach.
6. Second stage: area segments sampling
Table 5: Second stage
Stage Second
Sampling units In urban electoral sections, blocks are our
second-stage sampling units (SSUs). In
rural and mixed sections, the SSUs are
clusters of homes.
Sampling frame Catálogo de Manzanas del INE (AC-01R,
INE).
Estadísticos de la Lista Nominal por
manzana (INE).
Planos por sección individual (INE).
Selection method Systematic sampling method with
probability proportional to size.
Sampling units
In urban electoral sections, blocks are our second-stage sampling units (SSUs). A block is defined as a
geographic space delimited by streets or avenues. In rural and mixed sections, the SSUs are clusters
of homes.
Sampling frame
SSUs are identified and assigned to interviewers through cartographic maps extracted from
the sources below:
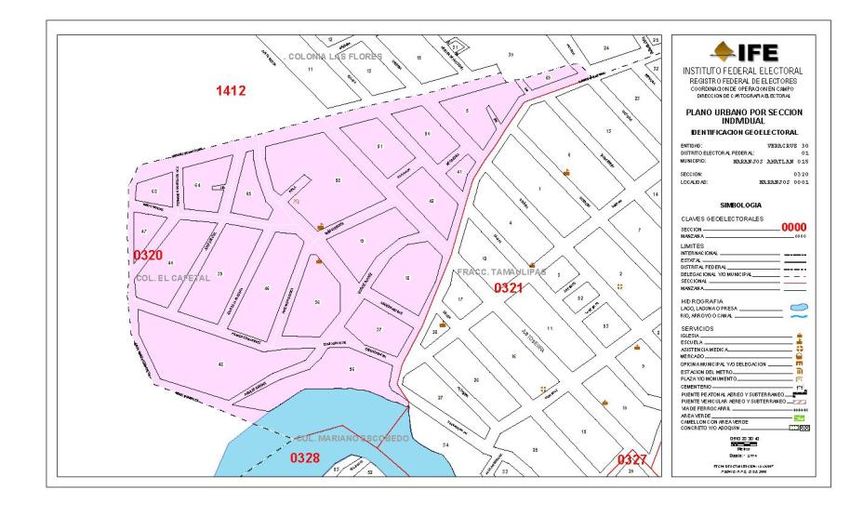
Plano por sección individual urbano (Source: INE): This product represents the blocks and physical
features of a single electoral section. The level of detail in each map allows identifying with
more precision the addresses of respondents.Figure 2: Individual section representation
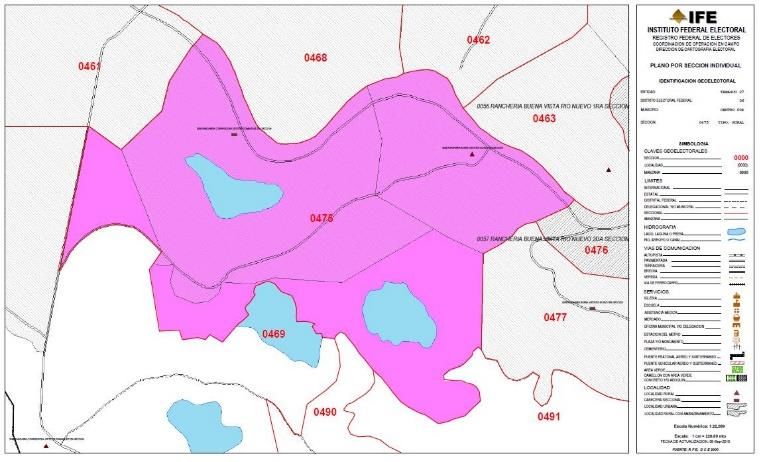
To identify and analyze rural sections, the following product is used:
Plano por sección individual rural/mixto (Source: INE): These maps contain the rural and mixed
sections individually. There are certain items exclusive of rural sections such as codes and names of
the rural cities, head of section, main road links, physical and cultural features, borders and various
codes.
Figure 3: Individual section representation (Rural section)Selection method
Within each sampled PSU, two blocks are selected through a systematic sampling method with
probability proportional to size from the Catálogo de Manzanas (INE).
In rural PSUs, the human settlement is divided into quadrants using boundaries such as roads, rail-road
tracks, rivers, or other reference relatively fixed and easily identified. Two “main” quadrants are
selected in which 5 interviews will be conducted; the rest of the interviews will be conducted in the
quadrants left (two, each). We propose to number the quadrants starting with the upper-left quadrant
and continuing clockwise. Then, select the main quadrants (in which 5 interviews will be conducted)
depending on the questionnaire number. If the last digit of the questionnaire number is even, then the
selected quadrants will be 2 and 4; on the other hand, if we have an odd number as last digit, then the
selected quadrants will be 1 and 3. Human settlements in selected areas (SSUs) are identified and
assigned to interviewers through the “Ubica tu casilla” Google-IFE app, which offers a
map/satellite/terrain view of all electoral sections in the country. Housing units that are widely
separated from others may be left out of the eligible units.
After stage one and two of selecting PSUs and SSU, the original sample was the following:
Number
State N° of seccion Municipality name
of SSUs
Aguascalientes 146 AGUASCALIENTES 2
Baja California 105 ENSENADA 2
Baja California 194 ENSENADA 2
Baja California 1290 PLAYAS DE ROSARITO 2
Baja California Sur 200 LA PAZ 2
Campeche 4 CAMPECHE 2
Coahuila 909 SALTILLO 2
Coahuila 1509 ZARAGOZA 2
Colima 259 MANZANILLO 2
Chiapas 405 CHIAPA DE CORZO 2
Chiapas 828 OCOSINGO 2
Chiapas 1518 TONALA 2
Chiapas 1102 SALTO DE AGUA 2
Chihuahua 203 CAMARGO 2
Chihuahua 1886 JUAREZ 2
Distrito Federal 596 COYOACAN 2
Distrito Federal 657 COYOACAN 2
Distrito Federal 878 GUSTAVO A MADERO 2
Distrito Federal 1584 GUSTAVO A. MADERO 2
Distrito Federal 1648 GUSTAVO A. MADERO 2
Distrito Federal 1724 IZTACALCO 2
Distrito Federal 3977 TLALPAN 2
Distrito Federal 5238 VENUSTIANO CARRANZA 2
Durango 762 LERDO 2
Durango 969 PANUCO DE CORONADO 2
Guanajuato 716 CORTAZAR 2Guanajuato 1000 IRAPUATO 2
Guanajuato 1854 LEON 2
Guanajuato 2377 SAN FELIPE 2
Guanajuato 2531 SAN JOSE ITURBIDE 2
Guerrero 110 ACAPULCO DE JUAREZ 2
Guerrero 2391 TELOLOAPAN 2
Guerrero 1520 IGUALA DE LA INDEPEN 2
Hidalgo 1362 TIZAYUCA 2
Hidalgo 1502 TULANCINGO DE BRAVO 2
Hidalgo 1682 ZIMAPAN 2
Jalisco 593 GUADALAJARA 2
Jalisco 1466 GUADALAJARA 2
Jalisco 1815 MAZAMITLA 2
Jalisco 2025 EL SALTO 2
Jalisco 2164 SAYULA 2
Jalisco 3109 ZAPOPAN 2
Jalisco 3257 ZAPOTILTIC 2
Estado de México 130 ALMOLOYA DE JUAREZ 2
Estado de México 272 ATIZAPAN DE ZARAGOZA 2
Estado de México 523 COACALCO DE BERRIOZA 2
Estado de México 637 COATEPEC HARINAS 2
Estado de México 703 CUAUTITLAN IZCALLI 2
Estado de México 1254 NEZAHUALCOYOTL 2
Estado de México 1778 ECATEPEC DE MORELOS 2
Estado de México 2001 HUIXQUILUCAN 2
Estado de México 4003 LA PAZ 2
Estado de México 4666 TEXCOCO 2
Estado de México 5515 TULTITLAN 2
Estado de México 5605 TULTITLAN 2
Michoacán 2097 TURICATO 2
Michoacán 607 HUETAMO 2
Michoacán 2569 ZINAPECUARO 2
Michoacán 2581 ZITACUARO 2
Morelos 169 CUAUTLA 2
Nayarit 916 TEPIC 2
Nuevo León 562 GUADALUPE 2
Nuevo León 608 GUADALUPE 2
Nuevo León 703 GUADALUPE 2
Nuevo León 864 LINARES 2
Nuevo León 2442 APODACA NUEVO LEON 2
Oaxaca 3 ACATLAN DE PEREZ FIG 2
Oaxaca 1503 SAN PEDRO MIXTEPEC 2
Oaxaca 2308 VILLA DE TAMAZULAPAM 2
Puebla 326 CUAUTLANCINGO 2
Puebla 856 OCOTEPEC 2
Puebla 1661 SAN ANDRES CHOLULA 2
Puebla 1814 SAN PEDRO CHOLULA 2
Puebla 1866 SAN SALVADOR EL VERD 2
Querétaro 203 EL MARQUES 2Querétaro 308 QUERETARO 2
Querétaro 356 QUERETARO 2
Querétaro 561 SAN JOAQUIN 2
Quintana Roo 872 BENITO JUAREZ 2
San Luis Potosí 610 MOCTEZUMA 2
San Luis Potosí 955 SAN LUIS POTOSI 2
San Luis Potosí 1307 SOLEDAD DE GRACIANO 2
Sinaloa 903 CULIACAN 2
Sinaloa 925 CULIACAN 2
Sinaloa 1574 CULIACAN 2
Sonora 341 HERMOSILLO 2
Sonora 880 CAJEME 2
Tabasco 416 CENTRO 2
Tabasco 786 JALAPA 2
Tlaxcala 160 SAN FRANCISCO TETLAN 2
Tlaxcala 329 NATIVITAS 2
Veracruz 1340 CHICONQUIACO 2
Veracruz 2426 MINATITLAN 2
Veracruz 2957 PAPANTLA 2
Veracruz 3374 SAN ANDRES TUXTLA 2
Veracruz 3932 TIHUATLAN 2
Veracruz 4262 VERACRUZ 2
Yucatán 939 TIZIMIN 2
Yucatán 1016 VALLADOLID 2
Zacatecas 1115 PINOS 2
7. Third stage: Sampling of housing units
Table 6: Third stage
Stage Third
Sampling units Housing units represent our sampling units
Sampling frame Household cluster within the block selected.
Selection method Random start systematic method
Sampling units
Housing units represent our sampling units. A housing unit is defined as a house, apartment, mobile
home, group of rooms, or single room that is occupied (or, if vacant, is intended for occupancy) as
separate living quarters. Separate living quarters are those in which the occupants live and eat
separately from any other persons in the building and which have direct access from the outside of the
building or through a common hall.Sampling frame
Housing units may not be easily seen when walls or other barriers are present. For example, housing
units in multi-units structures are difficult to identify. The presence of mail boxes, utility meters (water,
gas or electricity) and multiple entrances are used as observational clues on the presence of multiple
units. However, hidden entrances, gated communities, or locked buildings may be missed.
Selection method
Once blocks in urban electoral sections have been identified and selected, housing units per block are
selected using a systematic method by means of a spiral method and clockwise walking. Each block is
covered starting by the northeast corner using a sampling interval of 3 housing units, while the blocks
are walked clockwise. Once a questionnaire is completed, the interviewer moves to the next side of
the block; therefore only one interview is conducted on each side of the block.
To complete five interviews per SSU, interviewers move to an adjacent block using the spiral method.
In multi-story buildings the selection process of households is done in the same way as regular
households. The maximum number of interviews to be applied inside the same building is four.
However, this is only when the building occupies a whole block. When the building is located on one
side of the block, the maximum number of interviews to be applied inside the building is one. After
getting the interview, the interviewer will not only have to move from the building but from that side
of the block as well.
8. Fourth stage: Respondent selection
Table 7: Fourth stage
Stage Fourth
Sampling units The sampling units are the individuals in the
previously selected households.
Sampling frame Eligible household inhabitants
Selection method Random selection
Sampling units
The sampling units are the individuals in the previously selected households.
Sampling frame
Each sample housing unit is then contacted in person by an interviewer. Within each cooperating
sample household, the interviewer conducts a short screening interview with a knowledgeable adult
to determine if household members meet the study eligibility criteria. A household includes all the
persons that occupy a housing unit. The occupants may be a single family, one person living alone, twoor more families living together, or any other group of related or unrelated persons who share living
arrangements.
Selection method
Since the tablet can be programmed to pick a respondent from the total pool of house hold inhabitants,
the interviewer simply asks to speak to the adult selected by the program. This turns previous pseudo-
random procedures into a fully random selection within the household.
9. Sample size
100 electoral sections or PSUs were drawn from the sample frame and 10 interviews were conducted
in each PSU.
Strata allocation
Sample size is allocated in each stratum proportional to the size of the lista nominal. Sample allocation
is shown on table 8:
Table 8: Sample allocation
Number of
Region
Urbanity Population size PSUs
(circunscripción)
selected
1 Not urban 4,383,218 5
Urban 13,488,319 16
2 Not urban 5,632,859 6
Urban 12,630,246 15
3 Not urban 8,007,803 9
Urban 8,826,897 10
4 Not urban 3,564,950 4
Urban 13,060,280 15
5 Not urban 5,436,157 6
Urban 12,028,309 14
Total 87,059,038 10010. Design effect
The design effects of survey estimates can be used as tools for measuring simple efficiency and for
survey planning. Typically, cluster sampling causes an increase in the variance of estimates because
variance within cluster is generally lower than the variance of the population. This event tends to
happen due to the fact that people living close to each other in certain zones share some life conditions
(i.e. cost of rent, quality of services in a neighborhood). The “design effect”, better known as deff, is
then used to summarize the effect of cluster sampling in the precision of the estimates.
Therefore, the deff can be defined as the ratio of the variance of an estimate under the complex sample
design to the variance of the same estimate that would apply with a simple random sample (SRS) of
the same size. In other words, it can be interpreted as the number of units collected by means of cluster
sampling that are equivalent to a unity selected by means of SRS. Approximately, the deff of cluster
sampling can be expressed as:
DEFF = 1 + ρ(K - 1)
K is the number of elements selected in a cluster, and ρ the coefficient of the correlation within
clusters. For example, the deff for each answer to the question “Please tell me if you have a very
favorable, somewhat favorable, somewhat unfavorable or very unfavorable opinion of the United
States?” are the following:
Prop. Std. Lower Upper Margin of deff
error limit limit error
Very favorable 12.6 1.2 10.2 15.1 2.4 1.4
Somewhat
26.4 1.7 23.1 29.8 3.3 1.4
favorable
Somewhat
25.5 2 21.5 29.5 4 2.1
unfavorable
Very unfavorable 30.8 1.8 27.3 34.4 3.5 1.5
Does not know/
4.6 0.6 3.4 5.8 1.2 0.8
No answer
11. NonresponseItem nonresponse
Interviewers are instructed to accept “Don’t know” and “Refused” without further probing to avoid
introducing a bias in the answers. Interviewers are trained to distinguish the difference between both
response categories. While the “refused” category is for respondents who explicitly do not want to
give an answer to a specific question (for instance, when they do not feel comfortable with a topic),
the “don’t know” category is for respondents who cannot answer the question due to lack of
information or for respondents who have an evident cognitive difficulty to respond it.
Unit nonresponse
First stage
In case a PSU is not available to conduct interviews, due to security reasons or otherwise, a new PSU
with the same stratum characteristics and probability of selection, is drawn from an independent
sample.
Table 10 depicts a list of substitutions implemented in this study:
Table 10: Substitutions
Original Original PSU Replacement state Replacement
state PSU
3 200 2 972
7 1102 20 449
31 939 20 918
12 2391 12 379
7 828 7 1461
16 2097 16 51
Second stage
A new block is selected from an independent sample within the PSU.
Third stage
In cases in which nobody opens the door of the selected household, the interviewer has to return later.
One attempt will be made to interview the selected respondent before another household is
substituted. In case no one opens the door again, the household will have to be replaced with the one
to the right. If none answers the door of the new household or if the family members refuse to answer
the interview, the interviewer will have to move to the following household. If the interview cannot be
completed at the new household, the interviewer will move again and so on.
Fourth stage
If the selected respondent were to be absent or unavailable at the time, one additional attempt to
interview the selected person will be made. If the respondent refuses to answer or if he or she is absentor unavailable once again, the interviewer will have to register this contact and proceed to replace the
respondent with another one of the same gender and in the same age group.
12. Response rates
Regarding outcome rates, Buendía & Laredo adheres to the guidelines established by the American
Association of Public Opinion Research. Reasons for non-response will be documented by category
with response rates reported by geographic location. We will provide 4 different measures of outcome
rates: 1) Response Rates; 2) Cooperation Rates; 3) Refusal Rates and 4) Contact Rates.
Final disposition Code
Complete interviews I
Partial Interview P
Refusal and Break off R
Non-contact NC
Other O
Unknown if household/occupied UH
Unknown, other UO
Response rate
I
=
(I + P) + (R + NC + O) + (UH + UO)
1000
=
(1000 + 0) + (213 + 687 + 0) + (4 + 0)
= 52.5%
Cooperation rate
I
=
(I + P) + R + O
1000
=
(1000 + 0) + 213 + 0
= 82.4%
Refusal rate
R
=
(I + P) + (R + NC + O) + (UH + UO)
213
=
(1000 + 0) + (213 + 687 + 0) + (4 + 0)
= 11.2%Contact rate
(I + P) + R + O
=
(I + P) + (R + NC + O) + (UH + UO)
(1000 + 0) + 213 + 0
=
(1000 + 0) + (213 + 687 + 0) + (4 + 0)
= 63.7%
A summary of the different disposition codes is presented on the table below:
Code Status Frequencies
1 Interviews 1,000
1.1 Complete 1,000
1.2 Partial 0
2 Eligible, not interviewed 900
2.1 Refusals 213
2.111 Household refusals 162
2.112 Refusals with known respondent 51
2.12 Breakoffs 0
2.2 No contact 687
2.23 Unable to enter the building 3
2.24 No one at home 340
2.25 Unavailable respondent 344
2.3 Other 0
2.31 Dead 0
2.32 Physically or mentally unable 0
2.33 Language problem 0
2.36 Other 0
3 Unknown eligibility, not interviewed 4
3.1 Does not know if household 0
3.17 Unsafe/Unable to reach area 4
3.2 Does not know if respondent is eligible 0
3.9 Other 0
4 Not eligible 12
4.5 Not a household 2
4.6 Vacant household 3
4.7 No eligible respondent 0
4.9 Other 7
13. Fieldwork
Fieldwork personnel
The number of interviewers used was 76. Their characteristics were the following:Table 11: Fieldwork personnel characteristics
Schooling
Highschool
(complete or 86.8%
incomplete)
University
(complete or 13.2%
incomplete)
Total 100%
Gender
Men 55.3%
Women 44.7%
Total 100%
Age
18 to 25 42.1%
26 to 35 31.6%
36 to 45 15.8%
46 or more 10.5%
Total 100%
Scheduling and assignment of interviews
Interviews had the following time and day distribution:
Start Time Number of %
interviews
8:00 - 8:59 15 1.5
9:00 - 9:59 97 9.7
10:00 - 10:59 137 13.7
11:00 - 11:59 112 11.2
12:00 - 12:59 75 7.5
13:00 - 13:59 102 10.2
14:00 - 14:59 101 10.1
15:00 - 15:59 112 11.2
16:00 - 16:59 84 8.4
17:00 - 17:59 79 7.9
18:00 - 18:59 64 6.4
19:00 - 20:59 17 1.7
20:00 - 20:59 5 .5
Total 1,000 100Date Number of interviews %
02/16/2018 69 6.9
02/17/2018 118 11.8
02/18/2018 119 11.9
02/19/2018 264 26.4
02/20/2018 288 28.8
02/21/2018 130 13
02/22/2018 12 1.2
Total 1,000 100
Selection and training of interviewers
The interviewers were chosen among our full-time most experienced personnel. All interviewers
received full training before they begin conducting actual interviews. Training consisted on helping
interviewers achieve good face-to-face interviewing skills. First, our fieldwork office focuses on
teaching the interviewers some basic techniques. During this process, interviewers learned how to
make contact, how to deal with reluctant respondents, how to conduct interviews in a proper and
respectful manner and how to avoid influencing responses.
Secondly, practice interviews were conducted inside the office. The goal is to prepare the interviewers
for all the possible scenarios they may encounter when conducting real interviews. Finally, one of the
persons involved with the project met with both supervisors and interviewers to discuss each of the
questions.
Methods for ensuring quality control in the field
All questionnaires were submitted to a strict monitoring process during and after fieldwork. In
addition, each team of interviewers (3) had supervisor whose main responsibility will be to revise in
situ the interviews conducted. Supervisions, whether verified in situ, or back checked (once the
interview was finished), had the following distribution:
Type %
In situ 25.3
Back checked 27.8
No supervision 46.9
14. Data processing
Adjustments
The weighting variable incorporates the marginal frequencies of the sociodemographic distributions
adjustment factor and the sampling selection weight with a raking algorithm. This algorithm performs
iterative proportional fitting, or raking, to produce a set of calibrated survey weights such that thesample weighted totals of control variables match the known population totals. In this case, sex, age,
education, labor and strata.
The adjustment of the weights is performed by adjusting each of the given control margins sequentially
until convergence is achieved. In other words, for a given control variable (for example, gender), the
total sizes of subpopulations are estimated, and the weights in separate categories (males, females)
are multiplied by a group-specific factor (ratio of the known population total to the estimated total) so
that the new set of weights produces total estimates conforming to the known totals. With the variable
between 0 and 1, the weights are then multiplied by an expansion factor, so they reflect an
approximate count of the total population.
According to the 2015 “Encuesta intercensal” gathered by INEGI. The total population of 18 years and
more is 84,327,100.
The adjusted and unweighted percentages of age and gender are presented below:
Age-sex groups weighted unweighted
M-18-29 14.5 9.4
F-18-29 14.7 16.3
M-30-39 10.3 7.2
F-30-39 10.9 13.8
M-40-49 9.1 8.4
F-40-49 9.9 11.5
M-50-59 6.6 6.3
F-50-59 7.4 9.4
M-60 and more 7.6 9.7
F-60 and more 8.9 8.0
Total 100 100
Additionally, we include a weighting variable that incorporates census data about the education and occupation
distribution, labeled “Weight_labor_edu”. Weighted and unweighted frequencies of labor and education appear as
follows:
Weighted and unweighted frequencies of labor and education appear as follows:
Education weighted unweighted
Elementary-middle 59.4 59.1
school
High school 20.3 23.1
University 20.1 17.7
NR 0.2 1
Total 100 100Labor weighted unweighted
Worker 54.3 54.6
Students 5.3 2.3
Housekeepers 26.0 30.7
Other (not working) 14.4 12.4
Total 100 100
15. Contact information
For more information, please contact us at contacto@buendíaylaredo.com or at +52 (55) 52 50 59
08. Twitter: @buendiaylaredoYou can also read