On the Horizon: State of Transportation Planning 2016
←
→
Page content transcription
If your browser does not render page correctly, please read the page content below
On the Horizon:
State of Transportation Planning 2016

 1
Introduction

April 2016

Dear members and friends of the Transportation Planning Division (TPD) of the
American Planning Association:

We hope you will enjoy the 2016 edition of TPD’s State of Transportation Planning:
On the Horizon. Since the last edition of the State of Transportation Planning in 2013,
planners have had to become familiar with new transportation technology and new
planning concepts. This edition features articles on connected vehicles, high speed
rail, freight policy, integrated fare payment systems, and many others. Many thanks to
the authors and review team.

For good planning,

Jo Laurie Penrose, AICP
Publication manager

                                             ON THE HORIZON | SOTP 2016
Table of Contents
Multimodal Transportation
Rail-Trails as Commuter Conduits 1
Complete Networks Approach to Transportation Planning in Bellingham,
Washington 5
Woonerfs: Living Streets for all Users 10
Environment
Boulder Greenhouse Gas Reduction in Transportation 14
Transportation Energy Beyond Fossil Fuels: Improving Vehicle Energy Intensity 23
Freight and Mobility
Integrating Freight into Livable Communities 28
Urban and Port Planning: An Integrated Effort at All Levels 34
The Evolving World of Freight and Goods Movement:
Implications for Transportation Planning and Community Design 38
Transit and Rail
Filling in the Gaps: Bridging Private Technology and Public Transit 45
Can Next-Generation Payment Systems Transform the Way We Ride While
Driving Down the Cost of Service? 49
The Case for “Fair” Fares 56
High-Performance Passenger Rail: The View from Virginia 64
Technology, Management, and Assessment
Automated Vehicles: Transformation of the Transportation Industry 69
The Future of Parking 72
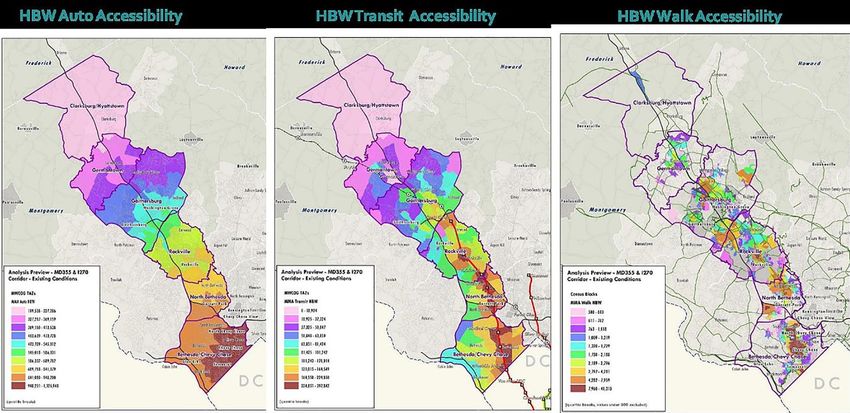
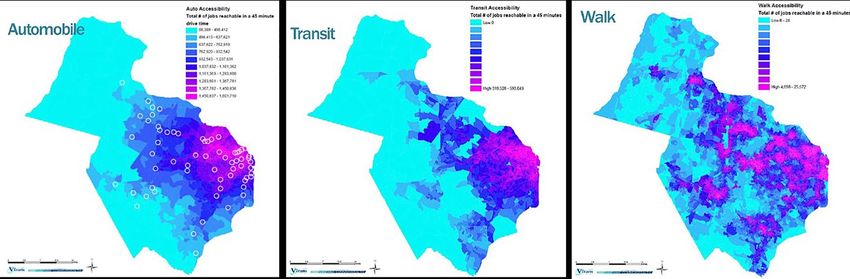
New Measures of Success: Using Accessibility to Measure Transportation
System Performance 77
ON THE HORIZON | SOTP 2016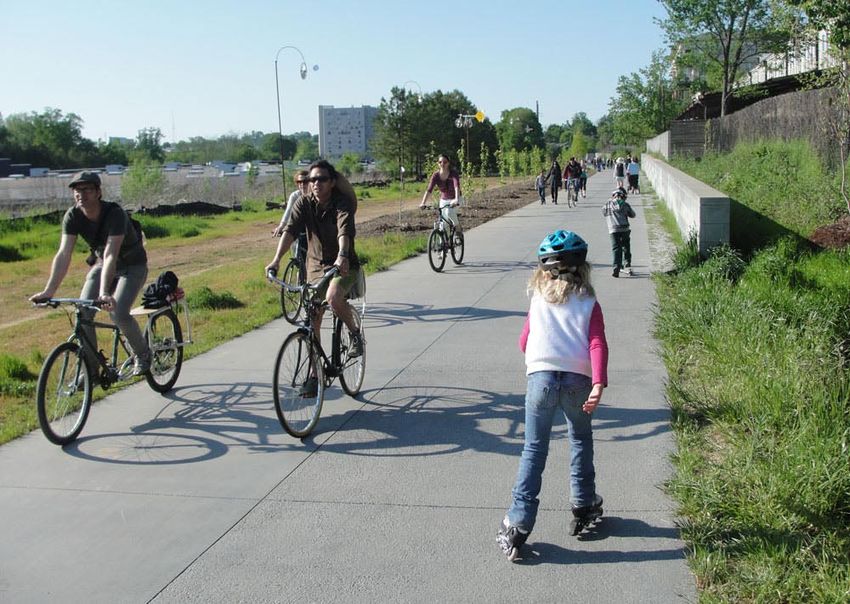
MULTIMODAL TRANSPORTATION

Rail-Trails as Commuter Conduits
Randall J. Rook, AICP

Transitions in the railroad industry over the past several decades have created
opportunities for their reuse that allow Americans to lower their carbon footprint
while pursuing healthy lifestyles. Pruning of the US freight rail network has occurred
due to factors such as shifts from intermodal competition, overseas relocation of
manufacturing, productivity gains and rail carrier mergers. The result is an over 40
percent route mile reduction of operating rail routes over the past century.

The 1983 addition of rail provisions to the National Trails Act enabled preservation
of abandonment-endangered rail corridors for trails and future rail restoration. Many
government entities acquired lines that had been abandoned and put up for sale for
potential rail restoration or transit use (railbanking), and often converted them to
trails in the interim and for longer term recreational or conservation use. The Surface
Transportation Board (STB) regulates railroads and has mechanisms to allow interim
public use (including trails) while corridors are in ownership transition, as long as the
rail carrier is relieved of liability. Not all cases undergo this interim stage, and title is
directly transferred through sale under the STB regulatory process. More than 1,900
rail trails presently extend over 22,000 miles in the US.

While trails are widely known for their recreational use, rail-trail conversions in
urban regions have created successful commuter routes in recent years, including use
as “first mile/last mile” transit feeders. With safety and liability concerns mitigated,
rails-with-trails installations have proved successful in shared corridors, and
presently number at least 88. Such trails include the Burlington (VT) Island Line Rail
Trail and the Oceanside (CA) Coastal Rail Trail.

In addition to the personal benefits of active transportation facilities, local economies
grow when new or existing businesses leverage trail locations. The environment
benefits to the extent that active modes can reduce the number of single-occupant
vehicles from congested roadways and lower greenhouse gas emissions. Regional
ecology benefits from connecting corridors to each other and to open spaces in
attractive networks.

Examples of commuter rail-trails abound nationwide, from Portland, OR
(Springwater Corridor) to Miami (South Dade Rail Trail). Two such valuable routes
that link suburban communities to the urban cores of Boston and Philadelphia
regions are highlighted here—the Minuteman Bikeway and the Schuylkill River Trail,
respectively. A description of the strictly urban Atlanta BeltLine follows.

1                                               ON THE HORIZON | SOTP 2016
MULTIMODAL TRANSPORTATION

Minuteman Bikeway
This ten-mile multi-use trail from Boston through its northwestern suburbs to Bedford
was railbanked by the Commonwealth of Massachusetts and completed in 1999. As
part of a regional trails network, future plans include an extension by incorporating
the Reformatory Branch Trail, which will extend its reach an additional four miles to
Concord. The Bikeway’s routing through the commercial centers of many suburban
towns provides significant economic benefits and averages over 5,000 daily users.
Connections to MBTA buses and the heavy-rail Red Line at Alewife Station enable
intermodal travel, by parking bikes at the station or bringing them on transit vehicles.

Schuylkill River Trail
Philadelphia’s 60-plus-mile Schuylkill River Trail parallels its namesake river
through suburban towns, including Conshohocken and Norristown, and Valley Forge
National Historic Park. It has been growing incrementally since its 1990 inception,
with the 27-mile Phoenixville segment serving as a popular commuter route. There
are approximately 2,800 daily trail users (including bikers, walkers, and runners),
and many utilize it for accessing work places in the city and suburban communities
along its route. Eventually the entire 130-mile (largely) former Pennsylvania Railroad
corridor will enable users to travel from Philadelphia to Pottsville.

As part of the region’s planned and growing 750-mile Circuit trail network, numerous
connections to other trails extend the Schuylkill River Trail’s reach. The ultimate
network connection will be to the developing Maine-to-Florida East Coast Greenway.
Transit connections are possible at various locations in the region, including use of
this trail as a rails-with-trails example in local transit agency SEPTA’s Norristown
Line Regional Rail corridor.

A business along the Schuylkill River Trail (left) and the Spring Mill Station (right). Photos by author.

2                                                        ON THE HORIZON | SOTP 2016
MULTIMODAL TRANSPORTATION

Cooperation between Philadelphia, suburban municipalities, SEPTA, and freight rail
carriers CSXT and NS has been essential for establishing a safe and contiguous route.
Most notably, the Schuylkill River Trail was recently named the best urban trail in
USA Today’s Readers’ Choice contest.

The Atlanta BeltLine
Known as the Emerald Necklace, this is a unique rail-trail system that is entirely
urban and circular in nature rather than following the hub and spoke pattern from
city to suburb. Originally serving to connect multiple rail carriers, it now ties multiple
parks and neighborhoods together. Transit is an important component of the trail
system and the regional transit system, as new intersecting MARTA stations and
service patterns have been developed. When fully built out, the new Atlanta Streetcar
will also link the BeltLine to downtown Atlanta. Since its inception, successful public
and private development and neighborhood revitalization have taken advantage
of what was conceived as a master’s thesis for transit use seventeen years ago. The
BeltLine has since been shepherded toward completion by state and city leaders.

In her book MetroGreen, Donna Erickson advocates consideration of non-motorized
travel corridor networks as integral parts of local transit systems, with Denver and
Calgary as examples. Such networks not only provide ecological rewards (especially
when trails link open spaces); their popularity has prompted retailers to analyze user
data when considering future locations. When combined with transit, a “systems”
approach promotes “creating a contiguous and integrated open space system that
takes advantage of both natural and constructed features.”

Forward-thinking transit agencies such as Philadelphia’s SEPTA are onboard with
this type of thinking. SEPTA, in conjunction with local MPO Delaware Valley
                                                    Regional Planning Commission,
                                                    recently released its Cycle-Transit
                                                    Plan, which promotes bicycle
                                                    use through recommending
                                                    additional storage at rail stations
                                                    and increased onboard capacity,
                                                    improved bike path-station
                                                    connections, and use of its own
                                                    railbanked corridors.

Bicyclists on the Eastside Trail. Source: Atlanta BeltLine, www.beltline.org

3                                                        ON THE HORIZON | SOTP 2016
MULTIMODAL TRANSPORTATION

Suggested Reading for Rail-Trails

http://www.railstotrails.org/rtc-offline.html
http://www.minutemanbikeway.org/
http://schuylkillrivertrail.com/
http://beltline.org/about/the-atlanta-beltline-project/atlanta-beltline-overview/

MetroGreen: Connecting Open Space in North American Cities, Donna Erickson, 2006.

America’s Rails With Trails: A Resource for Planners, Agencies and Advocates on Trails
Along Active Railroad Corridors, Rails-to-Trails Conservancy, 2013.

Randall Rook, AICP is a rail/transit planner and senior OCS engineer at AECOM
while completing a master’s degree in the Community and Regional Planning
program at Temple University. randall.rook@aecom.com.

4                                            ON THE HORIZON | SOTP 2016
MULTIMODAL TRANSPORTATION

Complete Networks Approach
to Transportation Planning in
Bellingham, Washington
Chris Comeau, AICP-CTP

Prior to the popular rise of the national "Complete Streets" movement, the City
of Bellingham, Washington expanded its citywide transportation planning to
focus on multiple modes. This included mode-shift goals, policies, and project
recommendations to accommodate pedestrians, bicyclists, and transit riders, as well
as vehicle drivers on all arterial streets. In 2004, Bellingham transportation planners
worked directly with Whatcom Transportation Authority (WTA) to establish a
Primary Transit Network and the Bicycle and Pedestrian Advisory Committee (BPAC)
to develop the 2006 Bellingham Transportation Element. In 2009, Bellingham created
a Multimodal Transportation Concurrency Program, which integrated level of service
(LOS) standards for sidewalks, bikeways, transit, and autos with various land use
contexts instead of relying solely on traditional auto-oriented LOS standards from the
Highway Capacity Manual.

Since then, Bellingham created comprehensive Primary Pedestrian and Bicycle
Networks detailed in both the 2012 Pedestrian Master Plan and 2014 Bicycle Master
Plan. Bellingham's progressive multimodal transportation planning has evolved into
a Complete Networks approach, which not only incorporates all of the principles
                                               of the Complete Streets movement,
                                               but also provides a Transportation
                                               Report on Annual Mobility (TRAM).
                                               TRAM is an annual progress report
                                               on the completeness of each modal
                                               network and how well the multimodal
                                               transportation system addressed
                                               new growth and development
                                               (concurrency) needs. TRAM also tracks
                                               current mode shares from Census data
                                               and suggests strategic adjustments
                                               aimed toward achieving the City's
                                               long-term transportation mode-shift
                                               goals to increase active and high-
                                               occupancy trips while decreasing
Bellingham’s Multimodal Transportation System. single-occupant trips.
Graphic by author.

5                                            ON THE HORIZON | SOTP 2016
MULTIMODAL TRANSPORTATION

Much of Bellingham's Complete Networks
approach involves building new sidewalks
and/or bikeways on the existing street
network or including sidewalks and/or
bikeways in new street designs constructed
by public or private interests. When designing
multimodal transportation improvements,
Bellingham transportation planners and
engineers always consider the safety and
mobility needs of all user groups, with
a priority emphasis placed on the most
vulnerable user groups, as illustrated here.

Bellingham's Pedestrian Master                Transportation Hierarchy. Institute of Transportation
Plan identifies a 266-mile Primary            Engineers (ITE) Complete Streets Council.
Pedestrian Network and 343
individual sidewalk and intersection
crossing projects. The Plan provides for a consistent and connected pedestrian
network, by recommending opportunities to remove barriers to safe walking and
identifying future projects and needs to improve safety and design. Bellingham's
Bicycle Master Plan identifies a 160-mile Primary Bicycle Network and 185 individual
bikeway projects that have been subject to significant analysis and prioritized
according to the needs of bicyclists. Both of these extensive multi-year planning
efforts were informed with broad community input and both are integrated with
Bellingham’s 70-mile off-street Greenways multi-use trail network.

Bellingham's motorized transportation system includes a citywide WTA Primary
Transit Network and a designated 48-mile Freight Truck Network within the citywide
265-mile arterial street network. WTA's Primary Transit Network in Bellingham is
focused on four major high-frequency transit corridors with public transit bus service
provided every 15 minutes in each direction connecting all of Bellingham's higher
density mixed-use Urban Village centers. Bellingham incentivizes infill development
in Urban Villages by acknowledging lower vehicle trip generation due to the mixed
use environment, WTA transit service proximity and frequency, and completeness of
pedestrian and bicycle networks, and has thereby reduced transportation impact fees
through an Urban Village TIF Reduction Program. Developers can choose to further
reduce transportation impact fees through the purchase of WTA bus passes for their
residents or employees.

Bellingham's commitment to completing pedestrian and bicycle infrastructure, as well
as promoting development in Urban Villages, helps the citywide Complete Networks
approach toward achieving long-term mode shift goals adopted in the transportation

6                                                  ON THE HORIZON | SOTP 2016
MULTIMODAL TRANSPORTATION

element of the comprehensive plan, which serve as targets to reduce the percentage of
total trips made by single-occupant vehicles while increasing the percentage of total
trips made by pedestrians, bicyclists, and transit riders.

Defining multimodal transportation networks and creating plans is an important
start, but without a commitment for implementation, plans just become "shelf art"
that gather dust without providing any measurable benefit to the community. The
Pedestrian Master Plan includes a prioritized list of 343 sidewalk and intersection
improvements and the Bicycle Master Plan includes a prioritized list of 181 bicycle
facility projects. The estimated cost to complete the long-term bicycle and pedestrian
networks is over $270 million dollars, which is far in excess of Bellingham’s ability
to construct with local funding alone. Bellingham's long-term plans for new arterial
streets is estimated to cost an additional $100 million.

In 2010, Bellingham voters approved a Transportation Benefit District (TBD) funded
by a two-tenths of one-percent sales tax collected within the City limits of Bellingham.
Funds are directed to arterial street resurfacing, non-motorized transportation
improvements, and supplemental WTA transit service provided through a contract

All maps by Chris Behee and Kate Newell, City of Bellingham.

7                                                    ON THE HORIZON | SOTP 2016
MULTIMODAL TRANSPORTATION

with the City. The TBD revenue is available for a 10-year period (2011-2020) and
is greatly assisting Bellingham to complete the citywide pedestrian and bicycle
networks identified in the Pedestrian and Bicycle Master Plans, support WTA’s efforts
to provide a robust urban transit system, and help achieve and sustain the City’s long-
term transportation mode-shift goals.

As an example, in 2015, Bellingham constructed 1.66 miles of new ADA-compliant
sidewalk and 6.5 miles of new bikeways throughout the City, much of it funded
with sales tax revenue from the TBD. As documented in the TRAM, connectivity is
improving each year on Bellingham's multimodal networks and this is generating
both increased interest and use by people who might not otherwise walk, bike, or ride
public transit for local trips.

Fortunately, Bellingham has become increasingly successful at maximizing efficiencies
and accomplishing multiple goals when committing funding to public infrastructure
improvements. Repairing water and sewer utilities under arterial streets creates
opportunities to add both bicycle and pedestrian improvements and, wherever
possible, arterial street resurfacing projects always include the installation of bicycle
lanes and ADA-compliant sidewalks and curb ramps. Bellingham has also been very

8                                             ON THE HORIZON | SOTP 2016
MULTIMODAL TRANSPORTATION

successful at leveraging local dollars for state and federal grant funding and creating
funding partnerships with the transit agency, universities, WSDOT, Whatcom County,
and private developers, making limited local funds go farther.

Bellingham is already a great place to live with many neighborhoods and community
activity centers connected with sidewalks, bike facilities, and multi-use recreational
trails. Bellingham is currently certified as a silver-level "Bicycle Friendly Community"
by the League of American Bicyclists, but has aspirations to achieve gold-level
status in the near future. Furthermore, WTA is one of the most successful public
transit agencies in Washington and provides excellent service for local residents.
Bellingham's commercial and industrial centers are easily accessible for customers
traveling by foot, bicycle, transit, private vehicle, as well as goods being shipped by
freight truck. Bellingham's Complete Networks approach to transportation planning
has set the city on a path to become one of the most livable communities in North
America for people of all ages and abilities.

Chris Comeau, AICP-CTP is the City of Bellingham's transportation planner with
more than 22 years of planning experience in Washington, Alaska, and Arizona. For
more information about Bellingham’s Complete Networks approach to multimodal
transportation planning, please contact him at ccomeau@cob.org or (360) 778-7946.

9                                             ON THE HORIZON | SOTP 2016
MULTIMODAL TRANSPORTATION

Woonerfs: Living Streets for all Users
Jonathan Paul, AICP

Communities throughout the US have begun to embrace a Complete Streets concept
aimed at improving the safety and mobility of all users of our transportation system.
Florida in particular, which consistently ranks as the most dangerous place in the
country for bicyclist and pedestrians, has taken a number of steps over the last several
years to begin a transition from principally moving people by motor vehicles to safely
accommodating all modes of travel. Starting in the mid-1980s with Dan Burden,
the Florida Department of Transportation’s (FDOT) first Bicycle and Pedestrian
Coordinator, the state began developing policies for Complete Streets and in the early
1990s became one of the first states to adopt a Complete Streets program.

The initial emphasis of the Complete Streets program was to ensure that design
policies at the state level included bicycle and pedestrian facilities in new and
widened roadways and where practical, during the reconstruction and repaving of
existing roadways. These design policies were included in technical design manuals
and have been implemented by the vast majority of local governments in Florida as
part of their Comprehensive Plans and Land Development Regulations.

Within urbanized areas, the concept of road diets (popularized by Dan Burden and
Peter Lagerway in their 1999 article “Road Diets: Fixing the Big Roads”) sought
to repurpose existing multi-lane roadways by reducing the number of lanes and
adding elements such as turn lanes, on-street parking, and bicycle lanes. Edgewater
Drive in the College Park neighborhood of Orlando, Nebraska Avenue in the Tampa
neighborhoods of Ybor City, Tampa Heights, and Seminole Heights, and Main Street
within downtown Gainesville are all examples of road diets in Florida. The roadways
were redesigned to calm traffic, accommodate bicyclists, and improve walkability.

Examples of “living streets” in Asheville, North Carolina (left) and Haarlem, Netherlands (right).
www.pedbikeimages.org. Dan Burden.

10                                                      ON THE HORIZON | SOTP 2016
MULTIMODAL TRANSPORTATION

Even with the multi-decade effort to provide bicycle and pedestrian facilities
on roadways, its inviting climate that allows residents and visitors to walk and
bicycle all year round, and the prevalence of bicycle and pedestrian facilities on
roadways throughout the state, Florida still leads the nation in the number of bicycle
and pedestrian fatalities per capita. Part of this stems from the roadway designs
themselves, the volumes of traffic on the roads, and the speeds at which vehicles
travel. Traffic engineers emphasize safety for motorists through wide travel lanes,
large clear recovery zones, clear sight triangles, pavement markings, and signage.
While bicycle lanes and sidewalks have been incorporated, the focus has still
principally been on moving motorists rather than all modes of transportation.

Local governments throughout Florida are addressing motorist, bicyclist, and
pedestrian safety through roadway design elements like narrower travel lane
widths, on-street parking, wider bicycle lanes, and lower design speeds. Recently
FDOT, through the leadership of District 1 Secretary Billy Hattaway and Bicycle and
Pedestrian Coordinator DeWayne Carver, have led the effort at a statewide level to
narrow travel lane widths to eleven feet on arterials with posted speed limits of 45
mph or less and increase the width of bicycle lanes from 4 to 7 feet. The state has also
developed guidance for road diets, roundabouts, and transit oriented developments
and has developed a webpage where this information can be downloaded (www.dot.
state.fl.us/rddesign/CSI). These efforts are very important as many local governments
look for direction and guidance from the state on Complete Street design.

Beyond the statewide push for Complete Streets, in 2007 the Florida legislature
introduced the concept of mobility plans and mobility fees as a replacement to
transportation concurrency, which emphasized accommodating the impact of new
development by building roads and widening existing ones. In 2011, the legislature
abolished statewide transportation concurrency and in 2013 established mobility
plans and mobility fees as the preferred way to deal with development impacts.

Groningen, Netherlands (left) and Copenhagen, Denmark (right). www.pedbikeimages.org. Ryan Snyder.

11                                                 ON THE HORIZON | SOTP 2016
MULTIMODAL TRANSPORTATION

These changes are significant in that they allow the state and local governments
to shift focus from addressing travel demand by adding new roadway capacity
to encouraging and promoting mobility through all means of travel. The 2010
Alachua County Mobility Plan was the first mobility plan adopted by a Florida local
government that emphasized walking and bicycling in traditional neighborhood
developments and transit oriented developments, as illustrated in the following
policy of the Future Land Use Element of the Comprehensive Plan:

 “Policy 1.6.7 Transportation Network: The transportation network shall be designed as a continuous
interconnected network of narrow streets, including a pedestrian and bicycle circulation system, designed
to calm traffic speeds and encourage walking and bicycling throughout the development, provide con-
nectivity, and functionally and physically integrate the various uses within and beyond the neighborhood
to reduce the distances of travel between uses and promote the internal capture of trips, reduce impact on
external roadways, and promote transit use.”

Beyond just encouraging walking and bicycling through complete street design
principals, the policies went even further by allowing woonerfs in the Alachua
County Unified Land Development Code:

“Policy 407.68 (d) 1. e. Innovative traffic calming techniques, except along roadways identified on the
Future Highways Functional Classification Map in the Comprehensive Plan, are allowed along roadways
and at intersections within the development. Techniques may include raised intersections, Woonerfs
(streets where pedestrians and cyclists have legal priority using techniques including shared space, traffic
calming and low speed limits), shared multi-modal spaces with reduced markings and signage in addi-
tion to other innovations that enhance pedestrian and bicycle mobility.”

A woonerf, also known as a “living street,” is a Dutch concept that emphasizes the
role of streets as public spaces where pedestrians and bicycles can freely, safely, and
legally travel. Motor vehicles are still allowed within these environments, albeit at
much slower speeds and without the curbing, pavement markings, and design speeds
that are common elements on roadways and Complete Streets. With its absence of
dedicated travel lanes, curbs, pavement markings, and regulatory signage, a woonerf
at first glance appears chaotic. The free movement of all modes of travel in the shared
public space results in an appreciation of the order in which mobility occurs.

While increasingly common in Europe, the woonerf is a relatively new concept in
most communities in the United States. Unless specifically authorized by a local
government’s comprehensive plan, zoning, or land development regulations, it is
most likely not allowed in local street design. The AASHTO Green Book and the
Manual of Uniform Traffic Control Devices (MUTCD) provide little guidance in
directly addressing woonerfs.

Woonerfs are most appropriately designed on a case-by-case basis and should be done
in a context sensitive manner. The City of San Francisco has prepared a Living Alleys

12                                                      ON THE HORIZON | SOTP 2016
MULTIMODAL TRANSPORTATION

Program that embraces the woonerf concept and developed a helpful toolkit for
planning such facilities.1 Residential streets, mixed-use developments, and walkable
retail developments are examples of land use patterns in the US where communities
have implemented woonerfs.

In Europe, woonerfs exist in a variety of locations including higher volume roads
within in the centers of villages and smaller cities, as well as in residential areas
and city centers. Common design elements include level travel areas without raised
curbing or distinct facilities that separate pedestrians, bicyclists, and motorists; no or
little regulatory signage; and no pavement markings that denote dedicated spaces for
a particular mode of travel. Woonerfs can include alternative pavement treatments,
trees, landscape planters, street furniture, bicycle racks, lighting, outdoor cafes and
restaurants, and play areas for children.

Celebration Pointe, Alachua County’s first transit oriented development approved
under the County’s Mobility Plan policies, is exploring a pedestrian friendly design
for its Main Street that incorporates the woonerf concept. The street will have
children’s play areas, fountains, outdoor seating, gazebos, and small retail structures.
Large live oaks that have been saved from other developments in central Florida will
be incorporated into the streetscape to provide shade and create distinctive outdoor
spaces. While vehicles will be permitted along portions of the woonerf, priority
is given to pedestrians and bicyclists. Overall, woonerfs have the potential to be
transformative elements within a community and can create vibrant environments
that promote walking and bicycling.

Jonathan Paul, AICP is the Principal of NUE Urban Concepts, LLC specializing
in creative and innovative land use and mobility strategies and can be reached at
nueurbanconcepts@gmail.com or www.nueurbanconcepts.com.

1 http://www.sf-planning.org/index.aspx?page=3510.

13                                              ON THE HORIZON | SOTP 2016
ENVIRONMENT

Boulder Greenhouse Gas Reduction
in Transportation
Randall Rutsch, AICP

The Boulder Transportation Master Plan (TMP) is set within the broader context of the
Boulder Valley Comprehensive Plan and supports the sustainability and quality-of-
life goals set by the community. Boulder’s TMP establishes the goals, policy guidance,
and measurable objectives for operating and investing in the city’s multimodal
transportation system. In collaboration with local and regional partners, the TMP
focuses on creating a complete transportation system providing multiple travel
options for increased person trips, managing traffic congestion, and reducing air
pollution and noise.

Based on consistent policy direction, Boulder has achieved the 1996 TMP objective
to return Vehicle Miles Traveled (VMT) to 1994 levels. Boulder residents’ per capita
VMT is less than half the regional average and Boulder VMT peaked a decade before
the rest of the region. This success is a result of the synergy between land use policies
and the multimodal transportation investments made by the city. These efforts have
already reduced VMT and thereby greenhouse gas (GhG) emissions by over 30
percent from where they would have been without these actions. However, the 2014
TMP contribution needed to meet the city’s Climate Commitment goals calls for a
20 percent reduction in VMT and a reduction in resident single occupant vehicle
(SOV) mode share to 20 percent of all trips by 2035. The material below describes the
analysis used to establish these ambitious objectives.

During the 2014 TMP process, the city began pursuing a Climate Commitment of an
80 percent reduction in GhG emissions by 2050. This target represents the scientific
consensus on the reductions needed to avoid significant impacts from climate change
and will require aggressive action across all parts of the community. Part of the TMP
process involved collaboration with the city’s Climate Commitment analysis to
quantify the GhG emissions generated through the transportation sector and identify
strategies making a significant contribution to the 80 percent GhG reduction target.

The core intent of this interdepartmental effort was to establish an ambitious but
achievable objective for transportation GhG reduction, recognizing the progress
already achieved by the community. Previous inventories had established that the
local transportation sector contributed about 22 percent of Boulder’s GhG emissions.
The previous Climate Action Plan did not have a reasonable transportation objective.

14                                             ON THE HORIZON | SOTP 2016
ENVIRONMENT

A multi-departmental and consultant team including Nelson/Nygaard, Fox/Tuttle/
Hernandez, and the Southwest Energy Efficiency Project (SWEEP) conducted this
analysis and the strategy development process. The steps of the analysis process were:

• Quantify existing VMT and GhG emissions from seven leading transportation
  sectors.
• Factor up travel expectations to 2035 based on population and employment forecasts.
• Project the VMT reduction potential of the range of travel demand management
  (parking and access management) and travel mode change actions (bike/walk
  promotion, transit system development, other travel share programs) being
  developed for the TMP.
• Evaluate heavy vehicle emissions of GhG, including transit, and different clean
  vehicle options for this fleet.
• Quantify the anticipated GhG reductions created by federally-mandated
  improvements in light-duty vehicles (CAFE standards).
• Identify the additional reductions needed from innovations like energy efficiency,
  fuel source switching, land use change, and additional TDM programs like
  expanded parking management.

The sequence of this analysis and the related data sources are shown in Figure 1. The
first step was a detailed analysis of Boulder vehicle fleet characteristics based on the
Colorado database of registered motor vehicles. This inventory showed that there were
about 68,000 vehicles registered in Boulder. As might be expected from Boulder’s green
reputation, there are a high number of hybrid and electric vehicles, making up about

Figure 1: Transportation GhG Analysis Process

15                                            ON THE HORIZON | SOTP 2016
ENVIRONMENT

five percent of the fleet and being about five times the national average. However,
the Subaru Outback is the most popular vehicle and combined with a high number of
sport utility vehicles (SUVs), the Boulder fleet average miles per gallon is similar to
the national average. Table 1 shows the ten most popular vehicles in the Boulder fleet.

Boulder has been collecting detailed travel data on both residents and non resident
employees since 1990, allowing for an estimate of daily individual VMT for each
transportation sector. The comparison of calculated daily VMTs for the city and region
are shown in Table 2. Using the knowledge of vehicle fleet characteristics and travel
behavior data for Boulder residents and non resident employees, we were then able
to calculate the total and relative share of VMT and GhG emissions for the different
sectors of transportation. These calculations included factors for multiple occupant
vehicles and multiple refinements represented in 21 versions of the spreadsheet.

Table 1: Top Ten Vehicles in the Boulder Fleet
     Rank          Make              Model             Number     Percent of Total
1                      Subaru          Outback              1,400             2.0%
2                      Honda               Civic            1,053             1.5%
3                      Subaru            Legacy             1,043             1.5%
4                      Subaru          Forrester              973             1.4%
5                      Toyota              Prius              904             1.3%
6                      Honda            Accord                866             1.3%
7                      Toyota          4Runner                713             1.0%
8                      Toyota            Camry                689             1.0%
9                 Volkswagon                Jetta             659             1.0%
10                     Toyota              Rav4               599             0.9%
Total                                                       8,899              13%

Table 2: Compared Daily VMT
2005 Regional Per Capita VMT            26.3
2035 Regional Per Capita VMT            23.7
Boulder non-resident employee           28.4
Boulder resident                        11.2

Findings of this analysis show that Boulder residents are responsible for the majority
of transportation related GhG emissions, either from auto vehicle use or from freight

16                                             ON THE HORIZON | SOTP 2016
ENVIRONMENT
deliveries. Freight and transit also have a disproportionate share of GhG emissions
relative to their VMT, due to their diesel engines and heavy weight. Table 3 shows the
calculated 2014 VMT and GhG emissions for each transportation sector and totals.
Table 3: Boulder Valley Transportation Emission Sources by Sector
Annual VMT % VMT Annual GhG (MT) % GhG
Resident 323,769,600 51% 118,809 38%
Non-Resident Employee 192,192,000 30% 70,526 23%
Student 70,200,000 11% 25,760 8%
Visitor 25,550,000 4% 9,376 3%
Transit 10,435,000 2% 31,110 10%
Freight 18,250,000 3% 52,980 17%
Boulder Personal Aircraft 2,188 0.7%
Annual GhG (Metric Tons) 310,749 100%
In parallel to the vehicle fleet and GhG inventory effort, the actions being proposed
for the 2014 TMP were evaluated to assess their VMT reduction potential. This
assessment included a literature review, collection of case studies of other
community’s GhG reduction efforts, and the use of the EPA Commuter model to
assess the effects of the proposed TMP mode share targets. Taking into account the
progress already made in the community to reduce VMT, the team concluded that a
20 percent VMT reduction objective was aggressive but achievable using the strategies
and tools contained in the draft plan. This conclusion was supported by a sensitivity
analysis showing that additional areas of managed parking or increased availability of
the Eco Pass, an annual transit pass, would significantly increase transit ridership.
The existing VMT and GhG emissions were then factored up to a 2035 forecast using
the city’s existing population and employment projections and adjusted to reflect the
effects of successfully implementing the TMP’s “Renewed Vision for Transit.” This
level of investment is expected to more than double transit ridership. The 20 percent
reduction in VMT was calculated to produce a net 15 percent reduction in GhG
emissions once the emissions from the increased level of transit service are included.
The known expected reductions in transportation GhG emissions are then reflected
in Figure 2, compiled by SWEEP. This figure shows the reductions expected from
the improved light vehicle efficiency mandated by the federal CAFE standards and
the results of successfully implementing the TMP actions. The large green wedge
represented efforts that still needed to be defined, which could include additional
TDM and land use changes as well as vehicle electrification.
17 ON THE HORIZON | SOTP 2016ENVIRONMENT Figure 2: Projected GhG Reductions by Action Area Personal electric vehicles are among the options available for the innovations wedge, which also includes land use changes to make long trips into short, walkable/bikeable ones. Such changes will have many co-benefits to the community, including livability, economic vitality, equitable access, and a wide array of environmental benefits. But knowing that additional reductions were needed in the transportation area and that a growing number of cleaner fuel options are available for the transit fleet, including electric vehicles, an additional analysis of the potential for transit clean fuel options was conducted by Nelson/Nygaard. The first step of this analysis produced the emissions factors and comparisons between available clean fuel transit vehicles (see Table 4). One of the early findings of the analysis showed that electric vehicles would have limited benefit with the current fuels mix of electricity in Boulder. As Boulder is involved in an electric municipalization effort driven by the desire for a clean electric supply, the analysis included this option. These emission factors were then applied to the 2035 projected VMT by transportation sector for the Boulder valley. The following tables assume complete fleet conversion to the identified fuel source and the GhG savings of the increased transit ridership called for in the TMP. Current year transit emissions are estimated at about 25,500 metric tons (MT) carbon dioxide equivalent (CO2e) for RTD, the regional transit provider, and Via, the community’s special transit provider. An estimated 35,000 MT CO2e are avoided from existing annual transit trips in Boulder County. 18 ON THE HORIZON | SOTP 2016
ENVIRONMENT

Table 4: Annual Transit GhG Savings from Cleaner Fuel/Energy Adoption, MT
CO2e, Current and 2035 Fleet Scenarios
                           Fuel Type             Metric Tons Difference        Difference       Difference       Difference       Difference       Difference      % Change
                                                 of CO2e      from A.          from B.          from C1.         from C2.         from D1.         from D2.        from Current
                                                 Emissions                                                                                                         Year Diesel
                                                 per Year                                                                                                          Fleet
                           A. Diesel             25,530       0                9,910            9,890            15,040           9,870            20,830          NA
                           B. Hybrid             15,620       -9,910           0                -20              5,130            -40              10,930          -39%
                           Electric (HEV)
                           C1. Electric/         15,640       -9,890           20               0                5,150            -20              10,950          -39%
Current Year (2013 Base)

                           HEV (Current
                           Energy Mix)
                           C2. Electric/         10,490       -15,040          -5,130           -5,150           0                -5,170           5790            -59%
                           HEV (Low
                           Carbon Energy
                           Mix)
                           D1. Full electric     15,660       -9,870           40               20               5,170            0                10,970          -38%
                           (Current Energy
                           Mix)
                           D2. Full electric     4,700        -20,830          -10,930          -10,950          -5,790           -10,970          0               -82%
                           (Low Carbon
                           Energy Mix)
                           Fleet VMT/Year: 8,703,000

                           Comparisons to 2035 Scenario Base Emissions                                                                                             Current Base
                           Fuel      Metric Tons Difference       Difference       Difference       Difference       Difference       Difference       % Change    % Change
                           Type      of CO2e       from A.        from B.          from C1.         from C2.         from D1.         from D2.         from 2035   from
                                     Emissions                                                                                                         Diesel      Current Year
2035 Transit Scenario

                                     per Year                                                                                                          Fleet       Diesel Fleet
                           A.        39,870        0              17,960           17,940           22,010           17,900           33,280           NA          56%
                           B.        21,910        -17,960        0                -20              4,050            -60              15,320           -45%        -14%
                           C1.       21,930        -17,940        20               0                4,070            -40              15,340           -45%        -14%
                           C2.       17,860        -22,010        -4,050           -4,070           0                -4,110           11,270           -55%        -30%
                           D1.       21,970        -17,900        60               40               4,110            0                15,380           -45%        -14%
                           D2.       6,590         -33,280        -15,320          -15,340          -11,270          -15,380          0                -83%        -74%
                           Fleet VMT/Year: 15,064,00

* Current mix of electricity: 60% coal with scrubbers, 22% natural gas, and 18% wind and other “green” sources.
** “Low carbon mix” is an average CO2e (24.8g) output of bio-mass (18g), Solar PV (46g), Solar CSP (22g), and wind (12g),
adjusted for CO2 equivalency.
Source: Moomaw, W., et al, 2011: Annex II: Methodology. IPCC Special Report on Renewable Energy Sources and Climate
Change Mitigation [O. Edenhofer, et al [eds.]], Cambridge University Press, Cambridge, New York, NY.
http://srren.ipcc-wg3.de/report/IPCC_SRREN_Annex_II.pdf

                                19                                                                      ON THE HORIZON | SOTP 2016
ENVIRONMENT
Table 5: City of Boulder 2035 GhG Forecast and Reductions due to Passenger
VMT Avoided and Transit Fleet Fuel/ Energy
Annual VMT % Annual % Reduction of % of Total Boulder
VMT GhG (MT) Transit-Related 2035 Transportation
GhG Emissions (c) GhG Forecast (d)
A. Non-Resident Employee 235,152,000 36% 86,290 - 31%
B. Resident (walk/bike) 309,581,170 47% 113,603 - 41%
C. Student (walk/bike) 94,500,000 14% 34,677 - 12%
D. Total without Transit (a) 639,233,170 97% 234,571 - 84%
E. 2035 Transit Scenario - Diesel (b) 15,064,200 2% 39,900 - 14%
F. Transit - CU/NCAR/BVSD (a) 3,269,500 0% 8,400 - 3%
G. Total with Transit 657,566,900 100% 282,900 - 100%
GhG Reductions (Energy or Rider VMT Avoided)
H. Reduction with HEV fleet -18,000 -45% -6%
I. Reduction with Electric/HEV with -18,000 -45% -6%
existing energy mix
J. Reduction with Electric/HEV with low- -22,000 -55% -8%
carbon mix
K. Reduction with Full Electric with existing -17,900 -45% -6%
energy mix
L. Reduction with Full Electric with low- -33,300 -83% -12%
carbon mix
M. Transit Riders VMT/GhG Avoided (e) -40,200 -101% -14%
Net RTD/VIA GhG
N. With Diesel Fleet and Rider VMT Avoided -300 -1% 0%
O. With Hybrid-Electric Fleet and Rider VMT -18,300 -46% -6%
Avoided
P. With HEV/Electric existing energy mix -18,300 -46% -6%
and Rider VMT Avoided
Q. With HEV/Electric low-carbon mix and -22,300 -56% -8%
Rider VMT Avoided
R. With Full Electric existing energy mix and -18,200 -46% -6%
Rider VMT Avoided
S. With Full Electric low-carbon mix and -33,600 -84% -12%
Rider VMT Avoided
(a) From GhG Transportation Data Book, for 2035.
(b) From fleet analysis or revised calculations.
(c) Percentages are relative to the RTD/Via transit emissions only.
(d) Percentages are relative to the total City of Boulder Transportation GhG Forecast.
(e) Transit scenario estimate adapted for this analysis including an adjustment for weekend riders.
20 ON THE HORIZON | SOTP 2016ENVIRONMENT Key Findings and Lessons Learned Key findings from the transit analysis include: • Maintaining the status quo primarily diesel bus transit fleet would decrease the current net GhG emissions benefit from transit by 2035 due to increased transit service and increased passenger vehicle fuel efficiency. This would occur even with an assumed 18 percent efficiency improvement in standard transit vehicles. Based on this analysis, the benefit is small but still a net reduction in GhG emissions. • It is necessary to transition the transit fleet to cleaner fuel/energy sources to increase net GhG emissions reductions from transit. • With the current electricity energy source mix in Boulder, a conversion to electric buses offers little overall benefit in reducing GhG emissions—comparable to converting to hybrid-electric vehicles. However, shifting to an electric bus fleet does reduce local emissions of various air pollutants while generating emissions at the energy source, e.g., coal or natural gas power plant. • A low-carbon energy source mix reduces the overall GhG emissions of the fleet, reducing 2035 emissions to 26 percent of the current level (74 percent reduction) and to 17 percent of the 2035 scenario estimate (83 percent reduction). • An all-electric transit fleet scenario may not be supported by battery technology by 2035, however an alternative technology is likely to be available that can provide comparable emissions benefits to the alternative analyzed. • Transit also provides indirect GhG benefits, contributing to land use development patterns that support reduced VMT and have a smaller GhG footprint. Transit plays a key role in shaping built form and compact, walkable neighborhoods. Residents in walkable neighborhoods drive less not only by walking and biking more but by using transit more often. Broader lessons learned as part of the analysis include: • The city has a detailed understanding of our fleet mix including the penetration of clean fuel vehicles. • In contrast to past efforts that considered only VMT in the Boulder Valley, we now understand the role of non-resident employees, per ICLEI protocol that requires the city to include one half of those commute trips in our GhG inventory. 21 ON THE HORIZON | SOTP 2016
ENVIRONMENT

• The city can achieve deep transportation GhG reductions but only if we clean the
  vehicle fleet, including the transit fleet.

• Actions are needed that are far more significant than anything done to-date. The
  city’s 80 percent reduction goal by 2050 requires an average 4.6 percent reduction
  every year.

• Conservation and efficiency alone will not achieve the goal.

• Significant emission reductions will only be achieved through collective action and
  fundamental systems change, such as achieving a clean electricity mix and creating
  more walkable neighborhoods.

Randall Rutsch is a transportation planner for the City of Boulder, Colorado.
rutschr@bouldercolorado.gov.

22                                           ON THE HORIZON | SOTP 2016
ENVIRONMENT

Transportation Energy Beyond
Fossil Fuels: Improving Vehicle
Energy Intensity
Kimberly Burton, P.E., AICP CTP, LEED AP ND

Transportation Energy Overview
According to the US Energy Information Administration (US EIA), “[p]assenger
transportation, in particular light-duty vehicles, accounts for most transportation
energy consumption – light-duty vehicles alone consume more than all freight modes
of transportation, such as heavy trucks, marine, and rail.”1 The US has historically
consumed more energy from petroleum than from any other energy source,2 and 92
percent of US transportation energy use came from petroleum.3

According to the US EIA’s world consumption trends research, this pattern is
projected to continue. The three main concerns associated with current energy
consumption patterns center around:

• Environmental Damage – climate change, air pollution and extraction
• Nonrenewable Supplies – supply limitations and price fluctuations
• Nondomestic Supplies – security and dependability concerns

To address these transportation energy-related issues, solutions can be grouped into
three main categories:

1. Improve vehicle energy intensity
2. Use low-carbon fuels
3. Reduce vehicle miles travelled

An overview of these three areas was provided in a 2013 State of Transportation
Planning article. This article will focus in detail on how to address the first category:
improving vehicle energy intensity.

1 Dorman, Linda and Nick Chase, “Today in Energy: Passenger travel accounts for most of world
transportation energy use,” US Energy Information Administration (November 2015). www.eia.gov
2 Primary Energy Consumption Estimates by Source, US EIA, 2014.
3 Primary Energy Consumption Estimates by Source and Sector, US EIA, 2014.

23                                                 ON THE HORIZON | SOTP 2016
ENVIRONMENT

Annual Global Transportation Energy Consumption by Mode,
2012 (quadrillion Btu), US EIA

Vehicle Energy Intensity Defined
The main factors that influence the vehicle energy intensity of light-duty vehicles
are technology, fuel prices, public policy, and consumer choice. What does it mean to
improve vehicle energy intensity? It involves increasing the vehicle efficiency or fuel
economy of a vehicle, including:

• Improving conventional gasoline engines via more efficient combustion
  technologies and transmissions.
• Developing advanced vehicle technologies, such as regenerative braking.
• Reducing the weight of materials and aerodynamic resistance in vehicles.
• Increasing alternative fuel vehicles – battery electric, hybrid electric, flex-fuel, fuel
  cells, and various combinations.

Current efficiency for a typical gasoline-powered vehicle is 20 to 25 percent.4
With today’s technologies, conventional gasoline engines can be improved using
more efficient combustion technologies and transmissions, and vehicles could be
constructed with lighter-weight materials and aerodynamic designs.

Technology Solutions
Increasing vehicle electrification, hybrids, and hydrogen-powered cars, trucks, and
buses would improve vehicle efficiency and reduce GHG emissions. Options include:

4 Randolph, John and Gilbert Masters, Energy for Sustainability, Island Press, 2008. p505.

24                                                      ON THE HORIZON | SOTP 2016
ENVIRONMENT

•    FFVs – Flex Fuel Vehicles can run on gasoline or alcohol blends up to 85 percent.

• HEVs – Hybrid Electric Vehicles have gasoline engine like conventional vehicles
  but also have an electric motor drive that works in tandem with the gas engine.

• PHEVs – Plug-In Hybrid Electric Vehicles are HEVs that can use grid power to
  assist with charging the battery.

• FF-PHEVs – Flex Fuel Plug-In Hybrid Electric Vehicles use a flex-fuel engine that
  can run on gasoline or ethanol blend, which would further reduce petroleum
  usage. The miles per gallon of gasoline would be 500 to 700—95 percent less
  gasoline usage than the average car on the road today.5

• BEVs – Battery Electric Vehicles run solely on a battery.

• FCEVs – Fuel Cell Electric Vehicles convert hydrogen to electricity without emissions.

• HypercarsTM focus on improvements to make the vehicle lighter, independent of
  the propulsion system, and could integrate various vehicle types. Physicist Amory
  Lovins, co-founder of the Rocky Mountain Institute and Hypercar, Inc., maintains
  that “contrary to folklore, it’s more important to make a car lightweight and low-
  drag than to make its engine more efficient or change its fuel.”6

5 Ibid. p524.
6 Rocky Mountain Institute, 2004. http://www.rmi.org

US HEV Sales by Model

US Department of Energy Alternative Fuels Data Center, www.afdc.energy.gov/data/

25                                                     ON THE HORIZON | SOTP 2016
ENVIRONMENT

HEVs have been the predominate type of efficient vehicle sold in the US. From 1999
to 2014, HEV sales grew significantly. In 2005, there was surge in sales due to new
federal and state tax incentives and rebates. The decline in sales from 2008 to 2011 was
connected to the recession, but sales have rebounded due to the economic recovery
and the new CAFE (Corporate Average Fuel Economy) standards. In addition, there
are many choices available—today there are nearly 60 different models.

For comparison purposes:
• Increasing vehicle efficiency from 22 to 32 miles per gallon would reduce vehicle
   petroleum use by 31 percent and imports of petroleum by 20 percent.7
• Increasing to an HEV equivalent of 42 miles per gallon would cut vehicle oil use
   by half and imports of petroleum by 30 percent.8
• Increasing to a PHEV/FF-PHEV equivalent of 100/500 miles per gallon would
   reduce petroleum imports by 50 percent and 62 percent, respectively.9

Fuel Price Solutions
Although fuel prices typically only affect travel behavior in the short term, in the
longer term, consumers do make purchasing decisions related to vehicle efficiency. If
fuel prices remain high, consumers tend to choose more fuel-efficient vehicles. Fuel
prices are set by market influences; however, federal and state taxes can be added to
(or removed from) fuel prices to have a direct effect on long-term vehicle efficiency.

Policy Solutions
The US could also make policy changes to increase vehicle efficiency performance
standards, industry commitments, and purchasing incentives. For example, the
primary policies in place today that regulate vehicle efficiency are CAFE standards.
Congress first adopted federal auto efficiency standards in the 1975 Energy
Conservation Policy Act, which mandated doubling average 1974 new auto fuel
efficiency to 27.5 miles per gallon by 1985. The CAFE standards were lowered to 26
miles per gallon from 1986-1989 but raised back to 27.5 miles per gallon in 1990. In
2011, the current federal administration developed new CAFE Standards, and they
represent the toughest fuel economy standards to date. Under these new standards,
average fuel efficiency for cars and trucks will nearly double, reaching an average
performance equivalent of nearly 55 miles per gallon by 2025, but US vehicle
efficiency standards still lag behind the standards of many other countries. Over
time, CAFE standards have been effective at increasing the average fuel economy of

7 Randolph, John and Gilbert Masters, Energy for Sustainability, Island Press, 2008. p511.
8 Ibid. p511.
9 Ibid. p512.

26                                                     ON THE HORIZON | SOTP 2016
ENVIRONMENT

automobiles; however, the average fuel economy has been negatively affected by the
increase of light duty trucks and SUVs, relatively low fuel prices, and the fact that the
CAFE standards had not been increased from 1990 to 2011—over 20 years.

Challenges
The main challenges associated with improving vehicle efficiency include:

• Vehicle cost – typically, hybrids and other fuel efficient vehicles cost more than
  standard vehicles.
• Information – it is difficult to translate the upfront cost of a fuel efficient vehicle
  into long-term savings on gasoline. In addition, information is not widely available
  on many vehicles options, their positives and negatives, and fueling station
  locations to help people make informed decisions on car purchases.
• Policy Implementation – although changing the CAFE standards in 2011 was step
  in the right direction, it will only affect vehicles built after that year. Older vehicles
  that remain on the road will still be less efficient than desired up until they are
  retired after an average 10-year lifespan.
• Policy Effectiveness – the penalties associated with not meeting CAFE standards
  are not always significant enough to ensure compliance. Many car manufacturers
  find it cheaper to pay the penalties than meet the efficiencies.
• Policy Strength – CAFE standards allow for more lenient efficiencies for light duty
  trucks and SUVs, and there has been an increase in sales of both.

Next Steps in Reducing Vehicle Energy Intensity
Reduction of vehicle energy intensity is one of the factors that needs to be addressed
in order to transition the transportation sector off of fossil fuels and onto more
sustainable energy patterns. Vehicle energy intensity is influenced by technology, fuel
prices, public policy, and consumer choice, so solutions include:

• Switching to energy efficient vehicles that use low/no-carbon fuels.
• Implementing programs, grants, and policies that support efficient vehicle
  technologies.
• Closing loopholes and increasing penalties in the CAFE standards so that vehicle
  manufacturers more closely adhere to them.
• Increasing federal and state gas taxes to influence consumer choice.

Kimberly Burton is an associate professor of practice in city and regional planning
at the Ohio State University and president of Burton Planning Services in Columbus,
Ohio. burton.90@osu.edu.

27                                              ON THE HORIZON | SOTP 2016
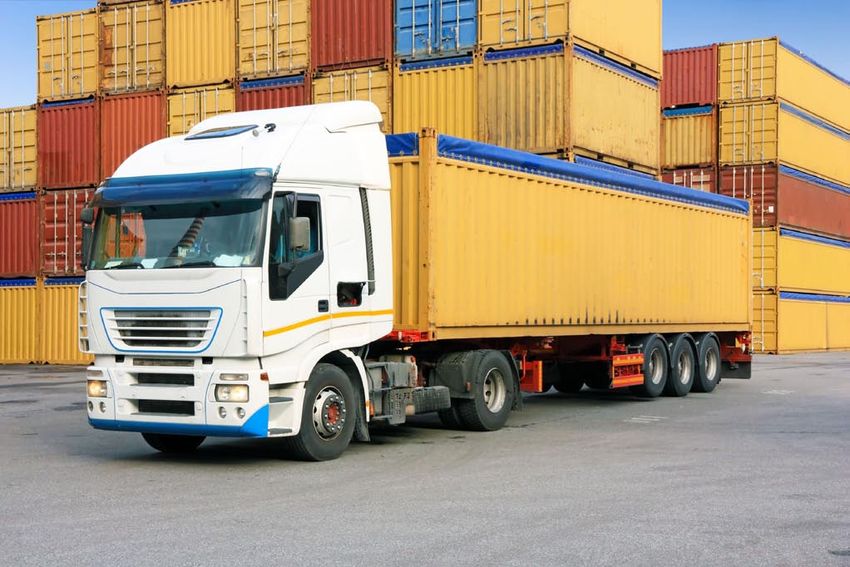
FREIGHT AND MOBILITY

Integrating Freight into Livable
Communities
Kristine Williams, AICP and Alexandria Carroll

Freight mobility is critical to the economic vitality of any community. Efficient
freight movement ensures that stores and restaurants are stocked appropriately, that
manufacturers get the raw materials they need, and that regional freight distribution
centers and local businesses receive packages, office supplies, and other goods. Much
of the visible freight activity in urbanized environments involves deliveries destined
for local businesses and homes.

Often referred to as “last-mile” activity, this is the most costly and problematic phase
of freight movement. Last-mile freight activity in urban areas not only competes
for public space, but can also create negative externalities (air and noise pollution,
congestion, and infrastructure damage).

Yet factors that make a community livable can create conditions that increase freight
demand, while reducing freight access. For example, conditions that increase freight
demand are increased density and a diverse mix of uses in close proximity—the
same factors that contribute to community livability and walkable neighborhoods.
Road diets and changes to street network design and site access to support bicycling
and pedestrian activity generally involve wider sidewalks, bicycle lanes, narrower
intersections with tight turning radii, and on-street parking. These changes benefit
pedestrians, yet make it harder for trucks to navigate turns, leading to congestion,
crashes, sidewalk encroachment, and curb damage.

Additionally, livability plans may reduce or fail to accommodate dedicated truck
parking areas. A lack of dedicated truck loading zones can increase roadway
congestion and vehicle emissions by forcing trucks to either circulate in search of a
parking space or double park. Fines from parking illegally can also increase freight
operational costs.

This tension between freight movement and community livability presents a paradox.
In communities where livability is a goal of the planning process, freight runs the
risk of being considered only as an afterthought or as a nuisance. Vibrant urban
cores require an appropriate balance between accessibility for freight delivery and
pedestrian/bicycle friendly environments. Communities need to provide efficient
access for large trucks, freight rail, and other modes of freight transportation without
impeding bicyclists, pedestrians, and transit users.

28                                            ON THE HORIZON | SOTP 2016
You can also read