CUTRIC National Smart Vehicle Joint Procurement Initiative: Rout .i predictive modelling of autonomous shuttle performance and passenger-carrying ...
←
→
Page content transcription
If your browser does not render page correctly, please read the page content below
CUTRIC National Smart Vehicle Joint Procurement
Initiative: Rout∑.i™ predictive modelling of
autonomous shuttle performance and passenger-
carrying capacity of first-km/last-km solutions

CUTRIC-ACATS Project Final Report

JANUARY 2021

AUTHORS
Dr. Mahmood Nesheli, Smart Vehicle Researcher
Dr. Elnaz Abotalebi, Smart Vehicle Project Lead
Dr. Roberto Sardenberg, Modeller & Data Science Researcher
Dr. Yutian Zhao, Modeller & Data Science Researcher
Mr. Shervin Bakhtiari, Team Lead: ZEB Simulation & Research
Ms. Parvathy Pillai, Project Manager: ZEB Simulation &
Commercialization
Dr. Josipa Petrunić, President & CEO
2

COPYRIGHT © 2021
Information in this document is to be considered the intellectual property of the Canadian Urban Transit
Research and Innovation Consortium (CUTRIC) in accordance with Canadian copyright law.
The material in this report reflects CUTRIC’s best judgement, in the light of the information available to it, at
the time of preparation. Any use which a third party makes of this report, or any reliance on or decisions to
be made based on it, are the responsibility of such third parties. CUTRIC accepts no responsibility for
damages, if any, suffered by any third party as a result of decisions made or actions based on this report.

DISCLAIMER
This project received funding support through Transport Canada’s Program to Advance Connectivity and
Automation in the Transportation System (ACATS). The views and opinions expressed are those of the
authors and do not necessarily reflect those of Transport Canada.

Canadian Urban Transit Research and Innovation Consortium (CUTRIC)
Consortium de recherche et d’innovation en transport urbain au Canada (CRITUC)
1 Yonge Street, Suite 1801
Toronto, ON M5E 1W7
info@cutric-crituc.org

CUTRIC-CRITUC Low-Carbon Smart Mobility Knowledge Series No. 3 2020 Edition 1.0
3

TABLE OF CONTENTS
List of Tables ___________________________________________________ 6
List of Figures __________________________________________________ 7
List of Acronyms ________________________________________________ 8
Introduction ___________________________________________________ 10
  Automated Vehicles ______________________________________________________ 10
  Connected Vehicles ______________________________________________________ 11
  Connected and Automated Vehicle Opportunities _______________________________ 12
Section I: Energy Consumption Feasibility Analysis ____________________ 13
  Objectives and Goals _____________________________________________________          13
  Route Selection Parameters and Processes ___________________________________        13
  Introduction to CUTRIC’s RoutΣ.iTM Simulation Tool _____________________________    19
  Modelling Inputs and Assumptions __________________________________________         19
  Modelling Methodology ___________________________________________________           19
  Speed and Topography Profile Generation ____________________________________        20
  Results of the Feasibility Study _____________________________________________      22
   Energy Consumption Results _____________________________________________           22
   State-of-Charge and Charging-Time Results _________________________________        24
   Creation of a Schedule __________________________________________________          25
   Round Trips Completed Before Recharge Required ___________________________         26
  Conclusions and Future Steps ______________________________________________ 27
Section II: Transit Ridership Impact Analysis _________________________ 29
  Four-Step Transportation Model ____________________________________________ 29
   Trip Generation ________________________________________________________           29
   Trip Distribution ________________________________________________________         30
   Mode Split ____________________________________________________________            30
   Traffic Assignment______________________________________________________           30
  Case Studies Suited for First-Kilometre/Last-Kilometre Applications ________________ 31
   Route Profiles and Energy Consumption: Summary from Section I ________________ 31
   Route Mapping ________________________________________________________ 34
   Transit Hub Schedule ___________________________________________________ 38
  Augmentation in Transit Ridership ___________________________________________ 40
   Ridership Assumptions in Different Scenarios ________________________________ 40
   Additional Assumptions __________________________________________________ 41
  Discussions and Next Steps _______________________________________________ 43
Section III: Communication Software and Hardware Standardization Analysis 45
  Connected Vehicle Standardization and Certification ____________________________ 45

CUTRIC-CRITUC Low-Carbon Smart Mobility Knowledge Series No. 3 2020 Edition 1.0
4

   Security Credential Management System ____________________________________ 45
   OmniAir Certification ____________________________________________________ 46
  Automated Vehicle Sensory Systems ________________________________________ 48
  Sensing Technologies ____________________________________________________ 49
   LIDAR _______________________________________________________________                   49
   Radar ________________________________________________________________                  51
   Cameras _____________________________________________________________                   53
   Ultrasonic Sensors _____________________________________________________                53
   Sensor Fusion _________________________________________________________                 54
  Additional CUTRIC Data Sources and Considerations for e-LSAs __________________ 55
Section IV: Cybersecurity Software and Hardware Risks and Vulnerabilities_ 57
  Introduction ____________________________________________________________ 57
  An Overview of Connected and Autonomous Vehicles ___________________________ 57
   Vehicle Connectivity ____________________________________________________ 57
   Vehicle Automation _____________________________________________________ 58
  Cyber-Attacks in Connected and Autonomous Vehicles __________________________ 58
   Password and Key Attacks _______________________________________________                58
   Denial-of-Service Attacks ________________________________________________              58
   Impersonation/Masquerading Attacks _______________________________________              60
   Replay Attacks ________________________________________________________                 60
   GPS Spoofing Attacks ___________________________________________________                61
   Routing Attacks ________________________________________________________                61
   Data Falsification Attacks ________________________________________________             62
   Eavesdropping Attacks __________________________________________________                63
   Location Trailing Attacks _________________________________________________             64
   Sensor Spoofing Attacks _________________________________________________               64
   Close Proximity Vulnerabilities ____________________________________________            64
   General Cyber-Attack Defense Strategies ___________________________________             65
  Cybersecurity and Safety Standards of CAVs __________________________________ 66
   ISO 26262 ____________________________________________________________ 66
   SAE J3061____________________________________________________________ 66
   British Standards Institution’s Cybersecurity Standard __________________________ 67
  Conclusion _____________________________________________________________ 68
Section V: National Smart Vehicle Joint Procurement Initiative Qualitative Outcomes   69
  Summary of Session Dialogues and Outcomes from the Manufacturer Working Group
  Sessions (2018-2019) ____________________________________________________ 69
   Session #1 ____________________________________________________________                 69
   Session #2 ____________________________________________________________                 69
   Session #3 ____________________________________________________________                 70
   Session #4 ____________________________________________________________                 71

CUTRIC-CRITUC Low-Carbon Smart Mobility Knowledge Series No. 3 2020 Edition 1.0
5

   Session #5 ____________________________________________________________ 72
   Session #6 ____________________________________________________________ 73
   Session #7 ____________________________________________________________ 74
  Summary of Session Dialogues and Outcomes from the Smart Vehicle Joint Procurement
  Initiative Sessions (2020) __________________________________________________ 74
   Session #1 ____________________________________________________________ 74
   Session #2 ____________________________________________________________ 74
   Session #3 ____________________________________________________________ 75
  Summary of Key Themes and Trends ________________________________________ 75
Conclusion ____________________________________________________ 78
References ___________________________________________________ 81

CUTRIC-CRITUC Low-Carbon Smart Mobility Knowledge Series No. 3 2020 Edition 1.0
6

LIST OF TABLES
Table 1. Route maps and associated characteristics..................................................... 15
Table 2. General assumptions applied in the modelling work. ....................................... 19
Table 3. The shapes of chosen routes, either loops or non-loops (round trip). .............. 22
Table 4. Energy efficiency (kWh/km) of the vehicle. ...................................................... 23
Table 5. Energy usage (kWh) for completing one loop or round trips. ........................... 24
Table 6. Charging time for the various vehicles after completing a loop or round-trip.... 25
Table 7. Simulated time for completing a loop or round trip. .......................................... 26
Table 8. Maximum number of loops or round trips if an on-route charger is not available based
on simulation results. Note the numbers in green indicate the vehicle is able to complete the
designed daily service. .................................................................................................. 27
Table 9. Simulation results of e-LSA’s total service time before depleting the battery to a
minimum SOC and requiring a recharge. ...................................................................... 27
Table 10. Route maps and associated characteristics................................................... 32
Table 11. Number of trips completed along each route within a 13-hour continuous, full service
day. ................................................................................................................................ 33
Table 12. Number of round trips along the three selected routes that can be performed before
the e-LSA requires a full recharge. ................................................................................ 34
Table 13. Scenario assumptions #1 and #2 to assess the theoretical impact of e-LSA
integration. ..................................................................................................................... 41
Table 14. Data related to the number of people in a household, associated average vehicles
owned and transit ridership............................................................................................ 42
Table 15. Simulation results for e-LSA deployments within different scenarios in Trois-Rivières.
...................................................................................................................................... 42
Table 16. Simulation results for e-LSA deployments within different scenarios in York Region.
...................................................................................................................................... 43
Table 17. Simulation results for e-LSA deploying within different scenarios in Brampton.43

CUTRIC-CRITUC Low-Carbon Smart Mobility Knowledge Series No. 3 2020 Edition 1.0
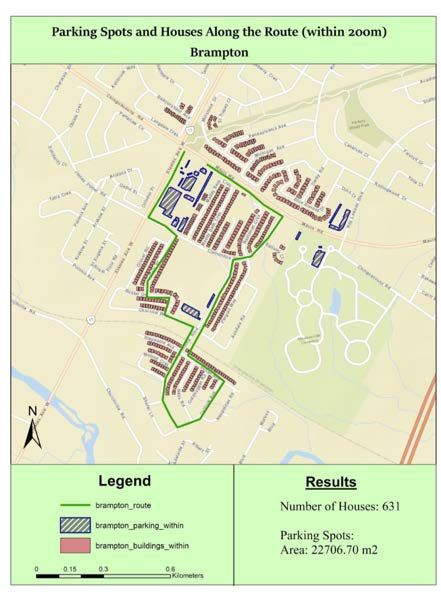
7

LIST OF FIGURES
Figure 1. Example of path definition in MyMaps. ........................................................... 20
Figure 2. Example of stop definition along routes. ......................................................... 20
Figure 3. Simulated profiles for York Region route, forward direction. ........................... 21
Figure 4. Simulated profiles for York Region route, reverse direction. ........................... 21
Figure 5. Simulated profiles for Vancouver route, loop-shaped. .................................... 22
Figure 6. Variations in medium-duty cycle energy consumption results for the vehicle. 23
Figure 7. The vehicle’s energy efficiency on a per kilometre and per passenger basis for
medium and heavy-duty cycles. .................................................................................... 24
Figure 8. SOC level after shuttle completes one loop or round trip of the routes. .......... 25
Figure 9. Parking areas and houses within a 200-metre radius of the Trois-Rivières route.
...................................................................................................................................... 35
Figure 10. Parking areas and houses within a 200-metre radius of the York Region route.
...................................................................................................................................... 36
Figure 11. Parking areas and houses within a 200-metre radius of the BR route. ......... 37
Figure 12. Typical trip for a resident of the targeted neighbourhood to commute to downtown
Trois-Rivières. ............................................................................................................... 38
Figure 13. Typical trip for a resident of the targeted neighbourhood to the Maple GO Station.
...................................................................................................................................... 39
Figure 14. A typical trip for a resident of the targeted neighbourhood to get to the Chinguacousy-
Zum Steeles Station Stop. ............................................................................................. 39

CUTRIC-CRITUC Low-Carbon Smart Mobility Knowledge Series No. 3 2020 Edition 1.0
8

LIST OF ACRONYMS
Ad hoc on-demand distance vector (AODV)
Advance Connectivity and Automation in the Transportation System (ACATS)
Advanced driver assistance systems (ADAS)
Application programming interface (API)
Attacked packet detection algorithm (APDA)
Automotive safety integrity level (ASIL)
Automated vehicle (AV)
Brampton (BR)
Canada Motor Vehicle Safety Standards (CMVSS)
Canadian Urban Transit Research and Innovation Consortium (CUTRIC)
Certificate revocation list (CRL)
Connected and Automated Vehicle Advisory Council (CAVAC)
Connected and autonomous vehicle (CAV)
Dedicated short-range communication (DSRC)
Denial of service (DoS)
Digital elevation model (DEM)
Edmonton Transit Service (ETS)
Electric low speed automated shuttle (e-LSA)
Elliptic curve digital signature algorithm (ECDSA)
European Committee for Standardization (CENT)
Frequency modulated continuous wave (FMCW)
Geographic information system (GIS)
Global positioning system (GPS)
Greater Toronto and Hamilton Area (GTHA)
Hash message authentication code (HMAC)
Information and communication technology (ICT)
Infrared (IR)
Intelligent transportation systems (ITS)
International Electrotechnical Commission (IEC)
International Organization for Standardization (ISO)
Light detection and ranging (LIDAR)
National Institute of Standards and Technology (NIST)
Non-disclosure agreement (NDA)
Media access control (MAC)
Memorandum of Understanding (MOU)
Micro-electro-mechanical-systems (MEMS)
Motor Vehicle Safety Act (MVSA)
On-board unit (OBU)
Political, Economic, Social, Technological, Environmental and Legal (PESTEL)
Physical challenge-response authentication (PyCRA)
Public key infrastructure (PKI)
Radio-frequency identification (RFID)
Regional Transportation District (RTD)
Request response detection algorithm (RRDA)
Road-side unit (RSU)
Security Credential Management Systems (SCMS)
Sequence number (SN)
Société de transport de Trois-Rivières (STTR)

CUTRIC-CRITUC Low-Carbon Smart Mobility Knowledge Series No. 3 2020 Edition 1.0
9

Society of Automotive Engineers (SAE)
Software defined networking (SDN)
State-of-charge (SOC)
Strengths, Weaknesses, Opportunities and Threats (SWOT)
Toronto Region Board of Trade (TRBOT)
Trois-Rivières (TR)
Toronto Transit Commission (TTC)
Three-dimensional (3D)
Trusted platform module (TPM)
United States Department of Transportation (USDOT)
Vehicle-to-everything (V2X)
Vehicle-to-infrastructure (V2I)
Vehicle-to-vehicle (V2V)
Wireless access in vehicular environments (WAVE)
York Region (YR)

CUTRIC-CRITUC Low-Carbon Smart Mobility Knowledge Series No. 3 2020 Edition 1.0
10
INTRODUCTION
Transport Canada created the Advance Connectivity and Automation in the Transportation System (ACATS)
program to help prepare the country for connected and automated vehicle (CAV) deployments on Canadian
roads. The ACATS program distributed C$2.9 million across 15 different organizations to support: (1)
research, studies and technology evaluations; (2) the development of codes, standards and guidance
materials; and (3) capacity-building and knowledge-sharing activities.
The Canadian Urban Transit Research and Innovation Consortium (CUTRIC) was one of the 15
organizations awarded a research contract through the ACATS program. This final report includes five
sections that are allied to CUTRIC’s first-kilometre/last-kilometre electric low-speed automated shuttle (e-
LSA) deployment efforts within the National Smart Vehicle Joint Procurement Initiative:
● Section I details the energy consumption feasibility analysis for electric low-speed automated shuttle
deployment on nine first-kilometre/last-kilometre routes.
● Section II details the transit ridership impact analysis based on e-LSA deployment along three
selected first-kilometre/last-kilometre routes.
● Section III provides an overview of communication software and hardware systems and applicable
standards.
● Section IV provides an overview of cybersecurity software and hardware risks, vulnerabilities and
standards.
● Section V provides a qualitative overview of the Manufacturer Working Group sessions that CUTRIC
has hosted since 2018 to advance the National Smart Vehicle Joint Procurement Initiative.
Automated Vehicles
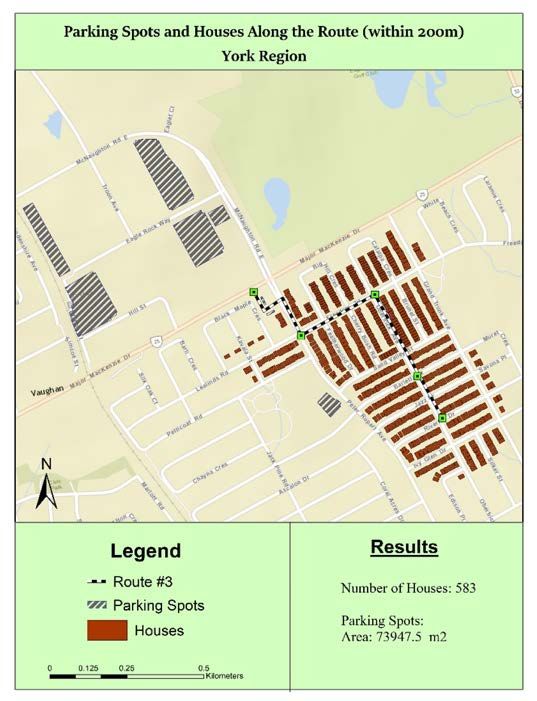
Automated vehicles (AVs) can reduce the number of on-road collisions and fatalities, as well as congestion
and transportation emissions overall, through optimized traffic-flow networks. The safety potential of AVs is
of critical interest given that there were nearly 1,900 deaths and 108,500 personal injuries in Canada in 2018
from motor vehicle collisions [1]. It is estimated that 94 per cent of all serious motor-vehicle crashes result
from human error while driving, highlighting the strong benefits AV technologies could offer to reduce road
collisions [2].
An AV uses a combination of sensory, localization and navigation technologies to maneuver roadways
without direct human guidance and supervision. A vehicle’s degree of automation is defined through the SAE
J3016 standard, which outlines six levels of vehicle automation on a scale of 0 - 5, where Level 0 has no
automation and Level 5 is full vehicle autonomy [3].
AVs use sensory technologies to detect surrounding environments in real time. Based on object
classifications, the vehicle decides on a course of action regarding if, or how, it will navigate objects ahead.
Manufacturers use a combination of sensory technologies within their vehicles to enable redundancies and
minimize risk. The most common sensory technologies include light detection and ranging (LIDAR), radio
detection and ranging (radar), cameras and ultrasonic sensors, as well as inertial-measurement units and
infrared sensors.
Each sensory technology has both strengths and limitations, necessitating multiple technologies to ensure a
safe level of redundancy. Fully automated vehicles, therefore, receive multiple real-time data inputs from the
sensors, and this information is amalgamated and processed in the central vehicular computer through a
process called “sensor fusion.” Sensor fusion is a difficult computation given the volume of real-time data
CUTRIC-CRITUC Low-Carbon Smart Mobility Knowledge Series No. 3 2020 Edition 1.011 inputs from multiple sensors and the often-contradictory information across sensors. This remains one of the ongoing challenges to achieving fully automated vehicles [4]. AV navigation and location systems describe the technologies a vehicle requires to locate itself and navigate through established road networks. Manufacturers use several localization-technology options including high-definition (HD) mapping, global-positioning systems (GPS), global navigation satellite systems (GNSS), real-time kinetic (RTK) positioning, cameras and magnetic markers. Similar to sensory systems, each of these localization systems carries unique strengths and limitations, which often lead manufacturers to use a primary localization system with a secondary system for safety redundancy. Connected Vehicles Interest in road-vehicle data connectivity has been growing steadily since the early 1990s [5]. With the explosion of high-speed wireless communications in the new millennium, as well as dramatic capability improvements and cost reductions in small-scale computing technologies (such as those related to smartphone devices), many ideas for vehicle connectivity, which may have seemed like a fantasy a few decades ago, are now technologically possible. Although some wireless communication standards for vehicle connectivity have yet to be resolved, trials of various connected vehicle technologies have begun to move forward, moving the automotive industry closer to large-scale deployment [6]. Connected vehicle technologies can improve both safety and efficiency, as well as overall data generation for improved decision making [7]. These advancements can benefit automobile operators, other road users (i.e. pedestrians and cyclists) and transportation authorities. Vehicle connectivity can be categorized by the entities exchanging data. Vehicle-to-vehicle (V2V) connectivity involves real-time wireless transmission and data reception between two or more vehicles in operation. Naturally, this requires the installation and use of compatible hardware and software in all vehicles involved. Applications for V2V connectivity could include forward collision warnings, intersection safety warnings and passing warnings. With V2V, the benefits to each automobile operator increase as more vehicles become equipped with the technology. Vehicle-to-infrastructure (V2I) connectivity, in contrast, enables data exchange between a vehicle and the road environment through which it travels. In particular, intersections offer a tremendous opportunity for improvements in safety and efficiency using V2I connectivity, such as the transmission of red and green light time-to-change information, red-light warnings, and transit and emergency vehicle priority systems [6]. Beyond intersections, V2I connectivity can convey pertinent information about speed limits, work zones, curve speeds and wrong-way warnings, potentially even allowing infrastructure to respond to a vehicle’s actions. Vehicle-to-pedestrian (V2P) connectivity is another area of current research, with potential applications including in-vehicle warning systems notifying drivers of pedestrians in the intended path of travel, or communication with vision-impaired pedestrians via smartphones [8]. When multiple vehicles and infrastructure elements can communicate together, additional capabilities become possible in what is collectively known as vehicle-to-everything (V2X) connectivity. In theory, V2X has the potential to help solve some of our most challenging traffic problems, as each vehicle can essentially participate in building a big-picture view of all roadway hazards and opportunities for efficiency. CUTRIC-CRITUC Low-Carbon Smart Mobility Knowledge Series No. 3 2020 Edition 1.0
12

Connected and Automated Vehicle Opportunities
Connected and automated vehicles (CAV) can potentially reduce congestion and greenhouse gas (GHG)
emissions if policies promote ride sharing, increase carbon taxes, promote electrification, and enact road
pricing mechanisms to control the threat of empty vehicles on roadways [9]. Despite the effects of COVID19
on reduce car travel throughout 2020, congestion in Canadian urban centres remains a long-term challenge.
For example, there are over 2.74 million commuters for work in Toronto of which 17.2 per cent normally
spend over 60 minutes on their daily commute. By comparison, in Vancouver and Montreal, prior to the
pandemic only eight per cent of commuters spent over 60 minutes on their daily commute [10]. The higher
commuter time in Toronto negatively effects both GHG emissions and gross domestic product (GDP) across
one of the country’s most economically productive jurisdictions. Congestion causes direct economic losses
and is likely to continue doing so post-pandemic as economies open up and regular commuter travel resumes
to some degree. A 2008 study found the costs of congestion to the Greater Toronto and Hamilton Area
(GTHA) is C$6 billion annually. The per capita cost of congestion in Toronto and the GTHA are, thus, higher
than both New York and Chicago. Prior to the pandemic, those costs were predicted to rise higher [11].

CAVs can also reduce collisions and fatalities on roadways. Between 2013 and 2017, there have been
approximately 300 pedestrian fatalities per year on Canadian roads [12]. It is estimated that 94 per cent of
all vehicle collisions result from human error [2]. CAVs may eliminate the possibility of human error and
drastically reduce the number of pedestrian fatalities if widely deployed.

First-kilometre and last-kilometre connectivity for public transit systems is a global concern that agencies are
trying to solve. A lack of first-kilometre/last-kilometre connections is a key barrier to public transit adoption in
many major cities. Transit agencies operate on the basis that riders are less likely to use public transit if there
are no bus or train stations within a 20-minute walk of either a rider’s home or a major destination. Using
CAVs for transit in the form of e-LSAs presents an excellent opportunity to overcome first-kilometre/last-
kilometre applications by providing a flexible short-route service from suburban neighbourhoods to transit
hubs, or from transit hubs to popular destinations. Autonomous shuttles can offer economic, energy and
operational efficiencies in such situations. This is why transit agencies around world – such as the Regional
Transportation District (RTD) in Denver, Colorado, Trinity Metro in Fort Worth, Texas, Edmonton Transit
Service (ETS) in Edmonton, Alberta and the Toronto Transit Commission (TTC) – have either planned or
commissioned pilot projects to study the effects of AVs as first-kilometre/last-kilometre solutions and their
impact on public transit ridership [13].

CUTRIC-CRITUC Low-Carbon Smart Mobility Knowledge Series No. 3 2020 Edition 1.0
13

SECTION I: ENERGY CONSUMPTION
FEASIBILITY ANALYSIS
Objectives and Goals
The objective of this section is to highlight preliminary results of a feasibility analysis of e-LSA application
across nine different routes in nine Canadian municipal jurisdictions. Municipal staff and transit agency
representatives identified these specific routes as potentially suitable for e-LSA deployment. These routes
do not indicate the respective municipality’s intent to actually deploy an e-LSA along these routes. Instead,
they demonstrate the municipality’s interest in assessing the potential viability of these or similar routes from
an energy consumption and scheduling feasibility standpoint, as they consider various e-LSA manufacturers
for early-stage solutions for first-kilometre/last-kilometre mobility.

Energy consumption, state-of-charge (SOC) of the battery, and charging times are key characteristics
assessed in this feasibility analysis. These factors constitute critical considerations for e-LSA deployment
along given routes based on the technical specifications of varying battery packs, electric powertrains and
charging systems.

To assess characteristics and their implications for e-LSA applications, CUTRIC used its in-house predictive
analytic (physics-based) RoutΣ.iTM simulation tool.

This section consists of the following:

    •   A description of the selected routes and their corresponding first-kilometre/last-kilometre
        characteristics
    •   A description of the modelling methodology
    •   Modelling results and analysis

Route Selection Parameters and Processes
Starting in July 2018, CUTRIC has worked with nine municipal jurisdictions to select routes that fit the criteria
of a first-kilometre/last-kilometre e-LSA application. These cities include Vancouver, Surrey, Calgary,
Edmonton, Brampton, York Region, Trois-Rivières, Montreal and Quebec City. Identifying city-specific routes
took longer than originally forecasted due to political, educational and resource barriers.

As CUTRIC has learned, the selection of simulated routes – even if hypothetical – raised numerous
socioeconomic and transit-related questions that needed political and community engagement to resolve.
Politically, some municipalities required prolonged internal discussions to determine which route to select
based on several route-specific factors and limitations.

CUTRIC provided specific route-selection parameters to support the process. Within this project, e-LSA
application routes were to be no longer than two kilometres, since the goal of the project is to map first-
kilometre/last-kilometre mobility gaps. The selected routes must link to an existing transit stop or hub, but
possess no current or planned future transit (i.e. bus or light-rail transit) service. The route must include
sufficient road space to create a dedicated laneway for AV shuttles.

In sum, CUTRIC requested that routes identified followed these criteria:

CUTRIC-CRITUC Low-Carbon Smart Mobility Knowledge Series No. 3 2020 Edition 1.0
14
• The route should be a first-kilometre/last-kilometre application.
• The route should be approximately one to two kilometres long (this parameter was ultimately
rendered more flexible).
• The maximum road grade should not exceed six per cent, as per e-LSA manufacturer
recommendations, since this grade limit maximizes standing passenger comfort while travelling
up or down slopes (this parameter was exceeded in one circumstance).
• The route should be located on a path where it is feasible to build a dedicated laneway.
• The route should not currently operate any transit service.
Many municipal jurisdictions found it challenging to find a route that met these criteria. The biggest challenge
was identifying roadways that possess enough space for a dedicated laneway for the shuttle, should such a
requirement continue to be necessary for the effective deployment of shuttles that do not operate optimally
in mixed traffic conditions.
Some municipalities in the CUTRIC consortium were hesitant to share their determined route because of
public risk aversion. These cities were concerned that in simply modelling a given or hypothetical route,
citizens may expect them to actually apply e-LSAs to those routes, which might lead to unexpected and
premature public debate or backlash with regards to AV deployments by the city in general.
From an educational standpoint, some cities were unclear on what constitutes an actual first-kilometre/last-
kilometre route. Additionally, some city and transit staff who selected routes for this study did not adequately
understand the limitations of e-LSA speed and torque. As a result, some routes they initially provided were
much longer compared with a strictly defined first-kilometre/last-kilometre route, while others were routed
along very hilly terrains that the vehicles could not support. These staff, therefore, required additional insights
and education by CUTRIC to ensure that the route requirements were well understood before they could be
effectively selected for simulation purposes.
The resulting nine routes eventually selected by each city, along with their associated route profiles and
characteristics, are shown in Table 1.
CUTRIC-CRITUC Low-Carbon Smart Mobility Knowledge Series No. 3 2020 Edition 1.015
Table 1. Route maps and associated characteristics.
Route map Characteristics
Route Location: Calgary, Alberta, between the
Calgary Zoo and the Telus Spark Science Centre
Route Designation: CAL
Route Length: 566 m
Maximum Road Grade: 7.7%
Average Road Grade: 1.8%
Identified By: City of Calgary
Number of Stops: Two (one at each end)
First-Kilometre/Last-Kilometre Application: Yes
Reasons for Picking this Route: The Calgary Zoo
LRT station is located about 800 metres away
from the entrance of the Science Centre. The
two are separated by a large parking lot, which is
not convenient for pedestrians to walk across.
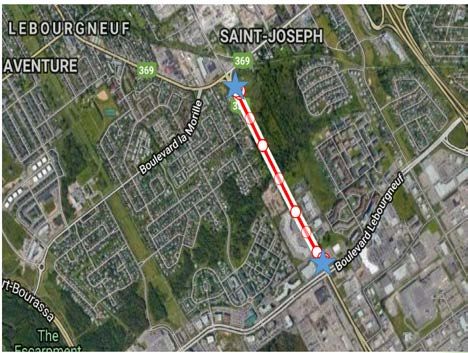
Route Location: Trois-Rivières, Québec
Route Designation: TR
Route Length: 2.05 km
Maximum Road Grade: 4.3%
Average Road Grade: 1.0%
Identified By: Société de Transport de Trois-
Rivières (STTR)
Number of Stops: Two (one at the start/end and
a second stop at the middle of the route.)
First-Kilometre/Last-Kilometre Application: Yes
Reasons for Picking this Route: STTR wants to link
the neighbourhood shown to the main route
where transit is available.
CUTRIC-CRITUC Low-Carbon Smart Mobility Knowledge Series No. 3 2020 Edition 1.016
Route map Characteristics
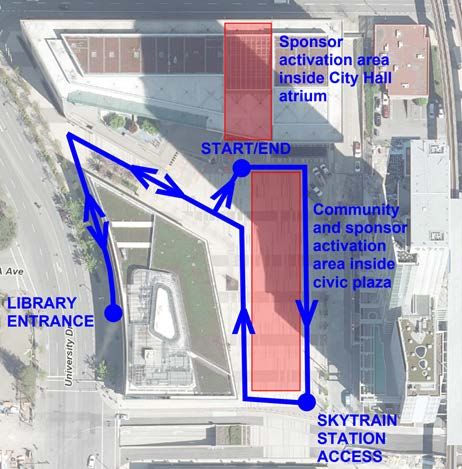
Route Location: Surrey, British Columbia
Route Designation: SR
Route Length: 507 m
Maximum Road Grade: 2.4%
Average Road Grade: 0.7%
Identified By: City of Surrey
Number of Stops: Three (one at the start/end
point, a second stop at the SkyTrain station, and
a third at the library entrance)
First-Kilometre/Last-Kilometre Application: Yes
Reasons for Picking this Route: This is the route
where Surrey deployed an e-LSA as a two-week
pilot project.
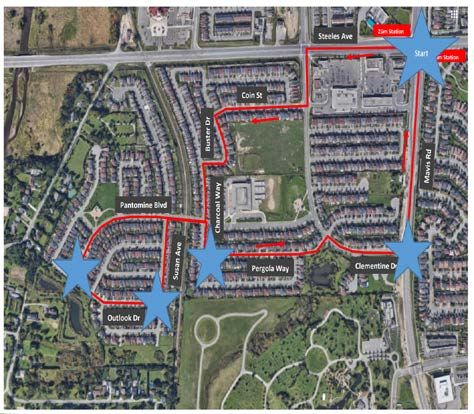
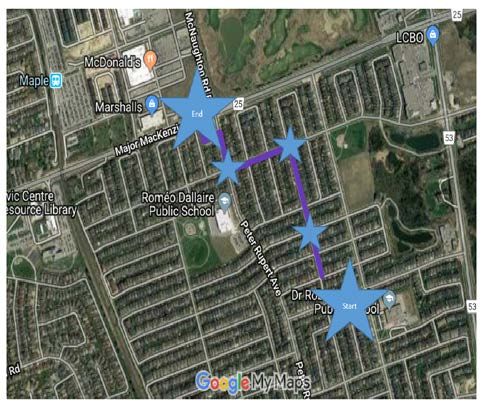
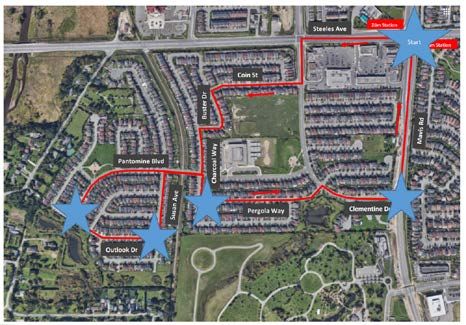
Route Location: Brampton, Ontario
Route Designation: BR
Route Length: 3.61 km
Maximum Road Grade: 5.9%
Average Road Grade: 1.8%
Identified By: Brampton Transit
Number of Stops: Five (one at the start/end (Zum
station) and four along the route, as indicated by
the blue stars)
First-Kilometre/Last-Kilometre Application: Yes
Reasons for Picking this Route: This route links a
major Zum station to a nearby neighbourhood
that has little transit available.
CUTRIC-CRITUC Low-Carbon Smart Mobility Knowledge Series No. 3 2020 Edition 1.017
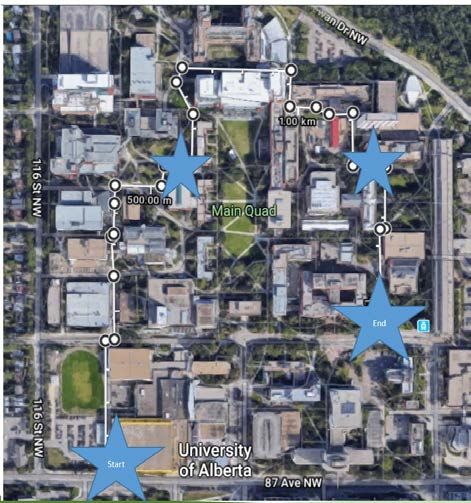
Route map Characteristics
Route Location: University of Alberta, Edmonton,
Alberta
Route Designation: UA
Route Length: 1.46 km
Maximum Road Grade: 9.0%
Average Road Grade: 3.8%
Identified By: City of Edmonton
Number of Stops: Four (one at the start point, one
at the end point, and two additional stops along
the route as indicated by blue stars)
First-Kilometre/Last-Kilometre Application: Yes
Reasons for Picking this Route: This route goes
through the University of Alberta campus where
transit is not easily accessible.
Route Location: Vancouver, British Columbia
Route Designation: VAN
Route Length: 1.6 km
Maximum Road Grade: 9.2%
Average Road Grade: 2.0%
Identified By: City of Vancouver
Number of Stops: Two (one at the start point and
the second at the end point)
First-Kilometre/Last-Kilometre Application: Yes
Reasons for Picking this Route: This is the route
where an e-LSA was deployed during
Vancouver’s pilot project. It links a major
intersection to a SkyTrain station.
CUTRIC-CRITUC Low-Carbon Smart Mobility Knowledge Series No. 3 2020 Edition 1.018
Route map Characteristics
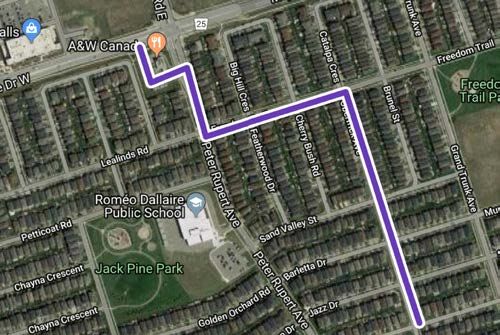
Route Location: York Region, Ontario
Route Designation: YR
Route Length: 986 m
Maximum Road Grade: 7.7%
Average Road Grade: 2.3%
Identified By: York Region Transit
Number of Stops: Five (one at the start, one at
the end point, and three along the route, as
indicated by blue starts)
First-Kilometre/Last-Kilometre Application: Yes
Reasons for Picking this Route: This route links the
Maple GO Station to its nearest neighbourhood.
YRT conducted a survey identifying that most of
the cars parked in the Maple GO Station parking
lot were travelling from less than five kilometres
away.
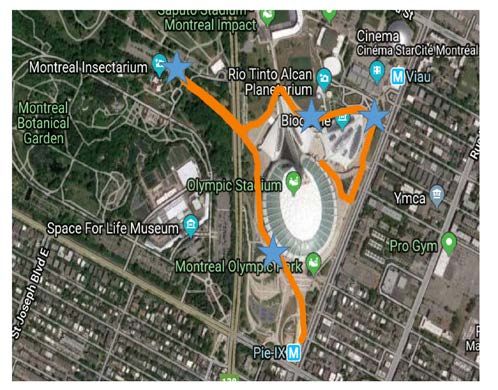
Route Location: Montreal, Quebec
Route Designation: MTL
Route Length: 2.25 km
Maximum Road Grade: 9.4%
Average Road Grade: 2.7%
Identified By: Parc Olympique
Number of Stops: Six (one at the start and one at
the end point, with four additional stops on route
as shown by blue stars)
First-Kilometre/Last-Kilometre Application: Yes
Reasons for Picking this Route: This route links
several key tourist attractions from the two metro
stations, Viau and Pie IX.
Route Location: Quebec City, Quebec
Route Designation: QC
Route Length: 1.21 km
Maximum Road Grade: 8.5%
Average Road Grade: 3.2%
Identified By: RTC
Number of Stops: Two (one at the start point and
one at the end point)
First-Kilometre/Last-Kilometre Application: No
Reasons for Picking this Route: This route links two
existing parallel transit lines that are not currently
served by a connecting transit service.
CUTRIC-CRITUC Low-Carbon Smart Mobility Knowledge Series No. 3 2020 Edition 1.019
Introduction to CUTRIC’s RoutΣ.iTM Simulation Tool
CUTRIC’s RoutΣ.i tool is a predictive analytical tool developed by modelling and data scientists at CUTRIC.
The simulation tool is able to predict the performance of various e-LSA and e-charger models applied to
specific routes. The tool models detailed electrical drivetrain, along with its interactions, to obtain the
powertrain efficiency on a second-by-second basis.
Three different duty cycles are designed to simulate different operating scenarios. The scenarios include
light-duty cycle, medium-duty cycle and heavy-duty cycle, to consider low energy usage, average energy
usage and extreme energy usage scenarios. The details of the three duty cycles are:
1. Light-duty cycle: the vehicle has no passengers onboard and no auxiliary capacity (e.g. heating or
cooling)
2. Medium-duty cycle: the vehicle has half its passenger capacity with half of the maximum auxiliary
turned on
3. Heavy-duty cycle: the vehicle is at its maximum passenger capacity with its maximum auxiliary load
capacity
These three duty-cycles help to assess the intensity of energy consumption for electric vehicles under
different conditions. They also help transit agencies to plan for the most extreme-use-case or worst-case
scenarios.
Modelling Inputs and Assumptions
CUTRIC used one e-LSA model vehicle in the simulation for analysis. Here is some basic information of the
simulated vehicle:
• The maximum passenger capacity of the vehicle is 22 passengers.
• The vehicle has a powerful motor to keep the vehicle running on challenging roads with heavy-duty
cycle.
• The vehicle uses an automated on-route 90 kW charger, which allows the vehicle to remain on the
route for a long operation time or even for 24-hour continuous operation.
Table 2 lists the main assumptions used in the modelling work.
Table 2. General assumptions applied in the modelling work.
General Assumptions
1 The maximum speed of the shuttle is 20 km/h.
The shuttle stays for 10 seconds at all stops for passengers to get on and off the
2
shuttle.
3 Each passenger’s weight is 75 kg.
4 The charger power and efficiency do not fluctuate in use.
Modelling Methodology
This section describes CUTRIC’s modelling methodology and provides some of the main inputs gathered
from partner manufacturers to achieve the following outcomes:
• Generate speed profiles on the selected routes
• Generate a topography profile on the selected routes
CUTRIC-CRITUC Low-Carbon Smart Mobility Knowledge Series No. 3 2020 Edition 1.020
• Calculate the energy consumption of the e-LSAs along the routes
Speed and Topography Profile Generation
Once a route was identified as potentially suitable for an e-LSA application, the route path was drawn in
MyMaps (https://www.google.com/maps/) and imported into ArcGIS software for generating route profiles
and speed profiles. Then CUTRIC identified all traffic impediments and stop points along the routes from
satellite images, as shown in Figure 1 and Figure 2 below.
Figure 1. Example of path definition in MyMaps.
Figure 2. Example of stop definition along routes.
To identify the topography of routes, the GIS team downloaded the digital elevation model (DEM)
(https://earthexplorer.usgs.gov/) of all the regions to obtain the elevation value associated with the selected
routes and other road elements along with each route. It is important to note that all available DEM data that
CUTRIC collected from open sources for each region is either 30-metre or 60-metre precision. Therefore,
there could be some elevation spikes and outliers that do not represent real-world characteristics of routes.
Once the elevation profile was generated, the road grade was estimated from the horizontal and vertical
distances. A subsequent second-by-second speed profile was then generated, accounting for the posted
speed limit of the route. For this analysis, the vehicles' maximum speed was assumed to be 20 km/h because
this is the current safe operating speed demonstrated by e-LSAs in global trials relative to the performance
and speed of automated sensory system technologies (i.e. LiDAR, radar, ultrasonic sensors). To note, the
shuttle engines can propel the vehicles up to speeds of 60 km/h at a zero per cent road grade. Therefore,
CUTRIC-CRITUC Low-Carbon Smart Mobility Knowledge Series No. 3 2020 Edition 1.021 speed limitations do not generally arise from the e-LSA powertrain, but rather from the automated technologies’ capabilities onboard that support visualization (i.e. automation) and connectivity. Figure 3 and Figure 4 show an example of the profiles generated by the RoutΣ.iTM tool for the York Region route’s forward and reverse directions. Figure 5 shows an example of the profiles for Vancouver’s loop- shaped route. Due to the GIS data limitation, the elevation and grade profiles can vary from the actual values, resulting in lower accuracy. Figure 3. Simulated profiles for York Region route, forward direction. Figure 4. Simulated profiles for York Region route, reverse direction. CUTRIC-CRITUC Low-Carbon Smart Mobility Knowledge Series No. 3 2020 Edition 1.0
22

Figure 5. Simulated profiles for Vancouver route, loop-shaped.

The route profiles show that the chosen routes have either loop shapes, such as Vancouver, or non-loop
shapes, like York Region. The non-loop routes require the shuttle to run in both forward and backward
directions, resulting in different energy usage. Thus, the non-loop shape will require round trips to capture
the whole energy usage for the route, while loop shapes need one direction. Table 3 lists the shapes of all
routes.

Table 3. The shapes of chosen routes, either loops or non-loops (round trip).
      Route         Loop or Round Trip                               Calculation
       CAL              Round trip            Average of forward and reverse direction
       TR                 Loop                Only forward direction
       SR                 Loop                Only forward direction
       BR                 Loop                Only forward direction
       UA               Round trip            Average of forward and reverse direction
      VAN                 Loop                Only forward direction
       YR               Round trip            Average of forward and reverse direction
      MTL               Round trip            Average of forward and reverse direction
       QC               Round trip            Average of forward and reverse direction

Results of the Feasibility Study
Energy Consumption Results

The energy consumption, in kWh/km, measures the performance of the vehicle specific to the route profiles,
passenger loads, and auxiliary conditions. The energy consumption data are shown in Table 4. Figure 6
provides a visual representation of this variation. The energy consumption results show that there are
noticeable discrepancies among different routes. The number of stops and road grades are the two main
factors that influence the shuttle's energy efficiency. For example, The UA and the YR routes are the least
energy-efficient routes due to their relatively high average road grades and many stops on the road. On the
other hand, the TR route has the most efficient route due to almost flat roads and only one stop in the middle
of the route. The fact that the individual route's topography affects the energy efficiency supports the claim

CUTRIC-CRITUC Low-Carbon Smart Mobility Knowledge Series No. 3 2020 Edition 1.0
23
that it is crucial to use a route-based modelling tool to better capture actual road topographies and predict
more precise vehicle performance ranges.
Table 4. Energy efficiency (kWh/km) of the vehicle.
Route Light-Duty Cycle Medium-Duty Cycle Heavy-Duty Cycle
CAL 0.22 0.49 0.75
TR 0.18 0.43 0.69
SR 0.29 0.66 1.02
BR 0.24 0.57 0.91
UA 0.34 0.72 1.11
VAN 0.22 0.52 0.81
YR 0.31 0.70 1.10
MTL 0.32 0.64 0.95
QC 0.29 0.56 0.82
Figure 6. Variations in medium-duty cycle energy consumption results for the vehicle.
The total kWh/km per passenger, shown in Figure 7, is a relative comparative metric for the vehicle. Note:
as no passenger is on board for the light-duty cycle, the figure only shows medium and heavy-duty cycle
results. The vehicle under heavy-duty cycle consumes more energy in total than medium-duty cycle on a per
kilometre basis, but uses less energy than medium-duty cycle on a per passenger per kilometre basis.
CUTRIC-CRITUC Low-Carbon Smart Mobility Knowledge Series No. 3 2020 Edition 1.024
Figure 7. The vehicle’s energy efficiency on a per kilometre and per passenger basis for medium and heavy-
duty cycles.
State-of-Charge and Charging-Time Results
The state-of-charge (SOC) of a battery measures the remaining energy stored in the battery. The SOC is
affected by battery chemistry and battery management systems. The vehicle’s manufacturer requires the
shuttle to operate within a specific SOC range, i.e., between 20 and 90 per cent, to maintain the battery’s
health and prevent excessive battery degradation. If the battery depletes to the minimum SOC limit of 20 per
cent, the vehicle would theoretically require 18 minutes to fully recharge to 90 per cent SOC using its 90 kW
on-route charging system.
Table 5 shows the energy usage for completing one loop or a round trip of the routes. Figure 8 shows the
remaining SOC level after the shuttle completes a loop trip or round trip. The SOC is lowest in heavy-duty
cycle due to the highest passenger load and auxiliary load applied to the heavy-duty cycle. The Montreal
route uses the most energy due to its long distance, multiple stops and relatively hilly road.
Table 5. Energy usage (kWh) for completing one loop or round trips.
Route Light-Duty Cycle Medium-Duty Cycle Heavy-Duty Cycle
CAL 0.25 0.55 0.85
TR 0.37 0.89 1.42
SR 0.15 0.33 0.52
BR 0.86 2.07 3.28
UA 0.99 2.12 3.25
VAN 0.36 0.83 1.31
YR 0.61 1.38 2.16
MTL 1.45 2.88 4.30
QC 0.63 1.21 1.80
CUTRIC-CRITUC Low-Carbon Smart Mobility Knowledge Series No. 3 2020 Edition 1.025
Figure 8. SOC level after shuttle completes one loop or round trip of the routes.
Table 6 lists the charging times required for each shuttle after a loop or a round trip. The results show that
the vehicle could use the time when passengers get on and off the shuttle at the terminal to charge the
battery. As all routes’ charging times are equal or below three minutes, it means that one three-minute
charging episode for each loop or round trip will allow the shuttle to operate 24 hours continuously. As the
heavy-duty scenario only happens during a short period of a day, most of the episodes will use much less
than three minutes.
Table 6. Charging time for the various vehicles after completing a loop or round-trip.
Charging Time in Minutes (90 kW on-Route Charger)
Route Light-Duty Cycle Medium-Duty Cycle Heavy-Duty Cycle
CAL 0.2 0.4 0.6
TR 0.3 0.6 1.0
SR 0.1 0.2 0.4
BR 0.6 1.5 2.3
UA 0.7 1.5 2.3
VAN 0.3 0.6 0.9
YR 0.4 1.0 1.5
MTL 1.0 2.0 3.0
QC 0.4 0.9 1.3
Creation of a Schedule
This section provides a fixed schedules design for illustrative purposes and should be revised based on local
circumstances and future transit needs. The designed fixed schedules here can show the performance of
the shuttles and assist the transit agencies in making better decisions in the future.
Table 7 shows the simulated time for completing a loop or a round trip of the routes. Each loop or round trip
should include an extra three minutes to take account of the time required for on-route charging.
CUTRIC-CRITUC Low-Carbon Smart Mobility Knowledge Series No. 3 2020 Edition 1.026
Table 7. Simulated time for completing a loop or round trip.
Minutes (Not Including
Minutes (Including On-
Route Loop or Round Trip On-Route Charging
Route Charging Time)
Time)
CAL Round trip 3.7 6.7
TR Loop 6.7 9.7
SR Loop 2.4 5.4
BR Loop 15.4 18.4
UA Round trip 13.9 16.9
VAN Loop 6.0 9.0
YR Round trip 9.8 12.8
MTL Round trip 16.9 19.9
QC Round trip 6.9 9.9
For the CAL route, a special schedule is created based on the operating hours of both the Calgary Zoo and
the Telus Spark Science Centre. The Calgary Zoo is open daily between 9 a.m. and 5 p.m. MST, and the
Telus Spark Science Centre is open daily between 10 a.m. and 4 p.m. MST. Therefore, it is assumed this
route operates eight hours daily from 9 a.m. to 5 p.m. As the time for a round trip time is less than 10 minutes,
as shown in Table 7, CUTRIC designs the frequency for this route as every 10 minutes. Thus, the CAL shuttle
should complete 48 round trips per day based on this schedule.
A more general schedule is created for the remaining routes, assuming 13 hours of operation. If the route
requires less than 15 minutes to complete, the shuttle leaves the starting point every 15 minutes. For routes
requiring more than 15 minutes but less than 20 minutes to complete, the shuttle leaves every 20 minutes
from the starting location. For the less-than-15 minutes case, the shuttle should be able to complete 52 loops
or round trips per day. For more-than-15-minutes case, the shuttles should be able to complete 39 loops or
round trips per day. When there are on-route chargers available, there is no problem for the vehicle to
complete all of the trips. However, it is a different story if the on-route chargers are not available, i.e., if only
the depot has the charger.
Round Trips Completed Before Recharge Required
Table 8 compares the scheduled daily number of trips with the maximum number of loops or round trips the
modelled shuttle can complete if an on-route charger is not available. (Note: the energy used by the auxiliary
load during passengers onboard and offboard is not included.) The values of the routes where the shuttles
can complete the daily schedules are shown in green. For most of the cases, the shuttles cannot complete
the designed number of trips per day. Therefore, it is recommended to either have on-route chargers on the
road, or reduce the frequency of the service and use an on-demand service instead of a fixed schedule.
CUTRIC-CRITUC Low-Carbon Smart Mobility Knowledge Series No. 3 2020 Edition 1.027
Table 8. Maximum number of loops or round trips if an on-route charger is not available based on simulation
results. Note the numbers in green indicate the vehicle is able to complete the designed daily service.
Scheduled No. of Medium-Duty
Route Light-Duty Cycle Heavy-Duty Cycle
Trips Cycle
CAL 48 101 46 30
TR 52 69 28 18
SR 52 176 77 49
BR 39 29 12 7
UA 39 26 12 7
VAN 52 71 30 19
YR 52 42 18 11
MTL 39 17 8 5
QC 52 40 21 14
Table 9 outlines the total service time each e-LSA would be available on each route based on the number of
round trips the shuttle can perform before depleting the battery to minimum SOC. (Note: the time for on-route
charging is not included.) The time is much shorter than the designed schedule, meaning it is necessary to
have on-route chargers available for the shuttle.
Table 9. Simulation results of e-LSA’s total service time before depleting the battery to a minimum SOC and
requiring a recharge.
Route Light-Duty Cycle Medium-Duty Cycle Heavy-Duty Cycle
CAL 5.9 hours 2.8 hours 1.8 hours
TR 7.7 hours 3.1 hours 2.0 hours
SR 7.0 hours 3.1 hours 2.0 hours
BR 7.4 hours 3.1 hours 1.8 hours
UA 6.0 hours 2.8 hours 1.6 hours
VAN 6.9 hours 3.0 hours 1.9 hours
YR 6.9 hours 2.9 hours 1.8 hours
MTL 4.8 hours 2.3 hours 1.7 hours
QC 4.7 hours 2.4 hours 1.6 hours
The assumptions made in scheduling shuttles should be revised based on local circumstances and future
transit needs. For example, some projects in Europe do not deploy shuttles with fixed schedules, but rather
use variable on-demand schedules. Typically, a larger number of shuttles are in service during peak
commuting hours, while lower numbers are in service during mid-day low off-peak periods (e.g. congestion
or peak-period relief). A similar approach can be used for this analysis in the future.
Conclusions and Future Steps
This section has highlighted the e-LSA shuttle’s performance results for nine chosen routes across Canada,
which are identified by transit agencies and municipalities as potential candidates for e-LSA demonstration
projects. These routes are currently not mixed with traffic as the operating speed of the shuttle is only about
20 km/h. The simulation results show that if one three-minute on-route charging episode is allowed for each
loop, or round trip, the shuttle can operate 24 hours continuously. Allowing 24-hour continuous operation is
the advantage of using on-route chargers.
The number of shuttles required on a route will depend on the desired frequency of service, length of route
and required charging times. Predictive analysis of route completion time will help ensure the schedule allows
CUTRIC-CRITUC Low-Carbon Smart Mobility Knowledge Series No. 3 2020 Edition 1.028 for adequate buffer time for route completion, rider boarding and alighting, as well as charging times. If a higher schedule frequency is desired, additional shuttles may be required. Depending on route requirements, shuttle scheduling should be optimized to provide a higher frequency service during peak hours and lower frequency during non-peak hours. In many instances, providing an on- demand e-LSA offering would optimize the service. On-demand service can be used for the whole day or, alternatively, a fixed schedule can be deployed during on-peak hours and an on-demand service used during off-peak hours. The optimal solution depends on the jurisdiction and route. Charging schedules should also be optimized to minimize demand charges and the potential constraints of certain charging systems (e.g. the requirement of shuttles to return to a depot to recharge during the day). The location of the charging infrastructure is critical to the service availability of a shuttle. It is often suggested that charging systems should be located as close as possible to the route. For a long route with heavy-duty usage, it is recommended to have on-route chargers to extend the operation time. Further discussions are required with the manufacturers to obtain actual operation data to verify the reliability and validity of the model prediction. CUTRIC-CRITUC Low-Carbon Smart Mobility Knowledge Series No. 3 2020 Edition 1.0
29

SECTION II: TRANSIT RIDERSHIP IMPACT
ANALYSIS
This section outlines the methodology and preliminary transit ridership impact analysis results for first-
kilometre/last-kilometre e-LSA applications identified as part of this project.

Methodologically, this process begins with an overview of a standard four-step modelling framework that
explores the impact of e-LSAs on transit ridership. As there are no primary or secondary data sets available
at the time of writing this report, CUTRIC has chosen to explore three case studies based on a predetermined
set of assumptions to examine how, and to what degree, e-LSAs could improve transit ridership and reduce
car usage. CUTRIC has developed two independent assumptions and four scenarios to enable further
analysis of e-LSAs’ impact on transit ridership.

    1. The first assumption addresses an increase in the percentage of transit ridership as a result of
       introducing e-LSAs into the current system based on the four-step transportation model explained
       below.
    2. The second assumption deals with the percentage of transit riders who will be using shuttles to get
       to an associated transit station.

Four-Step Transportation Model
The four-step transportation model consists of trip generation, trip distribution, mode split and              traffic
assignment [14].

Trip generation predicts the number of trips produced from each traffic zone, typically as a function of
socioeconomic characteristics.

Trip distribution predicts the routes of selected trips. (The four-step model links the origin and destination
points produced by the trip generation model.)

Mode split predicts the proportion of trips made by each mode of travel between the origin and destination.
Mode choice is often based on the concept of utility, where travelers choose the modes that maximize their
utility functions [15]. The utility function in this case defines travellers’ preferences for a given set of available
travel modes and is typically calculated based on travellers’ socioeconomic characteristics and attributes of
available modes [16].

Traffic assignment predicts which route is used during the trip, which is also calculated using the utility
function, given travel time and cost measures, as well as travel system conditions (e.g. user equilibrium) [17].

This subsection examines primary factors active in determining each step of the four-step transportation
model. CUTRIC explores how e-LSAs could potentially impact each of these steps and their resulting effects
on transit demand.

Trip Generation

With e-LSAs in operation, disabled, elderly and those without a driver’s licence who cannot drive or walk to
transit stations may realize a new way of accessing the transit system, hence increasing the number of trips
generated [18].

CUTRIC-CRITUC Low-Carbon Smart Mobility Knowledge Series No. 3 2020 Edition 1.0
You can also read