On the Utility of Audiovisual Dialog Technologies and Signal Analytics for Real-time Remote Monitoring of Depression Biomarkers
←
→
Page content transcription
If your browser does not render page correctly, please read the page content below
On the Utility of Audiovisual Dialog Technologies and Signal Analytics for
          Real-time Remote Monitoring of Depression Biomarkers

Michael Neumann∗ , Oliver Roesler∗ , David Suendermann-Oeft∗ and Vikram Ramanarayanan∗†
                                      ∗
                                        Modality.ai, Inc.
                           †
                             University of California, San Francisco
                       vikram.ramanarayanan@modality.ai

                       Abstract                                     We developed NEMSI (Suendermann-Oeft et al.,
      We investigate the utility of audiovisual dia-             2019), or the NEurological and Mental health
      log systems combined with speech and video                 Screening Instrument, to bridge this gap. NEMSI
      analytics for real-time remote monitoring of               is a cloud-based multimodal dialog system that
      depression at scale in uncontrolled environ-               conducts automated screening interviews over the
      ment settings. We collected audiovisual con-               phone or web browser to elicit evidence required
      versational data from participants who inter-              for detection or progress monitoring of the afore-
      acted with a cloud-based multimodal dialog
                                                                 mentioned conditions, among others. While in-
      system, and automatically extracted a large set
      of speech and vision metrics based on the rich
                                                                 telligent virtual agents have been proposed in ear-
      existing literature of laboratory studies. We              lier work for such diagnosis and monitoring pur-
      report on the efficacy of various audio and                poses, NEMSI makes novel contributions along
      video metrics in differentiating people with               three significant directions: First, NEMSI makes
      mild, moderate and severe depression, and dis-             use of devices available to everyone everywhere
      cuss the implications of these results for the             (web browser, mobile app, or regular phone), as op-
      deployment of such technologies in real-world              posed to dedicated, locally administered hardware,
      neurological diagnosis and monitoring applica-
                                                                 like cameras, servers, audio devices, etc. Second,
      tions.
                                                                 NEMSI’s backend is deployed in an automatically
  1   Introduction                                               scalable cloud environment allowing it to serve an
                                                                 arbitrary number of end users at a small cost per
  Diagnosis, detection and monitoring of neurologi-
                                                                 interaction. Thirdly, the NEMSI system is natively
  cal and mental health in patients remain a critical
                                                                 equipped with real-time speech and video analyt-
  need today. This necessitates the development of
                                                                 ics modules that extract a variety of features of
  technologies that improve individuals’ health and
                                                                 direct relevance to clinicians in the neurological
  well-being by continuously monitoring their status,
                                                                 and mental spaces.
  rapidly diagnosing medical conditions, recogniz-
  ing pathological behaviors, and delivering just-in-               A number of recent papers have investigated au-
  time interventions, all in the user’s natural informa-         tomated speech and machine vision features for
  tion technology environment (Kumar et al., 2012).              predicting severity of depression (see for exam-
  However, early detection or progress monitoring of             ple France et al., 2000; Joshi et al., 2013; Meng
  neurological or mental health conditions, such as              et al., 2013; Jain et al., 2014; Kaya et al., 2014;
  clinical depression, Amyotrophic Lateral Sclerosis             Nasir et al., 2016; Pampouchidou et al., 2016; Yang
  (ALS), Alzheimer’s disease, dementia, etc., is of-             et al., 2017). These include speaking rate, duration,
  ten challenging for patients due to multiple reasons,          amplitude, and voice source/spectral features (fun-
  including, but not limited to: (i) lack of access to           damental frequency (F0), amplitude modulation,
  neurologists or psychiatrists; (ii) lack of awareness          formants, and energy/power spectrum, among oth-
  of a given condition and the need to see a special-            ers) computed from the speech signal, and facial
  ist; (iii) lack of an effective standardized diagnostic        dynamics (for instance, landmark/facial action unit
  or endpoint for many of these health conditions;               motions, global head motion, and eye blinks) and
  (iv) substantial transportation and cost involved in           statistically derived features from emotions, action
  conventional or traditional solutions; and in some             units, gaze, and pose derived from the video sig-
  cases, (v) shortage of medical specialists in these            nal. We use these studies to inform our choices of
  fields to begin with (Steven and Steinhubl, 2013).             speech and video metrics computed in real time,

                                                            47
                     Proceedings of the 1st Workshop on NLP for Medical Conversations, pages 47–52
                           Online, 10, 2020. c 2020 Association for Computational Linguistics
                                             https://doi.org/10.18653/v1/P17
allowing clinicians to obtain useful analytics for image also appears in a web window. Users are
their patients moments after they have interacted also able to see their own video, if so needed, in
with the NEMSI dialog system. a small window in the upper right corner of the
We need to factor in additional considerations screen. The virtual agent then engages with users in
while deploying analytics modules as part of scal- a conversation using a mixture of structured speak-
able real-time cloud-based systems in practice. ing exercises and open-ended questions to elicit
Many of the studies above analyzed data recorded speech and facial behaviors relevant for the type of
either offline or in laboratory conditions, implicitly condition being screened for.
assuming signal conditions which may hold differ- Analytics modules extract multiple speech (for
ently or not at all during real world use. These con- instance, speaking rate, duration measures, F0, etc.)
siderations include, but are not limited to: (i) wide and video features (such as range and speed of
range of acoustic environments and lighting con- movement of various facial landmarks) and store
ditions resulting in variable background noise and them in a database, along with information about
choppy/blocky video at the user’s end1 , (ii) limita- the interaction itself such as the captured user
tions on a given user’s network connection band- responses, call duration, completion status, etc.
width and speed; (iii) the quantum of server traffic All this information can be accessed by the clini-
(or the number of patients/users trying to access the cians after the interaction is completed through an
system simultaneously); and (iv) device calibration easy-to-use dashboard which provides a high-level
issues, given the wide range of user devices. This overview of the various aspects of the interaction
paper investigates the utility of a subset of audio (including the video thereof and analytic measures
and video biomarkers for depression collected us- computed), as well as a detailed breakdown of the
ing the NEMSI dialog system in such real-world individual sessions and the underlying interaction
conditions. turns.
The rest of this paper is organized as follows:
Sections 2 and 3 first present the NEMSI dialog 3 Data
system and the data collected and analyzed. Sec-
tion 4 then details the speech and video feature Depending on the health condition to be monitored
extraction process. Section 5 presents statistical and on the clinician’s needs, different protocols
analyses of different groups of depression cohorts can easily be employed in the NEMSI system. For
as determined by the reported PHQ-8 score, before the present study, we designed a protocol target-
Section 6 rounds out the paper, discussing the im- ing the assessment of depression severity, based
plications of our observations for real-world mental on (Mundt et al., 2007). The protocol elicits five
health monitoring systems. different types of speech samples from participants
that are consistently highlighted in the literature:
2 System (a) free speech (open-ended questions about sub-
jects’ emotional and physical state), (b) automated
2.1 NEMSI dialog ecosystem speech (counting up from 1), (c) read speech, (d)
NEMSI (NEurological and Mental health Screen- sustained vowels, and (e) measure of diadochoki-
ing Instrument) is a cloud-based multimodal dialog netic rate (rapidly repeating the syllables /pa ta ka/).
system. Refer to Suendermann-Oeft et al. (2019) After dialog completion, participants are asked
for details regarding the system architecture and to answer the Patient Health Questionnaire eight-
various software modules. item depression scale (PHQ-8), a standard scoring
NEMSI end users are provided with a website system for depression assessment (Kroenke et al.,
link to the secure screening portal as well as lo- 2009). The self-reported PHQ-8 score serves as a
gin credentials by their caregiver or study liaison reference point for our analysis. Further, we ask
(physician or clinic). Once appropriate microphone for information about age, sex, primary language
and camera checks that the captured audio and and residence.
video are of sufficient quality are complete, users In total, we collected data from 307 interactions.
hear the dialog agent’s voice and are prompted to After automatic data cleaning2 , 208 sessions re-
start a conversation with the agent, whose virtual
2
We removed interactions for which PHQ-8 answers or
1
Such conditions often arise despite explicit instructions relevant speech metrics were missing and sessions for which
to the contrary. no face was detected in the video
48mained for analysis. From those 208 participants, Cutpoint Free speech Held Vowels
(group sizes)
98 were females, 97 were males and 13 did not
5 (127/81) Percent pause Volume (a,f), HNR (m),
specify. Mean participant age is 36.5 (SD = 12.1). time (a,f) Mean F0 (m)
184 participants specified English as their primary 10 (168/40) - Jitter (f)
language, 9 other languages and 15 did not spec- 15 (193/15) Volume (a,f,m) Mean F0 (a),
ify. 176 participants were located in the US, 8 in Volume (f)
the UK, 5 in Canada, 4 in other countries and 15
Table 1: Speech metrics for which a statistically signifi-
did not specify. Figure 1 shows the distribution of cant (p < 0.05) difference between sample populations
PHQ-8 scores among women and men. is observed. In parentheses: f - females, m - males,
a - all.
Free Read Auto- Held DDK
speech speech mated vowels
SpRate !
ArtRate !
SylRate !
PPT ! ! !
Mean F0 !
Jitter !
HNR !
Volume ! ! ! ! !
Shimmer !
Table 2: Speech metrics for each type of speech sample.
Figure 1: Distribution of PHQ-8 scores by gender. SpRate = speaking rate, ArtRate = articulation rate, Syl-
Rate = syllable rate, PPT = percent pause time, DDK =
dysdiadochokinesia.
4 Signal Processing and Metrics
Extraction 4.2 Visual Metrics
For each utterance, 14 facial metrics were calcu-
4.1 Speech Metrics
lated in three steps: (i) face detection, (ii) facial
For the speech analysis, we focus on timing mea- landmark extraction, and (iii) facial metrics calcula-
sures, such as speaking rate and percentage of tion. For face detection, the Dlib3 face detector was
pause duration, frequency domain measures, such employed, which uses 5 histograms of oriented gra-
as fundamental frequency (F0) and jitter, and dients to determine the (x, y)-coordinates of one or
energy-related measures, such as volume and shim- more faces for every input frame (Dalal and Triggs,
mer. We have selected commonly established 2005). For facial landmark detection the Dlib facial
speech metrics for clinical voice analysis (France landmark detector was employed, which uses an
et al., 2000; Mundt et al., 2012, 2007). ensemble of regression trees proposed by Kazemi
As described in Section 3, there are different and Sullivan (2014), to extract 68 facial landmarks
types of speech samples, e.g. free speech and sus- according to MultiPIE (Gross et al., 2010). Fig-
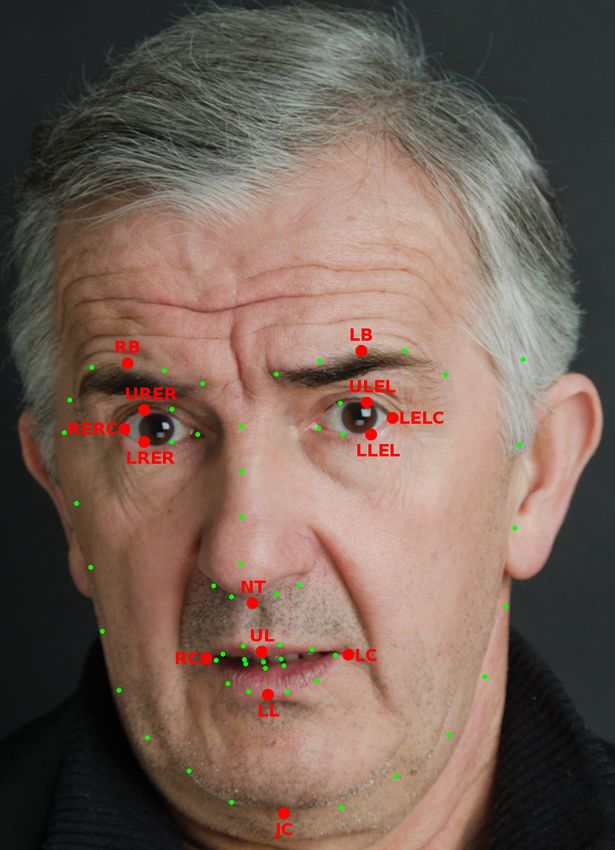
tained vowels. Not all acoustic measures are mean- ure 2 illustrates the 14 facial landmarks: RB (right
ingful for each type of stimuli. Table 2 presents all eyebrow), URER (right eye, upper right), RERC
extracted metrics for the particular speech sample (right eye, right corner), LRER (right eye, lower
types. right), LB (left eyebrow), ULEL (left eye, upper
All metrics are extracted with Praat (Boersma left), LELC (left eye, left corner), LLEL (left eye,
and Van Heuven, 2001). For the following mea- lower left), NT (nose tip), UL (upper lip center),
sures, heuristics have been used to ignore ob- RC (right corner of mouth), LC (left corner of
vious outliers in the analysis: articulation rate mouth), LL (lower lip center), and JC (jaw cen-
(excluded >350 words/min), speaking rate (ex- ter). These are then used to calculate the following
cluded >250 words/min), percent pause time (ex- facial metrics:
3
cluded >80%). http://dlib.net/
49Cutpoint Gender Free speech Read speech
All width, vJC, S R, S ratio, utter dur SR
5 Female S ratio, utter dur eye blinks
Male S ratio, eyebrow vpos, eye open, eye blinks
All S ratio, utter dur SR
10 Female open, width, LL path, JC path, S, S R, S L, eyebrow vpos, eye open
Male open, width, LL path, JC path, S, S R, S L, S ratio, eyebrow vpos, eye open, eye blinks open, width, S, S R, S L, eyebrow vpos
All vLL, vJC vLL, S ratio
15 Female width, vLL, vJC, S ratio vLL, S ratio
Male width, S, S L, eyebrow vpos, eye open, eye blinks eyebrow vpos
Table 3: Facial metrics for which a statistically significant (p < 0.05) difference between sample populations is
observed. For gender All not only female and male samples, but also samples for which no gender was reported
are used.
• Movement measures: Average lips opening
and width (open, width) were calculated as
the Euclidean distances between UL and LL,
and RC and LC, respectively. Average dis-
placement of LL and JC (LL path, JC path)
were calculated as the module of the vector
between the origin and LL and JC. Average
eye opening (eye open) was calculated as
the Euclidean distances between URER and
LRER, and ULEL and LLEL. Average ver-
tical eyebrow displacement (eyebrow vpos)
was calculated as the difference between
the vertical positions of RB and NT, and Figure 2: Illustration of the 68 obtained and 14 used
LB and NT. All measures were computed in facial landmarks.
millimeters.
• Velocity measures: The average velocity of
significant difference between participant cohorts
LL and JC (vLL, vJC) in mm/s was calculated
with and without depression of a given severity
as the first derivative of LL path and JC path
(i.e., above and below a certain cut-point PHQ-
with time.
8 score)? The PHQ-8 has established cutpoints
• Surface measures: The average total mouth above which the probability of a major depression
surface (S) in mm2 was calculated as the increases substantially (Kroenke and Spitzer, 2002).
sum of the surfaces of the two triangles with Ten is commonly recommended as cutpoint for
vertices RC, UL, LL (S R) and LC, UL, defining current depression (see (Kroenke et al.,
LL (S L). Additionally, the mean symmetry 2009) for a comprehensive overview). For our anal-
ratio (S ratio avg) between S R and S L was ysis, we use the cutpoints 5, 10, and 15 which align
determined. with the PHQ-8 score intervals of mild, moderate
and moderately severe depression. Concretely, for
• Duration measures: Utterance duration each metric and cutpoint, we divide the data into
(utter dur) in seconds. two sample populations: (a) PHQ-8 score below
and (b) PHQ-8 equal or above the cutpoint. We
• Eye blink measures: The number of eye conducted a non-parametric Kruskal-Wallis test
blinks (eye blinks) in blinks per second cal- for every combination to find out whether certain
culated using the eye aspect ratio as proposed obtained metrics show a statistically significant dif-
by Soukupová and Čech (2016). ference between cohorts.4
5 Analyses and Observations 4
We decided to exclude the /pa ta ka/ exercise (measure of
diadochokineic rate) from the analysis, because we observed
The central research question of this study is the that many participants did not execute it correctly (e.g. making
following: for a given metric, is there a statistically pauses between repetitions).
505.1 Analysis of Speech Metrics signals or used devices, among other studies, are
Table 1 presents the acoustic measures and speech necessary to to see to which degree the results are
sample types, for which a significant difference generalizable. Additionally, the used PHQ-scores
between sample populations was observed (p < were self-reported and might therefore be less ac-
0.05). For read speech, there is no significant dif- curate than scores obtained under the supervision
ference for any of the metrics. For free speech, of a clinician. In future work, we will also col-
percentage of pause time and volume are indicators lect additional interactions from larger and more
to distinguish groups. For sustained vowels, we diverse populations. Furthermore, we will perform
observe significant differences for volume, mean additional analysis on the obtained data, such as re-
fundamental frequency, harmonics-to-noise ratio gression analysis. Finally, we will extend the set of
and jitter. There are differences between females investigated metrics and investigate their efficacy
and males, as indicated in the table. for other neurological or mental health conditions.
5.2 Analysis of Visual Metrics
References
Table 3 shows the visual metrics for which a signif-
icant difference between sample populations was Paul Boersma and Vincent Van Heuven. 2001. Speak
observed (p < 0.05) for free and read speech. Vi- and unspeak with praat. Glot International,
5(9/10):341–347.
sual metrics are only analyzed for free speech and
read speech because only limited movement of fa- N. Dalal and B. Triggs. 2005. Histograms of oriented
cial muscles can be observed for automated speech gradients for human detection. In Proceedings of the
IEEE Computer Society Conference on Computer Vi-
and sustained vowels. For read speech only, a few
sion and Pattern Recognition (CVPR), San Diego,
metrics show significant differences independent of USA.
the cutpoint and gender, while the number of met-
rics for free speech depends on both cutpoint and Daniel Joseph France, Richard G Shiavi, Stephen Sil-
verman, Marilyn Silverman, and M Wilkes. 2000.
gender. For males, the measures that involve the Acoustical properties of speech as indicators of de-
eyes, i.e. eye open, eyebrow vpos and eye blinks, pression and suicidal risk. IEEE transactions on
show significant differences independent of the em- Biomedical Engineering, 47(7):829–837.
ployed cutpoint. In contrast, when considering
R. Gross, I. Matthews, J. Cohn, T. Kanade, and
all samples, independent of the reported gender, S. Baker. 2010. Multi-pie. In Proceedings of the In-
and females, the metrics for which significant dif- ternational Conference on Automatic Face and Ges-
ferences are observed depend on the cutpoint and ture Recognition (FG), volume 28, pages 807–813.
speech sample. Cutpoint 5 mostly includes eye,
Varun Jain, James L Crowley, Anind K Dey, and Au-
surface and duration measures, while cutpoint 10 gustin Lux. 2014. Depression estimation using au-
also includes movement measures. For cutpoint diovisual features and fisher vector encoding. In
15, significant differences can be observed for the Proceedings of the 4th International Workshop on
velocity of the lower lip and jaw center for both Audio/Visual Emotion Challenge, pages 87–91.
free and read speech, when considering all samples Jyoti Joshi, Roland Goecke, Sharifa Alghowinem, Ab-
or females. hinav Dhall, Michael Wagner, Julien Epps, Gordon
Parker, and Michael Breakspear. 2013. Multimodal
6 Conclusion and Outlook assistive technologies for depression diagnosis and
monitoring. Journal on Multimodal User Interfaces,
We investigated whether various audio and video 7(3):217–228.
metrics extracted from audiovisual conversational
Heysem Kaya, Florian Eyben, Albert Ali Salah, and
data obtained through a cloud-based multimodal Björn Schuller. 2014. Cca based feature selection
dialog system exhibit statistically significant differ- with application to continuous depression recogni-
ences between depressed and non-depressed popu- tion from acoustic speech features. In 2014 IEEE
lations. For several of the investigated metrics such International Conference on Acoustics, Speech and
Signal Processing (ICASSP), pages 3729–3733.
differences were observed indicating that the em-
IEEE.
ployed audiovisual dialog system has a potential to
be used for remote monitoring of depression. How- V. Kazemi and J. Sullivan. 2014. One millisecond face
ever, more detailed investigations on the nature of alignment with an ensemble of regression trees. In
IEEE Conference on Computer Vision and Pattern
value distributions of metrics, their dependency on Recognition (CVPR), Columbus, USA.
subject age or native language, the quality of input
51Kurt Kroenke and Robert L Spitzer. 2002. The phq-9: Nemsi: A multimodal dialog system for screening
a new depression diagnostic and severity measure. of neurological or mental conditions. In Proceed-
Psychiatric annals, 32(9):509–515. ings of the 19th ACM International Conference on
Intelligent Virtual Agents, pages 245–247.
Kurt Kroenke, Tara W Strine, Robert L Spitzer,
Janet BW Williams, Joyce T Berry, and Ali H Mok- Le Yang, Dongmei Jiang, Xiaohan Xia, Ercheng Pei,
dad. 2009. The phq-8 as a measure of current depres- Meshia Cédric Oveneke, and Hichem Sahli. 2017.
sion in the general population. Journal of affective Multimodal measurement of depression using deep
disorders, 114(1-3):163–173. learning models. In Proceedings of the 7th An-
nual Workshop on Audio/Visual Emotion Challenge,
Santosh Kumar, Wendy Nilsen, Misha Pavel, and Mani pages 53–59.
Srivastava. 2012. Mobile health: Revolutionizing
healthcare through transdisciplinary research. Com-
puter, 46(1):28–35.
Hongying Meng, Di Huang, Heng Wang, Hongyu
Yang, Mohammed Ai-Shuraifi, and Yunhong Wang.
2013. Depression recognition based on dynamic
facial and vocal expression features using partial
least square regression. In Proceedings of the 3rd
ACM international workshop on Audio/visual emo-
tion challenge, pages 21–30.
James C Mundt, Peter J Snyder, Michael S Canniz-
zaro, Kara Chappie, and Dayna S Geralts. 2007.
Voice acoustic measures of depression severity and
treatment response collected via interactive voice re-
sponse (ivr) technology. Journal of neurolinguistics,
20(1):50–64.
James C Mundt, Adam P Vogel, Douglas E Feltner,
and William R Lenderking. 2012. Vocal acoustic
biomarkers of depression severity and treatment re-
sponse. Biological psychiatry, 72(7):580–587.
Md Nasir, Arindam Jati, Prashanth Gurunath Shivaku-
mar, Sandeep Nallan Chakravarthula, and Panayi-
otis Georgiou. 2016. Multimodal and multireso-
lution depression detection from speech and facial
landmark features. In Proceedings of the 6th Inter-
national Workshop on Audio/Visual Emotion Chal-
lenge, pages 43–50.
Anastasia Pampouchidou, Olympia Simantiraki, Amir
Fazlollahi, Matthew Pediaditis, Dimitris Manousos,
Alexandros Roniotis, Georgios Giannakakis, Fab-
rice Meriaudeau, Panagiotis Simos, Kostas Marias,
et al. 2016. Depression assessment by fusing high
and low level features from audio, video, and text.
In Proceedings of the 6th International Workshop on
Audio/Visual Emotion Challenge, pages 27–34.
Tereza Soukupová and J. Čech. 2016. Real-time eye
blink detection using facial landmarks. In 21stCom-
puter Vision Winter Workshop, Rimske Toplice,
Slovenia.
R Steven and M Steinhubl. 2013. Can mobile
health technologies transform health care. JAMA,
92037(1):1–2.
David Suendermann-Oeft, Amanda Robinson, An-
drew Cornish, Doug Habberstad, David Pautler,
Dirk Schnelle-Walka, Franziska Haller, Jackson Lis-
combe, Michael Neumann, Mike Merrill, et al. 2019.
52You can also read