Opening Slide - Mahindra Manulife Mutual Fund

Page created by Ann Rodgers
 
CONTINUE READING
Opening Slide - Mahindra Manulife Mutual Fund
Opening Slide

            Creative to go here

BE A PART OF THE ASIA PACIFIC REITs GROWTH
Mahindra Manulife Asia Pacific REITs FoF
An open ended fund of fund scheme investing in Manulife Global Fund – Asia Pacific REIT Fund

   NFO Period: 28th September - 12th October 2021
   Scheme reopens for continuous sale and repurchase from: 22nd October 2021
Opening Slide - Mahindra Manulife Mutual Fund
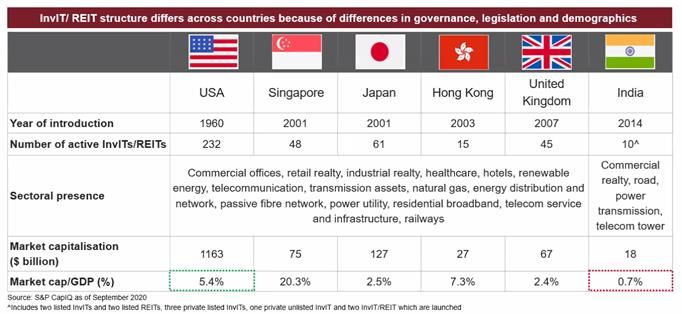
Popular Asset Classes and Their Challenges
                   DEBT                          REAL ESTATE                        EQUITY

       •    DEBT MUTUAL                      •   RESIDENTIAL                    • EQUITY STOCKS
            FUNDS                                PROPERTIES
                                             •   COMMERCIAL                       AND FUTURES
       •    FIXED                                PROPERTIES                     • EQUITY MUTUAL
            DEPOSITS
                                                                                  FUNDS
       •    FIXED INCOME
            PRODUCT

               CHALLENGES:                        CHALLENGES:
                                            • Highly illiquid                     CHALLENGES:
   •       Low interest rate scenario
                                            • Small ticket investment not       • Returns are volatile
           and /or Credit risk
                                              possible

       What if one could have liquidity, lower volatility and smaller minimum ticket size while
                                      investing in real estate?

                                           Introducing REITs
Opening Slide - Mahindra Manulife Mutual Fund
Invest In Real Estate Without Any Of The
Downsides of Estate Management

                           When you own
                                                     When you invest in REITs
                            Real Estate

                                                   Must distribute most of its cash flows
Rental Yield             Rental yield may be low
                                                                as dividend

                           Need negotiations,
                                                   Are listed mostly. Can be liquidated
Quick Liquidation             paperwork
                                                                  faster
                               and time

Investment Required         Large ticket sizes             Very low ticket sizes

                            Diversification is
                                                   Diversification across property types
Diversification                costly and
                                                             and geographies
                            needs research
                                                           Risk is adjusted due
Risk from Market Price     Higher risk due to
                                                            to monitored and
Volatility                lower diversification
                                                            Diverse exposure
Opening Slide - Mahindra Manulife Mutual Fund
Introduction to REITs

 REITs (Real Estate Investment Trust) are companies that own or finance income-
 producing real estate across a range of property sectors – such as residential, industrial,
 retail, mortgage, hotels etc. It is managed by a board of directors or trustees.

 Most REITs trade on major stock exchanges, and hence can offer liquidity

 REITs allow anyone to invest in portfolios of real estate assets the same way they invest
 in other industries – through the purchase of individual company stock or through a
 mutual fund or exchange traded fund (ETF).

 The stockholders of a REIT earn a share of the income produced through real estate
 investment – without actually having to own, manage or finance a property.

 Income generated on the lease and rent is paid out in the form of dividends. REITs must
 distribute most of its cash flows as dividend
Opening Slide - Mahindra Manulife Mutual Fund
Why diversification through International REITs?

International REITs are a great way to diversify a portfolio and build exposure to
real estate markets worldwide.

Ownership of REITs over time has historically increased investors' total return and/or lowered
the overall risk in both equity and fixed income portfolios

REITs historically* have delivered competitive total returns, based on high, steady
rental income and long-term capital appreciation.

Their comparatively low correlation with other assets also makes them a portfolio
diversifier that can help reduce overall portfolio risk and increase returns

Source: Morningstar REIT Report, 2016 *Study Period: 1972-2015
Opening Slide - Mahindra Manulife Mutual Fund
The Role of REITs in a Portfolio
     Potential to increase returns or reduce risk

 There may be a place for REITs in a portfolio

 •   Real Estate Investment Trusts (REITs) have unique characteristics that may make them attractive to both
     income and growth investors.
 •   REITs trade like stocks and can fluctuate in price, but they also pay out a large part of their income in the
     form of rentals.
 •   REITs may be used to help provide income in conservative portfolios or long-term growth in more
     aggressive portfolios.
 •   Some portion of a portfolio may be appropriately allocated to REITs for a broad range of investor types

Reconstruct your portfolio to include REITs

Equity, bonds, cash, and REITs generally do not react identically to the same economic or market stimuli,
combining these assets may produce a more appealing risk-and-return trade-off.

This makes REITs a potentially good candidate for investors looking to build a diversified portfolio.

Whether you are an investor seeking long-term growth or income, you may want to consider finding a place for
REITs in your portfolio

Source: Morning Star
How Do REITs Work?

                                   REIT                                 Commercial, Industrial
                                                                          and Residential
       Invests in                                        Invests in         properties
                            Manager

           ₹
                                          Sponsor

      Passed on as          Trustee                      Earns from
      combination of                                     rental and
      income and                                         price
      capital                                                            Diversified property portfolio
                                                         appreciation   Local REIT manager advantage
      appreciation     Strong governance and expertise
REITs – Globally Accepted Investment Vehicle With long
track record
Diversified sector exposure of Asia Pacific REITs
     •     Apart from the traditional retail malls, offices, industrial parks and hotels, Asia Pacific REITs also covers new industries like
           data centre and logistics which we believe could benefit from the recent rise of e-commerce and cloud computing.

                                                                                             Retail                           Office

                                                                                    Data centre
                                                                                                              Hotel              Healthcare
                                                                                     /logistics

For illustration only.
Access to diversified property portfolios

          The Asia Pacific REIT sector comprises a well-diversified mix of retail, commercial and
                                            industrial assets

                     Asia ex-Japan REITs Universe: USD$282bn Market Cap
120           US$117bn                                                                          Specialized
                                                                                                REITs

                                                                                                Retail REITs
100

                                        US$82bn                                                 Residential
                                                                                                REITs
 80
                                                                                                Office REITs

 60
                                                                                                Industrial REITs

 40                                                                                             Hotel & Resort
                                                    US$33bn                                     REITs
                                                                US$30bn

                                                                                                Health Care
 20                                                                                             REITs
                                                                          US$11bn    US$9bn
                                                                                                Diversified
                                                                                                REITs
   0
               Australia                Singapore   Hong Kong    Others   Thailand   Malaysia
Source: Bloomberg, as of 30 June 2021

                                                                                                                   10
11

     Introducing MMRFOF

                          INTRODUCING

         Mahindra Manulife Asia Pacific REITs FoF
PARENT SCHEME                                                         MASTER SCHEME                                                                 INVESTS IN

        Mahindra Manulife Asia                                                     Manulife Asia                                                            Invests predominantly in
        Pacific REITs FoF                                                          Pacific REIT Fund                                                        REITs across Asia
                                                                                                                                                            Pacific countries

      Why Manulife Asia Pacific REITs Fund?

             Why Manulife IM?                                                             Why Asia Pacific                                                       Why This Fund?
                                                                                              REITs?
                                                                          •      Strong rental income potential                                        •      Aims to achieve capital
        •      90+ years investment
               experience of property                                     •      Professional management                                                      appreciation
               investment/asset/property                                  •      Organized sector                                                      •      Aims to provide Inflation
               management1                                                •      Strong Markets like Singapore, Hong                                          Hedge
        •      185 professionals based in                                        Kong, Australia                                                       •      Diversification in real estate
               Asia (ex Japan)2                                                                                                                               with very low investment
                                                                                                                                                       •      Annualised yield 4.81%3

1. Source: Manulife Investment Management, as of 30 July 2021. 2. Source: Manulife Investment Management, as of 30 July 2021. Total is comprised of investment professionals
of Manulife Investment Management, Manulife-TEDA Fund Management Co. Ltd., a 49% joint venture is a joint venture between Manulife Financial and Northern International Trust, part of the
Tianjin TEDA Investment Holding Co. Ltd. (TEDA), and Mahindra Manulife Investment Management Private Limited, a 49% join venture of Manulife and Mahindra AMC. As of 31 March 2021, Manulife Asset Management
Thailand (MAMT) is no longer part of the Manulife group of companies. Accordingly, Bangkok, Thailand has been removed from our list of office locations. 3. Source: Manulife Investment Management, as of 1 July 2021.
Distribution yield only applies to AA (USD) MDIST (G) Share class. Dividend rate is not guaranteed. Dividends may be paid out of capital. Refer to important note 2. Please note that a positive distribution yield does not
imply a positive return. Past performance is not indicative of future performance. Annualised yield = [(1+distribution per unit/ex-dividend NAV)^distribution frequency]–1, the annualised dividend yield is calculated based
on the latest relevant dividend distribution with dividend reinvested, and may be higher or lower than the actual annual dividend yield. Dividend is not guaranteed.
WHY INVEST IN ASIA PACIFIC REIT NOW?

• To capture the potential recovery on the back of roll-out of COVID-19
   vaccines and reopening of economies

• REITs as one of the key beneficiaries amid the global search-for-yield

• Low interest rates can act as the key tailwind as seen in previous rate cut
   cycle

 Source: Manulife Investments
Asia Pacific REITs performed well in a low-rate environment
   •                                             We expect interest rates to be lower for longer as central banks eased monetary policy in order to mitigate the economic
                                                 impact from COVID-19.
   •                                             Asia Pacific REITs have outperformed broader equity markets during the last rate cut cycle from 2008 to 2015.

                                                                           Total Return (from 31 December 2008 – 31 December 2015)
                                                 360
       Rebased to 100 (as of 31 December 2008)

                                                 340
                                                                                                                                                           330
                                                 320
                                                                                                                                                                                                                 311
                                                 300               299
                                                 280

                                                 260

                                                 240
                                                                                                     227
                                                 220
                                                                   208                                                                                                                                            208
                                                 200                                                 202
                                                                                                                                                           193
                                                 180
                                                               Asia ex Japan                    Australia                                            Hong Kong                                              Singapore
                                                                                                               REITs                     Equities
 Source: Bloomberg, as of 30 June 2021. Australia REITs measured by S&P/ASX 200 A-REIT Index, Hong Kong REITs measured by Hang Seng REIT Index, Singapore REITs measured by FTSE ST Real Estate Investment Trusts index; Asia
 ex Japan REITs measured by FTSE EPRA/NAREIT Asia ex Japan REITs Index (capped), Singapore Equities measured by Straits Times Index STI Total Return Index, Hong Kong Equities measured by Hang Seng Index, Australia Equities
 measured by S&P/ASX 200 index, Asia ex Japan equities measured by MSCI AC Asia Ex Japan index (total return). Past performance is not an indication of future results.
 Widespread health crisis such as a global pandemic could cause substantial market volatility, exchange trading suspensions and closures, and affect fund performance. For example, the novel coronavirus disease (COVID-19) has resulted in
 significant disruptions to global business activity. The impact of a health crisis and other epidemics and pandemics that may arise in the future, could affect the global economy in ways that cannot necessarily be foreseen at the present time. A
 health crisis may exacerbate other pre-existing political, social and economic risks. Any such impact could adversely affect the fund’s performance, resulting in losses to your investment. Projections or other forward-looking statements regarding
 future events, targets, management discipline or other explanations are only current as of the data indicated. There is no assurance that such events will occur, and if they were to occur, the result may be significantly different than that shown
 here. Investment involves risk. Investors should not make investment decisions based on this material alone and should read the offering document for details, including the risk factors, charges and features of the product.
Asia Pacific REITs offer relatively attractive forward yields
    •      Form an income perspective, Asia Pacific REITs offer relative attractive forward yields compared to broader equities and
           government bonds.

     %
     6
                                                                                         5.49
                                                                                                                                                          5.16
     5

     4                  3.79           3.66                                                                                                                              3.80

     3                                                                                                  2.63

     2
                                                     1.53                                                                                                                              1.58
                                                                                                                      1.11
     1

     0
                                    Australia                                                      Hong Kong                                                         Singapore

                                                     REIT Yield              Equity Dividend Yield                 10 Year Government Bond Yield

Source: Bloomberg as of 30 June 2021. REIT Yield and Equity Dividend Yield are the projected 12-month yield from Bloomberg consensus. REIT Yield: Australia REIT – S&P/ASX 200 A-REIT Index,
Hong Kong REIT – Hang Seng REIT Index, Singapore REIT – FTSE ST Real Estate Investment Trusts index. Equity Dividend Yield: Straits Times Total Return Index, Hang Seng Index, S&P/ASX
200 index. 10 Year Government Bond Yield = Local Generic 10- year Government Bond Yield. Projections or other forward-looking statements regarding future events, targets, management
discipline or other explanations are only current as of the data indicated. There is no assurance that such events will occur, and if they were to occur, the result may be significantly different than that
shown here. Past Performance may or may not be sustained in future.                                                                                                                                             15
REITs tend to be good hedge against inflation
•        Inflation that is a result of economic growth tends to translate into greater demand for real estate and subsequent higher
         occupancy rates, supporting growth in REIT cash flow and dividends.
•        The anatomy of a lease may include annual step ups and rental increases that are tied to CPI. As a result, real estate is
         generally seen as a good hedge against inflation. The dividend return of Asia REITs has exceeded inflation of major REIT
         markets (as measured by CPI) in 10 out of the past 11 years.

    Asia REITs dividend return has outpaced inflation in the region
    %
    8
                                                7.2
    7                                                                                                                                   6.5
          5.8                                                                                                                                                 5.6
    6                                                                                 5.6
                                                                                                                               5.3
    5                                                                                                     4.4                                       4.5
                           4.2                                                                                                                                             4.4
                                                                   4.0
    4

    3

    2

    1

    0

    -1
              2010               2011               2012               2013                2014               2015               2016      2017        2018         2019     2020
                                         Asia REITs Dividend Return                        Hong Kong CPI                   Singapore CPI      Australia CPI

Source: Bloomberg, The World Bank, as of 30 June 2021. Asia REITs measured by FTSE/EPRA Nareit Asia ex Japan Index (capped).
Manulife Asia-Pacific REIT Fund
 Aims to achieve stable income and capital appreciation

                                              Income                                                              Growth

                                                                                                         Real Estate and Property
                                      REITs
                                                                                                         Management Stocks (non-REITs)

   Investment Objective                Stable Income                                                      Capital Appreciation

                                       Comparatively high dividend yields                                Appreciation potential
                                       Relatively defensive asset                                        Profits generated from sales and
   Characteristics
                                       Profits derived from rental income                                  property management services
                                       Real estate assets and management are key                         New projects continually hit the market

                                       Owners and operators
                                                                                                          Developers of residential and
   Assets                              of commercial properties
                                                                                                          commercial property projects
                                       (e.g. retail, offices, hotels, industrial)
   Expected Asset
                                       70-100%                                                            0-30%
   Allocation Range

   Current Allocation                  ~80%                                                               ~20%

Source: Manulife Investment Management, 30 July 2021. Information about the asset allocation is historical and is not an indication of the future composition.
Growth of Manulife Global Fund – Asia Pacific REIT Fund
                         700

                         600
Fund Size in USD mln

                         500

                         400

                         300

                         200

                         100

                           0
                                 2018      2018     2019    2019 June     2019      2019     2020    2020 June     2020      2020     2021    2021 June    2021
                               September December   March               September December   March               September December   March               August

                       Data source: Manulife Investment Management. Data period: Sep 2018 – Aug 2021
Manulife Asia Pacific REIT Fund
  A Diversified Portfolio

Fund Overview                                                                             Sector Breakdown (%)
                                                                                          100
Fund Inception                                                 Sep 11, 2018                               79.5
                                                                                            80
Fund Size                                                USD 558.02 million                 60
                                                                                            40
                                                     Manulife Investment                                                                                            17.9
Investment Manager                                 Management (Hong Kong)                   20
                                                                                                                                                                                                                          2.7
                                                          Limited                            0
                                                                                                         REITs                                                    Non-REIT                                               Cash

Geographical Diversification (%)                                                           Sub-industry Diversification (%)

        57.6                                                                                 Sub-Industry                                                                                                               Portfolio
60                                                                                                                                                                                                                      Weight %
                                                                                             Retail
                                                                                                 40REITs                                                                                                                30.18
                                                                                             Industrial 3…
                                                                                                 30 REITs                    2…
                                                                                                                                                                                                                        25.85
40
                                                                                             Diversified
                                                                                                 20      REITs                                                                                                          10.40
                                                                                                                                             10.4                                                        12.5
                                                                                             Office                                                                7.5
                                                                                                  10REITs                                                                          2.8
                                                                                                                                                                                                                        7.52
                                                                                                                                                                                                                                 2.8
                                                                                                                                                                                                                                                 5.4
                                                                                                                                                                                                                                                          2.7
20                                                                                           Specialized
                                                                                                  0      REITS                                                                                                          2.79
                   13.9

                                                                                                                                                                                                                                                          Cash
                                                                                                                                                                                                                                                 Others
                                                                                                                          Industrial REITs

                                                                                                                                                                                                                                Hotel & Resort
                                                                                                                                                                                                       Management and
                                                                                                           Retail REITs

                                                                                                                                                                    Office REITs

                                                                                                                                                                                   Specialised REITS
                                                                                                                                              Diversified REITs
                             11.9       10.7                                                 Real Estate Management and Development                                                                                     12.45

                                                                                                                                                                                                        Development
                                                                                                                                                                                                         Real Estate

                                                                                                                                                                                                                                    REITs
                                                    1.6           1.6      2.7
                                                                                             Hotel & Resort REITs                                                                                                       2.75
 0
                                                                                             Others                                                                                                                     5.4
                  Hong

                                                   Phillipin
        Singap

                                                                 Thailan
                              China

                                                                           Cash
                                        Australi
                  Kong
          ore

                                                     es

                                                                   d
                                          a

                                                                                             Cash                                                                                                                       2.65

Source: Manulife Investment Management, as of 30 July 2021. The securities mentioned are for illustrative purposes only, and do not constitute any investment
recommendation or advice. It should not be assumed that an investment in these securities or equities was or will be profitable. Information about the asset allocation is
historical and is not an indication of the future composition. Due to rounding, the total may not be equal to 100%.
Manulife Asia Pacific REIT Fund – Top 10 Holdings Summary
      Holds some of the largest and some of the most diversified REIT

           Top 10 holdings
                                           Sector        Market exposure2                         Description3
           as of July 20211

                                                         60% Singapore, 14% US, 14% Australia,   Largest industrial REIT in Singapore with 200+ properties in 4
      1   Ascendas REIT                    Industrial
                                                         12% UK                                  markets
                                                                                                 Largest REIT in Asia with majority of income from HK retail. The
                                                         83% HK, 13% Mainland China,
      2   Link REIT                        Retail                                                company has extended its reach to offices and retails malls
                                                         2% Australia, 2% UK
                                                                                                 across mainland China, Australia and the UK in recent years
                                                                                                 Largest REIT in Singapore after the merger of CapitaLand Mall
          CapitaLand Integrated
      3                                    Retail        96% Singapore, 4% Germany               Trust and CapitaLand Commercial Trust in November 2020 with
          Commercial Trust
                                                                                                 24 properties across retail, office and integrated developments.

                                                         25% HK, 24% Singapore, 17% Mainland
      4                                                                                          Asia-Pacific focused logistic REIT with 160+ properties in 8
          Mapletree Logistics Trust        Industrial    China,11% Japan, 8% Australia, 8% S.
                                                                                                 markets
                                                         Korea, 5% Malaysia, 2% Others

                                                                                                 5 property complex in Singapore comprised of malls, offices and
      5   Mapletree Commercial Trust       Diversified   100% Singapore
                                                                                                 business parks

                                                                                                 Holding 100 logistic/industrial and commercial properties across 5
          Frasers Logistics & Commercial                 47% Australia, 21% Singapore,
      6                                    Diversified                                           markets after the merger of Fraser Logistics Trust and Frasers
          Trust                                          21% Germany, 7% UK, 5% Netherlands
                                                                                                 Commercial Trust

                                                                                                 Operating 10 suburban malls in Singapore focusing on domestic
      7   Frasers Centrepoint Trust        Retail        100% Singapore
                                                                                                 necessity spending, F&B and services

          Mapletree North Asia                           57% HK, 23% Mainland China,             Commercial REIT with properties in Greater China region and
      8                                    Diversified
          Commercial Trust                               17% Japan, 3% South Korea               Japan including Festival Walk in HK
                                                                                                 111 industrial properties including data centre across Singapore
      9   Mapletree Industrial Trust       Industrial    68% Singapore, 32% US
                                                                                                 and the US
                                                                                                 Hong Kong retail REIT with a portfolio of 16 private housing
      10 Fortune REIT                      Retail        100% Hong Kong
                                                                                                 estate retail properties

1.   Source: Manulife Investment Management, as of 30 July 2021.
2.   Source: Latest company result announcement, Singapore Stock Exchange Chart Book, 30 June 2021. Market exposure calculated by property
     value. Data has been rounded up and the sum may not equal to 100%.
3.   Source: company website and latest result announcement, as of 30 June 2021.
Defensive properties of Asia ex Japan REITs

                                                        Annual total returns of Asia ex Japan REITS (2010 - YTD2021)
   50%                                                                                                                      47.28%

                                                                                                                            7.22%
   40%                                                                      36.29%

                                                                             6.54%                                                                30.60%
   30%
                                                                                                                                                  5.83%
                                                       21.65%
   20%                                                  5.61%                                                               40.07%
                                                                                                         15.18%
                                                                            29.75%
                                                                                                         5.62%                                    24.77%
   10%                                                                                7.01%
                  1.79%                                16.04%
                                                                                      5.36%              9.56%
                      2.3…           4.36%                         4.54%                       4.41%              3.99%                 4.23%
     0%                                                                               1.65%
                  -0.52%            -7.33%                         -5.89%
                                                                                              -14.09%             -12.09%               -13.90%
  -10%                                                             -1.35%
                                    -2.96%
                                                                                                                  -8.10%
                                                                                               -9.68%                                   -9.67%
  -20%
               2021 YTD               2020                  2019   2018       2017    2016      2015      2014     2013      2012        2011      2010
                                                                       Price Return    Dividend Return     FTSE BM Total Return (USD)

Source: Bloomberg as of 30 June 2021
Asia ex Japan REITs are represented by FTSE EPRA/NAREIT Asia ex Japan REITs Index (capped). Performance in USD.
Past performance is not indicative of future performance’
Rupee Volatility : Advantage?

         USD INR DEPRECIATION OVER 10 YEARS                       Last 5 years
 80
 75
                                                                  Date             USD            INR
 70
 65
                                                                  3-9-2016         1              66.83      1.79%
 60                                                                                                          CAGR
 55
                                                                  3-9-2021         1              73.02
 50
 45
 40

                                                                         USD INR DEPRECIATION OVER 5 YEARS
                                                                  78
Last 10 years                                                     76
                                                                  74
 Date                     USD                     INR             72
                                                                  70
 3-9-2011                 1                       45.79   4.78%
                                                                  68
                                                                  66
                                                          CAGR
 3-9-2021                 1                       73.02           64
                                                                  62
                                                                  60

Data source: Bloomberg. Data period 3/1/2011 – 3/9/2021
Asia Pacific REITs performance in 1H 2021
    •     Asia Pacific REITs registered mixed performance in 1H 2021 with major markets including Hong Kong, Singapore and
          Australia outperforming the Southeast Asia markets. Hong Kong REITs continued to lead the region on prospects of
          reopening of economy and borders. Australia REITs gained strongly in Q2 as Australia government bond yields retraced.
    •     Sector-wise, all sectors delivered positive total returns on average in 1H 2021 with health care REITs saw the largest gain.
          Office REITs were the laggards mainly dragging down by Thailand amid surging COVID-19 cases while office REITs in Hong
          Kong, Singapore and Australia fared better.
    •     Merger and acquisition activities remained robust across key REIT markets with Australia saw the largest logistics real
          estate transaction in history during Q2, which triggered the cap rates compression and revaluation gains of Australia REITs.

    Total return of major Asia Pacific REITs markets(%)                 Total return of Asia Pacific REITs sector (%)
                    -6   -4   -2   0     2   4   6   8   10   12   14                       0   2    4     6       8    10      12   14

   Hong Kong                                                                Health Care

                                                                              Diversified
        Australia
                                                                               Industrial

    Singapore                                                                Specialized

                                                                                  Retail
        Malaysia
                                                                          Hotel & Resort
        Thailand                                                                  Office

                                       1H 2021                                                           1H 2021

  The total return is the simple annualised average of all REITs listed in the Asia Pacific region as sourced from Bloomberg.

Source: Bloomberg, as of 30 June 2021. Past performance is not indicative of future performance’
Active Fund Management:
Navigating the post COVID-19 world
Where are we now?
    Roll-out of vaccines fueled expectations on a wider recovery
                                                                                          Vaccines

          Outbreak of                   Peak of pandemic           Pandemic receding       End of pandemic
          pandemic
         Beneficiaries of digitalization of economies – accelerated due to COVID-19. Structural growth
         story unchanged:
         • Industrial REITs: rising demand of e-commerce benefited logistic warehousing assets. Inorganic
            growth driven by M&A activities amid low interest rate environment.
         • Specialized REITs: robust demand on data centre due to the accelerating adaption of cloud
            computing.

                                                          Beneficiaries of reopening of economies:
                                                          • Retail and Hospitality REITs: occupancy and foot traffic set to recover on
                                                             the reopening of economies. Cash flow expected to improve as rental
                                                             reliefs come to the end.
                                                          • Landlord and real estate stocks: beneficiaries of the potential pick up in
                                                             retail sales and the continuing primary residential sales momentum.

                                                                               Global search-for-yield

Source: Manulife Investment Management, as of 30 June 2021. Projections or other forward-looking statements regarding future events, targets, management discipline or other explanations are only current
as of the data indicated. There is no assurance that such events will occur, and if they were to occur, the result may be significantly different than that shown here.
Active Management: Tapping into the Post-COVID-19 recovery
 •     With increasing vaccination rates and reopening of economies, the recovery of predictability of income remains the key to our
       thesis in 2021.
 •     We continue to favor Singapore market on relative valuation and re-opening recovery theme. During the first half of 2021, we have
       added to diversified REITs to gain exposure to CBD assets in Singapore.
 •     Retail REITs remain a core allocation as we believe that a normalized operating environment should lead to continued cash flow
       recovery.
 •     We kept our Singapore and Australia industrial REITs exposure on the secular growth momentum. The cap rate compression
       among Australia industrial driven by continued M&A activity helped drive asset revaluation in 1H21.
 •     For non-REIT real estate, the Fund has added into Chinese property management service companies on attractive valuation
       relative to growth and we like names with exposure to commercial and public projects. As of 30 June, non-REIT exposure increased
       to 20.6%.
100%
                                                      Cash
 90%
                                                      Non REIT Real Estate
 80%
                                                                                    Specialized REITs
 70%

 60%                                                                                     Retail REITs

 50%

 40%                                                                                     Office REITs

 30%
                                                                                             Industrial REITs
 20%

 10%                                                                                      Hospitality REITs
                                                                            Diversified REITs
  0%
   Jun-19              Sep-19             Dec-19             Mar-20             Jun-20            Sep-20             Dec-20             Mar-21            Jun-21

Source: Manulife Investment Management, as of 30 June 2021. Information about the asset allocation is historical and is not an indication of the future
composition.
Asia Pacific REITs 2021 Outlook - Summary

                         Singapore                                                                   Hong Kong                                                                        Australia

                    Industrial                                                                   Retail                                                                        Industrial
                    We like its defensiveness and                                                Neighborhood malls shown                                                      Strong end demand from third
                    visible cashflows                                                            resilience amid pandemic                                                      party logistic and e-Commerce

                    Retail                                                                       Office                                                                        Office
                                                                                                 Focus on de-Centralized
                    We prefers names that operate                                                                                                                              Stable valuations with strong
                                                                                                 Grade A offices given rent
                    neighborhood malls                                                                                                                                         institutional demand
                                                                                                 differentials

                    Office
                    Demand from tech companies
                    help buffer downsizing impact.

                    Hospitality
                    Vaccination reveals light at the
                    end of tunnel

                                                                                                                                                                                           Positive                    Neutral

Source: Manulife Investment Management, as of June 30, 2021. Projections or other forward-looking statements regarding future events, targets, management discipline or other explanations are only current as of the data indicated.
There is no assurance that such events will occur, and if they were to occur, the result may be significantly different than that shown here.
Active Management
Reducing pitfalls and capturing alpha
Active management
Key factors in selecting quality REITs

                   Growth Drivers                                                Management Team                                                            Tenant Profile
                   Organic                                                       •Past acquisitions and divestments                                         •No. of tenants and buildings
                   •Rental outlook                                               •Strength of sponsor                                                       •Mix of tenants
    Qualitative

                   •Occupancy trends                                                                                                                        •Concentration risk

                   Inorganic
                   •Pipeline from sponsors                                        Asset Enhancement Initiatives
                   •Strength of acquisition team
                                                                                                                                                                                        Funding Sources
                   •Availability of 3rd party assets
                                                                                  •Refurbishment and renovation                                                                         •Bank loans
                                                                                  •Decanting projects to optimise lettable area                                                         •Medium term notes, Bonds

                   Earnings                                     Valuation                                                Debt Profile
                   Quality                                      • Price-to-Book                                          •Gearing ratio
                                                                                                                         •Split of fixed rate debt and floating rate debt
    Quantitative

                                                                • Revalued NAV
                   •Net Property Income                                                                                  •Debt tenure
                                                                • Yield spread
                   (NPI) margin                                                                                          •Cost of debt
                   •Income support, if any

                                                                DPU Growth
                                                                Potential
                                                                                                                                                        Weighted Average Lease
                                                                                                                                                        Expiry (WALE)
For illustrative purposes only.
This material was prepared solely for informational purposes and does not constitute, and is not intended to constitute a recommendation to buy or sell any security or to adopt any investment strategy, and shall not form the basis of, nor may
it accompany nor form part of, any right or contract to buy or sell any security or to adopt any investment strategy.

                                                                                                                                                                                                                                                     29
Active management: Identifying Alpha
Key factors in identifying alpha opportunities in non-REIT real estate securities

                     Government                                      Property
                       Policy                                         Cycle

              •   Cooling measures                         •   Growth of the general economy
              •   Home ownership initiatives               •   Up-cycle or down-cycle
              •   Infrastructure / transport
                  connectivity

                                               Top-Down,
                                               Bottom-Up
                    Demographics                Blended
                                               Approach               Relative
                          &
                                                                     Valuation
                     Urbanisation

              • Population growth                          •   Property stocks fundamentally
              • Household size                                 undervalued
              • Housing affordability
Mahindra Manulife Asia Pacific REITs FoF
Scheme Specifics
Scheme Category     The Scheme is a Fund of Funds scheme (Overseas) which will invest into an Underlying
and Underlying      Fund namely ‘Manulife Global Fund – Asia Pacific REIT Fund
Fund

Investment Amount   Minimum Application Amount: Rs. 5,000 and in multiples of Re. 1/- thereafter
                    Minimum Additional Purchase Amount: Rs. 1,000 and in multiples of Re. 1/- thereafter
                    Minimum SIP Amount: Rs 1000 (Monthly and Daily SIP) and Rs 1500 (Quarterly SIP)

Exit Load           10% of the units allotted shall be redeemed without any exit load, on or before completion
                    of 24 months from the date of allotment of Units.
                    Any redemption in excess of the above limit shall be subject to the following exit load:
                    • An exit load of 1% is payable if Units are redeemed / switched-out on or before
                       completion of 12 months from the date of allotment of Units;
                    • An exit load of 0.5% is payable if Units are redeemed/ switched-out between 12 month
                       to 24 month for the date of allotment of units
                    • Nil - If Units are redeemed / switched-out after completion of 24 months from the date
                       of allotment of Units.

                    Redemption /Switch-Out of Units would be done on First in First out Basis (FIFO).
Benchmark           FTSE EPRA Nareit Asia ex Japan REITs Index

Plans/ Options      Available Plans: Regular, Direct
                    Options under each plan: Growth (default) , IDCW
                    Sub-options under IDCW: Reinvestment (default) , Payout
MAHINDRA MANULIFE ASIA PACIFIC REITs FoF
An open ended fund of fund scheme investing in Manulife Global
Fund – Asia Pacific REIT Fund
Disclaimer
The data/statistics, wherever provided, are given to explain general market trends in the securities market / international REITs market, it should
not be construed as any research report/research recommendation. Readers / users of this presentation should rely on information / data arising
out of their own investigations and are advised to seek independent professional advice and arrive at an informed decision before making any
investments.
The views expressed here in this presentation are for general information and reading purpose only and do not constitute any guidelines and
recommendations on any course of action to be followed by the reader / user of this presentation. No representation or warranty is made as to
the accuracy, completeness or fairness of the information and opinions contained herein. The views are not meant to serve as a professional
guide / investment advice / intended to be an offer or solicitation for the purchase or sale of any financial product or instrument or mutual fund
units for the reader / user. This presentation has been prepared on the basis of publicly available information, internally developed data and
other sources believed to be reliable. While utmost care has been exercised while preparing this presentation, Mahindra Manulife Investment
Management Private Limited [Formerly known as Mahindra Asset Management Company Private Limited] (MMIMPL) does not warrant the
completeness or accuracy of the information and disclaims all liabilities, losses and damages arising out of the use of this information. The
data/statistics, wherever provided, are given to explain general market trends in the securities market, it should not be construed as any research
report/research recommendation. Readers / users of this presentation should rely on information / data arising out of their own investigations and
are advised to seek independent professional advice and arrive at an informed decision before making any investments. Neither Mahindra
Manulife Mutual Fund, MMIMPL nor Mahindra Manulife Trustee Private Limited (Formerly known as Mahindra Trustee Company Private
Limited), its directors or associates shall be liable for any damages that may arise from the use of the information contained herein.

For detailed asset allocation, investment strategy, scheme specific risk factors and more details, please read the Scheme Information
Document and Key Information Memorandum of Mahindra Manulife Asia Pacific REITs FoF available at the ISCs of MMIMPL and
Computer Age Management Services Private Limited and are also available on www.mahindramanulife.com. Past performance may or
may not be sustained in the future and should not be used as a basis for comparison with other investments.

The information contained herein are not for distribution and do not constitute an offer to buy or sell or solicitation of an offer to buy or sell any
schemes/Units of Mahindra Manulife Mutual Fund / securities in the United States of America ('US') and/or Canada or for the benefit of US
Persons (being persons falling within the definition of the term “US Person” under the US Securities Act of 1933 or as defined by the U.S.
Commodity Futures Trading Commission, as amended) or residents of Canada as defined under applicable laws of Canada.

MUTUAL FUND INVESTMENTS ARE SUBJECT TO MARKET RISKS, READ ALL SCHEME RELATED DOCUMENTS CAREFULLY.

                                                                                                                         Cno: 01036
You can also read