OPPORTUNITY DAY Q2/2021 - TRANSITIONING TO A LOW CARBON WORLD August 17th 2021 - SET

Page created by Wayne Blake
 
CONTINUE READING
OPPORTUNITY DAY Q2/2021 - TRANSITIONING TO A LOW CARBON WORLD August 17th 2021 - SET
OPPORTUNITY DAY
           Q2/2021
          August 17th 2021

TRANSITIONING TO A LOW CARBON WORLD   1
OPPORTUNITY DAY Q2/2021 - TRANSITIONING TO A LOW CARBON WORLD August 17th 2021 - SET
Disclaimers
The information contained herein is intended to represent the Company’s operating and financial
 position at a given point in time and may also contain forward looking information which only
reflects expectations based on the prevailing geo-political, economic and non-controllable factors.
Such information has been obtained from sources believed to be most reliable and the means in
analyzing and preparation of such information for disclosure are based on approve practices and
principles in the investment industry. The views are based on assumption subject to various risks
  and uncertainties and no assurance is made as to whether such future events will occur. No
assurance is made as to the accuracy or completeness of information presented in this document.
                                                                                                2
OPPORTUNITY DAY Q2/2021 - TRANSITIONING TO A LOW CARBON WORLD August 17th 2021 - SET
Industry Review

            Business Overview

AGENDA       Key Updates

           Q2/2021 Review

         Outlook and Investment
         Plan

                                  3
OPPORTUNITY DAY Q2/2021 - TRANSITIONING TO A LOW CARBON WORLD August 17th 2021 - SET
Industry Update
Validates Our Strategy

          “Climate change is already affecting every
               inhabited region across the globe
          with human influence contributing to many
                 observed changes in weather
                    and climate extremes”

                                          IPCC AR6 WGI

                                                         4
OPPORTUNITY DAY Q2/2021 - TRANSITIONING TO A LOW CARBON WORLD August 17th 2021 - SET
Change is coming
                        News Headlines Regarding IPCC and Climate Change Across the World:

               Lawmakers, Biden administration warn
                  over UN climate and need for
                          urgent action

                                                                                         Beijing’s response to IPCC:
                                                                                        Climate ‘blue paper’ and ‘Coal
                                                                                                  price rises’
                                      Many companies grapple
                                      with climate change math

                                                                 IPCC report is ‘code
                                                                   red for humanity’
              The concern from scientists: Earth is
            warming faster than previously thought

Source: CNN, Bloomberg, CarbonBrief                                                                                      5
OPPORTUNITY DAY Q2/2021 - TRANSITIONING TO A LOW CARBON WORLD August 17th 2021 - SET
IMPACT of IPCC: Thailand will not be competitive by 2025

Impact of IPCC

                           • Quicker legislation
                           • Wide sweeping changes
            Regulation     • Punishing policies

                           • Carbon adjustment tax
                           • Carbon quotas
            Carbon tax     • Carbon trading

                           • FDI flows will flow to green economies
                           • Thailand falling behind with inadequate net
             Thailand        zero commitments (Target 2065)
           implications    • Politics will prevent national competitiveness

                           • Supermarket requirements
                           • MNC requirements
         Business policy   • Consumer requirements

                                                                              6
OPPORTUNITY DAY Q2/2021 - TRANSITIONING TO A LOW CARBON WORLD August 17th 2021 - SET
Competition will be dominated by next generation plant-based meat
products – what ‘Next’ means will change frequently
  Total U.S. Plant-based sales by Category in 2019                                       Plant-based Meat Market

   Unit: Million USD
                                                                                               Size of the Global                  Size of the U.S
                                                                                                Meat Category                      Meat Category
      1,858.0

                   1,234.0

                               801.0
                                        387.0
                                                                                                $1.4          trillion         $270 billion
                                                   118.0       70.0        6.0

        Milk     Other Dairy   Meat     Meal       Tofu &   Condiments    eggs
                                                   temph

Asia will follow US plant-based adoption roadmap, but not fully                          Beyond Meat Revenue from U.S. Retail
• Plant based has reached 12% US household penetration
• Plant based meats has taken a 3% market share from meat                                Unit: Million USD
                                                                                                                                            Supermarket
                                                                                                                                              Growth
Market is still wide open for market share and sales growth
• Beyond Meat only has 18% market share TTM despite having spent and invested the
                                                                                                             264.0
                                                                                                                                            Beyond Meat
  most capital showing the struggles to maintain market share – clearly not the future                                       +0.7% YoY        Growth
  of protein
                                                                                              129.0                       140.0          141.0
• Plant based meat still has room to grow for Multinational brands, supermarket brands
  – its not just about Start ups. OEM Opportunity is still very much an exciting space
• Category is not just about next generation; shelf stable meat is still growing (NRF
  products)
• Growth on shelf is slightly deceleration as volume shifts to food service due to re-        2019           2020        1H/2020       1H/2021
  opening up of the U.S. retail

                                                                                                                                                          7
OPPORTUNITY DAY Q2/2021 - TRANSITIONING TO A LOW CARBON WORLD August 17th 2021 - SET
The world is going to transition to carbon negative foods sooner,
NRF will lead in key markets where we have regulatory, carbon or scale
                 advantage due to our business model
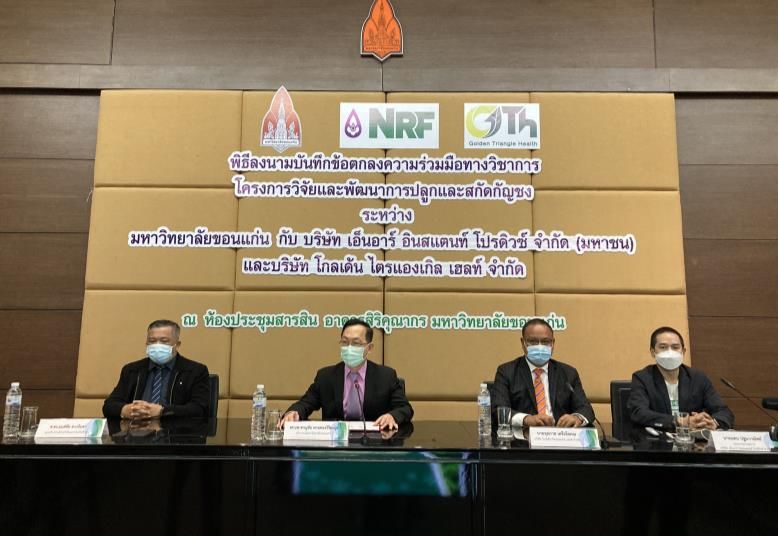
OPPORTUNITY DAY Q2/2021 - TRANSITIONING TO A LOW CARBON WORLD August 17th 2021 - SET
Industry Review

            Business Overview

AGENDA       Key Updates

           Q2/2021 Review

         Outlook and Investment
         Plan

                                  9
OPPORTUNITY DAY Q2/2021 - TRANSITIONING TO A LOW CARBON WORLD August 17th 2021 - SET
Company Highlights
  “We aim to be a global leader in foods that will lead to decarbonization of the world and
   to generate exponential returns to shareholders by working on solving the problems of
                          humanity arising from the food system”
                     Climate change is the    We aim to be the world’s recognized    Our business model is globally
                        challenge of our        leader in co-manufacturers of        unique and solves pain points
                             lifetime            sustainably produced foods            within the food industry

Our key verticals from plant            Entered SET 100 &       Recognized sustainability leader    Solving the 2050 food crisis
 based to ecommerce will                 ESG 100 within 9          in Thailand and by many             represents the largest
  generate QoQ growth                        months                multilateral organizations       opportunity of our lifetime

                                                                                                                                   10
NRF operates an integrated low carbon food platform
Providing an end-to-end solution in the production of sustainably produced food

                  Plants               Specialized   Global platform,
                                        facilities       regional              Plant based
                                         Smart         production,
                                       production      localization,
                                                                               Ethnic Foods
          Novel                        Blockchain         teams              Functional foods
                       Functional

   01                               02                                  03                               04
    Specialty ingredients that          Global manufacturing            Brand portfolio that allows us    eCommerce, Retail
        advance product              platform sets us apart from         to innovate and quickly roll       & Community
        characteristics or          competition with innovation         out products into the market
        reduce carbon                          centers.

                                                                                                                              11
Building competitive advantage in Plant based

    Corporate           Global Platform             Carbon                    Vertical              Focus on
    mission to             Regional              Footprint and          Integration with          Community,
     product              Production            Farmer Welfare              a focus on           Omni Channel
     purpose                                                             Technological          Distribution and
    alignment                                                             Innovation &             Marketing
                                                                             Specialty
                                                                           Ingredients

Our product mission    Focused on scaling to   Our goal of having a    Custom proteins will    eCommerce and
and our corporate      be the first in the     carbon negative         enable us to offer      innovative retail
mission both are       world to deliver a      footprint will set us   products that in        marketing will allow us
aligned to             consistently produced   apart from our          certain regions will    to grow our total
decarbonization and    and priced product      competitors as the      enable us to compete    addressable market by
not harming animals.   across regions          only true choice for    without peers and       upselling to existing
                                               millennials             make us the preferred   customers and
                                                                       global partner of       creating new ways for
                                                                       brands                  people to experience
                                                                                               plant based

                                                                                                                     12
Industry Review

            Business Overview

AGENDA       Key Updates

           Q2/2021 Review

         Outlook and Investment
         Plan

                                  13
Strategic Pillars of Growth

                                                                        People

                                   Our vision is people will consume an alternative proteins-based meal once a day
                                Our purpose is to transform our food system for a more inclusive and sustainable world
                             Our goal is to be the world’s leading co-manufacturer of alternative proteins & low carbon foods

                         OP Margin Expansion                 Grow Sales & Market Share                  Triple Bottom Line Growth
Strategic Priority

                     1    Win with Data
                          Win Online           2   Win with a Global
                                                   Plant-based Platform        3    Leading Specialty
                                                                                    Food Manufacturer         4     Win Clients with
                                                                                                                    Sustainability

                                    Stakeholder Guided Operations Driven by SOLID Culture
                                                                                                                                       14
Strategy 1: Win with Data, Win Online
                                      2023 Goal Revenue 4-5,000,000,000

           OP Margin Expansion                Grow Sales & Market Share                  Triple Bottom Line Growth

1

Brand Portfolio                NRF Value-Add                     E-commerce                    New Deals

 Q3 2021   New product           Q3 2021                                NRF is setting up a          Target complete 6
           launch under the                                             eCommerce                    acquisitions in 2021
                                 Q3 2021   Product produced             platform to sell own
           Primelabs brand
                                           by NRF V Shape               branded products in
                                 Q1 2021   under Prime Labs             Thailand and ASEAN           SPA for leading gummy
                                           brand launch                                              supplement
                                                                                                     Revenue $4-5m
 Q4 2022   Preparing for         Q4 2022   FDA approval and             Setting up payment           EBITDA $600k
           offline launch of               expected sale of             gateway
           prime into health               Prime labs products
           retail                          in Thailand                                               Under LOI negotiations
                                                                        Partner with                 with 2 companies
                                                                        existing companies
                                                                        to channel volume

                                                                                                                              15
Strategy 2: Win with a Global Plant-based Platform
                                           2023 Goal Revenue 4-5,000,000,000

           OP Margin Expansion                  Grow Sales & Market Share                      Triple Bottom Line Growth

1   2

Ecosystem update                            Innovation

                                               Location: Silicon Valley                             Project: Small innovation center
                                                                                                    & co-manufacturing center
                                                                                                    partnership with a leading start
 ✓ Launching Cohort number 4
 ✓ Potentially seeing second exit
                                                                                                    up and industry veterans
                                                                                                    Purpose: Produce next
                                                                                                    generation plant-based foods
                                                                                                    Goal: Scale and replicate into
             Unovis NCAP Fund II                                                                    other regions
        Invest in plant-based and                                                                   Expected investment: $500,000.
    alternative protein startups, from                                                              Due to the sheer demand its
    production to distribution processes
                                                                                                    expected to be fully booked out
 ✓ Unovis Completes fund raise                                                                      and break even in Phase 1

                                               Location: Thailand
                                                Project 1: Establish partnership with Khon Kaen University to set up
 ✓ Nove team currently working with 10          a Future food center
   start ups across the eco-system.             Project 2: Collaborate on Thailand’s first plant-based Masters
   Focus of collaboration is on Cell
                                                Degree
   based protein and co-manufacturing

                                                                                                                                       16
Strategy 2: Win with a Global Plant-based Platform
                                                      2023 Goal Revenue 4-5,000,000,000

                 OP Margin Expansion                         Grow Sales & Market Share                      Triple Bottom Line Growth

1       2

                                                       •    BRC Audit delayed for a second time due     •   Launch in 2,500 stores Sprouts and Kroger
                 50%             50%                        to COVID new schedule is September          •   Working on NPD produced by Nove
                                                            delaying full ramp up of production
                                                       •    Agreement drafting between NRPT and
                                                            PBB for the Thailand Facility
                                                       •    Planning stage with China facility
                                                       •    LOI to acquire textured protein company
                                                            together with Nove foods                    •   Acquired production plant in Vancouver.
                                                       •    Preparing to launch PBB branded sausage     •   Will begin testing production in Q4/2021
    •       Company formation Mid August                    in the UK                                       in Thailand with Nove
    •       Factory and retail store site selection
            in progress
    •       Organization recruitment of key
            members in process                                                                          •   >40 SKU and in talks with Distributors
                                                                                                            in Thailand, the UK, US and Singpore
                                                                                                        •   Preparing to launch Nove Eats QSR
                                                           Set up co-manufacturing factory for export   •   Converting Sukumvit Lab into plant-
                                                           of plant-based foods and frozen meals /          based ghost kitchen to support Nove
                                                           build or buy talks                               products and partners

                   “Upstream”                                        “Midstream”                                 “Downstream”
                     Growing                                          Growing                                 Brand & Product
                     Proteins                                        Production                                    Sales                                17
Strategy 3: Leading Specialty Food Manufacturer
                                         2023 Goal Revenue 4-5,000,000,000

          OP Margin Expansion                    Grow Sales & Market Share                    Triple Bottom Line Growth

12   3

Thailand Sales                   New Production                   Transforming Ratchaburi plant

                                                                                                                 3 yrs

                                                                      Soy Milk                 Specialty Pet             Plant based
                                                                                                  Food                     pet food
 Launched Por Kwan Brand         Currently exploring setting up      To better maximize production efficiency and due to a large
  in Thailand of 8 SKU with        co-manufacturing lines in       contractual order we are changing the factory from Soy milk to
    SINO Pacific with good       Europe and the United states                            Specialty pet food
          feedback                on certain volume products

                                                                   The factory will be injected into an existing pet
                                                                   food company with order book of 300,000,000
                                                                   for a stake of 65%

 SABZU local launch is gaining   Moving Soy milk line to NRF
           traction               Facility closer to the city

                                                                                                                                       18
Strategy 3: Leading Specialty Food Manufacturer
                               2023 Goal Revenue 4-5,000,000,000

         OP Margin Expansion        Grow Sales & Market Share             Triple Bottom Line Growth

12   3

                                                Progress with supply chain for Hemp fiber,
                                                protein, oil and CBD

                                                         Signed agreement to grow and extract Hemp CBD
                                                         and Hemp Oil with Khon Kaen university

                                                         Planted first plot expect to receive shipment in 60
                                                         days of Hemp Oil and CBD for NPD

                                                         Expanding plots of 40 rai with first grow in November
                                                         expected sales price per kilo of CBD is 35,000 with the
                                                         goal to be the most competitive scaled cbd producer.
                                                         We expect to generate 15-20m in net profit per 40 rai
                                                         plot

                                                                                                                   19
Industry Review

            Business Overview

AGENDA       Key Updates

           Q2/2021 Review

         Outlook and Investment
         Plan

                                  20
COVID-19 Impact and Updates

              Global Logistics Issues                                      Plant And Bean Ltd. Facility

Key Industry-wide challenges:                                    Due to COVID-19 situation in Europe, BRC approval was
•   Container shortages                                          postponed again to September 2021. However, with UK
•   Shipment delays                                              Opening Up Policy, we expect to see no further delays.
•   Significant increase in freight prices                       Production will start ramping up immediately afterwards

Approximate Baht 100M worth of shipment was                      Currently, the PBB team has been working with
impacted and rescheduled to July 2021, shifting this             customers to onboard them and process NPD as
revenue to be recognized in Q3/2021                              quickly as possible

We are well-aware and closely monitor and support                It is expected to see improved performance in Q4/2021
our clients, helping them to find cargo ships/containers
as much as possible to mitigate risks

         NRF continues to maintain proactive measures to prioritize safety and business continuity

   Employees                                      Operation & Factory                    Customers & Society
   • Offer free vaccination for all our           • Disinfection measures                • Several donations to high-risk
     employees and their relatives                • Social distancing policies             community and medical teams
   • Screening point for temperature check
   • Work from home policy

                                                                                                                            21
Global Container Shortage Shift Q2 Performance

              100 million worth of containers (manufactured & loaded into containers) and delivered to the port were
              unexpectedly delayed in the last week of June due to rescheduled container ships, moving revenue to July 2021

 Q2/2021 Operating Revenue Impact:
 Unit: million THB

                          ✓    Orders Produced
                          ✓    Orders shipped to Port

                                                     Rescheduled to July 2021, shifting revenue to Q3
                                                                                                          100

                               Impact of container
                                  shortage and
                                 shipping delays

                                                                                                        Q3/2021
                                                                                                                              22
Exceptional Quarter 2 results but hampered by container
issues
                                            Operating Revenue                                      Unit: million THB    %YoY
    Strategy and business                   Q2/21                       82%                        3% 15%         448   2020-21
    model is being validated                                                                                            +37.0%
    with IPCC                               Q2/20                 82%                 7% 5%       327
                                                                                                                        2019-20
                                            Q2/19                91%                 9%   287                           +13.9%
                                                                 Ethnic        Plant-based    Functional     E-com
    Well-positioned to take                 Gross Margin
    advantage of the coming                                                                                              %YoY
    global change                           Q2/21                                                       38.2%           2020-21
    • Carbon negative business will                                                                                      +7.3%
      translate into business               Q2/20                                            30.9%
      opportunities
                                                                                                                        2019-20
                                            Q2/19                                            30.5%                       +0.4%
    • All underlying trends are
      accelerating to an inflection point
    • Focused on execution against          EBITDA                                                                      %YoY
      strategies
                                            Q2/21                                                       91              2020-21
    • COVID and container crisis a
      temporary issue as we build                                                                                       +28.2%
                                            Q2/20                                            71
      regionalised production                                                                                           2019-20
    • Business model execution              Q2/19                                   55                                  +29.1%

                                            Normalized Net Profit                                                       %YoY
    Container mitigation
    in Q3                                   Q2/21    13                   16        29                                  2020-21
                                                                                                                         -38.3%
                                            Q2/20         21                         26                 47
                                                                                                                        2019-20
                                            Q2/19      16                           33                       49          -4.1%
                                                    Net profit            Normalization Adjustments*                              23
Overall Operating Revenue Breakdown by Business Line
OPERATING REVENUE
Million Baht, %

                                 +55.4% YoY                           YoY: Q2/2021 vs Q2/2020:
                                                              37.0%   In Q2/2021, the Company reported consolidated operating revenue of Baht
                                                                      448 million, increased by Baht 121 million or 37.0% mainly due to:

                                                              YoY     •   Ethnic Food Revenue: increase from existing customers in North America
                                        920                               and Europe regions, mainly from Recipe Mix and Ready-to-Eat
                                                                      •   Plant-based Food Revenue: decrease from lower orders from major
                                                                          customers as a result of cargo shortages from global logistics issues
           +37.0% YoY                   11%
                                                E-commerce
                                                                      •   Functional Product: no sales of V-shapes alcohol gels and no sales of
                                                Functional                V-shape machine occurred in this quarter
                                         2%     Product               •   E-commerce: increase in consolidated revenue from BOOSTED NRF Corp.,
               -5.1% QoQ                 5%
                                                Plant-Based
                                                                      QoQ: Q2/2021 vs Q1/2021:
                                                Food
                                                                      In Q2/2021, the Company reported consolidated operating revenue of Baht
                                                              5.1%
                                                                      448 million, slightly decreased by Baht 24 million or 5.1% mainly due to:

                                592                           QoQ     •   Ethnic Food Revenue: decrease from Own Brand products, especially
                                 4%                                       Recipe Mix products to North America region due to cargo shortages and
                                 7%                                       shipment delays from global logistics issues (valuing 100MB). If NRF was
                                                                          able to fulfill all shipments, revenue performance would be as planned
              472                                                     •   Plant-based Food Revenue: decrease from lower orders of Ready-to-Eat
                        448                                               Konjac Products from major existing customers as a result of cargo
               7%                                                         shortages and concerns on increasing freight costs
               4%
                        15%                                           •   Functional Product: no sales of V-shape machine in this quarter
               7%                                                     •   E-commerce: increase in revenue from Prime Labs and SOL Trading
                         3%             82%
    327
    5%                                                        55.4%   YoY: 1H/2021 vs 1H/2020:
    7%                                                                In 1H/2021, the Company reported consolidated operating revenue of Baht
                                89%                                   920 million, increased by Baht 328 million or 55.4% mainly due to:
                                                              YoY
              82%                                                     •   Ethnic Food Revenue: increase in own-branded products in all categories
                        82%
                                                Ethnic Food               and higher orders from major OEM customers in North America and
    88%                                                                   Europe regions, and higher revenue from City Food consolidation
                                                                      •   Plant-based Food Revenue: increase konjac products from major
                                                                          customers during Q1/2021
                                                                      •   Functional Product: no sales of V-shapes alcohol gels in 2021
                                                                      •   E-commerce: increase in revenue consolidated from BOOSTED NRF Corp.,

   Q2/20      Q1/21     Q2/21   1H/20   1H/21                                                                                                  24
Gross Profit and Gross Profit Margin
GROSS PROFIT AND GROSS PROFIT MARGIN
Million Baht, %

                                                                    YoY: Q2/2021 vs Q2/2020:
              32.6%       38.2%            35.3%   Gross    69.3%
   30.9%                           31.1%
                                                   Profit           Gross Profit was Baht 171 million, increased by Baht 70 million or 69.3%
                                                   Margin           mainly from higher consolidated revenues from Prime Labs and SOL
                                                            YoY
                                                                    Trading under E-commerce business

                                                                    Gross Profit Margin also improved to 38.2% mainly as a result of synergy
                                                                    received from BOOSTED NRF Corp. as E-commerce Business generated
                                    +76.6% YoY                      higher gross profit margin

                                                                    QoQ: Q2/2021 vs Q1/2021:
                                                            11.0%
                                           325                      Gross Profit was Baht 171 million, increased by Baht 17 million or 11.0%,
              +69.3% YoY                                    QoQ     mainly due to higher operating revenue from Prime Labs and SOL Trading
                                                                    under E-commerce business and Thai Baht depreciation
                  +11.0% QoQ
                                                                    Gross Profit Margin also improved to 38.2% mainly due to higher margin
                                                                    from E-commerce business and the absence of sales of V-shape machine
                                                                    which contributed to lower margin
                                   184
                           171
                  154                                               YoY: 1H/2021 vs 1H/2020:
                                                            76.6%
                                                   Gross
                                                                    Gross Profit was Baht 325 million, increased by Baht 141 million or 76.6%,
                                                   Profit
       101                                                  YoY     mainly due to increase in consolidated revenues from E-commerce
                                                                    business

                                                                    Gross Profit Margin also improved to 35.3% mainly due to higher margin
                                                                    from E-commerce business

      Q2/20       Q1/21    Q2/21   1H/20   1H/21                                                                                             25
SG&A and SG&A to Total Revenue
SG&A AND SG&A TO REVENUE
Million Baht, %                                                            YoY: Q2/2021 vs Q2/2020:
                                                                           SG&A was Baht 126 million, increased by Baht 73 million or 137.7% mainly
                                                                           from the:
                23.4% 27.1%       17.5%
                                           25.2% SG&A to                   • Increase in expenses consolidated from BOOSTED NRF Corp. and City Food
     15.7%
                                                   Total Revenue           • Increase in employee salary expenses from team expansion to support
                                                                              Company growth

                                                                           SG&A to Total Revenue was 27.1%, increased from 15.7% mainly due to:
                                                                   11.4%   • Increase in expenses consolidated from BOOSTED NRF Corp. and City Food
                                                                           • Impact from the container shortages, shifting Baht 100 million worth of
                                   +126.4% YoY                               revenue to Q3/2021 while SG&A costs for those shipments were already
                                                                   YoY       recognized in this quarter

                                                                           QoQ: Q2/2021 vs Q1/2021:
                                                                           SG&A Baht 126 million, increased by Baht 12 million or 10.5% mainly from
               +137.7% YoY                                                 the:
                  +10.5% QoQ                                               • Increase in expenses consolidated from BOOSTED NRF Corp.
                                            240
                                                                           SG&A to Total Revenue was 27.1%, increased from 23.4% mainly due to:
                                                                           • Increase in expenses from BOOSTED NRF Corp.
                                                                   3.7%    • impact from the container shortages, shifting Baht 100 million worth of
                                                   Selling
                                            32%                              revenue to Q3/2021 while SG&A costs for those shipments were already
                                                   Expense
                                                                   QoQ       recognized in this quarter

                                                                           YoY: 1H/2021 vs 1H/2020:
                                                                           SG&A was Baht 240 million, increased by Baht 134 million or 126.4% which
                          126                                              was in-line with the increase in revenues and mainly from the:
                  114                                                      • Increase in expenses from City Food and BOOSTED NRF Corp.,
                                   106                                     • Increase in salary expenses from team expansion
                  27%     36%                                              • Investment-related expenses such as professional and legal fees in Q1/2021
                                   25%             Admin
                                            68%    Expense                 SG&A to Total Revenue was 25.2%, increased from 17.5% mainly due to:
         53                                                                • Increase in expenses from City Food and BOOSTED NRF Corp.,
         23%                                                               • Salary expenses to support business expansion and investment-related
                  73%     64%      75%                             7.7%      expenses
         77%                                                               • impact from the container shortages, shifting Baht 100 million worth of
                                                                   YoY       revenue to Q3/2021 while SG&A costs for those shipments were already
                                                                             recognized in this quarter
        Q2/20     Q1/21   Q2/21    1H/20   1H/21                                                                                                    26
Normalized EBITDA and Normalized EBITDA Margin
NORMALIZED EBITDA AND EBITDA MARGIN
Million Baht, %
                                                                          YoY: Q2/2021 vs Q2/2020:
                                                                          Normalized EBITDA was Baht 93 million increased by Baht 20 million or
                                                                  27.4%
                  22.4%             22.2%            Normalized           27.4%, which included EBITDA of Baht 91 Million and normalization
      21.7%                                  21.2%                        adjustment items of Baht 2 million, which are investment-related fees. The
                           20.0%                     EBITDA
                                                     Margin        YoY    increase was primarily driven by the increase in operating revenue and
                                                                          higher gross profit margin from BOOSTED NRF Corp. under E-commerce
                                                                          business.
                                     +50.7% YoY                           Normalized EBITDA Margin was 20.0%, dropped from 21.7%. mainly due to
                                                                          increase in total revenue in a higher proportion than the increase in EBITDA

                  +27.4% YoY                                              QoQ: Q2/2021 vs Q1/2021:
                                              202                         Normalized EBITDA was Baht 93 million decreased by Baht 16 million or
                                                                  14.7%   14.7%, which included EBITDA of Baht 91 Million and normalization
                    -14.7% QoQ                                            adjustment items of Baht 2 million. The decrease was due to the lower
                                                     Normalization
                                              28
                                                     Adjustments* QoQ     amount of normalization item from lower investment-related fees. EBITDA,
                                                                          however, increased by 8 million or 9.6% to Baht 91 million, mainly from the
                                                                          enhanced gross profit margin from E-commerce business

                                     134                                  Normalized EBITDA Margin was 20.0%, dropped from 22.4% mainly due to
                                      3                                   the lower normalized EBITDA from lower amount of normalization item.
                                                                          However, EBITDA Margin improved from 17.0% in Q1/2021 to 19.6% in
                    109
                                                                          Q2/2021 as a result of high margin from E-commerce business
                               93
                    26          2
                                              174    EBITDA
           73                                                             YoY: 1H/2021 vs 1H/2020:
            2                                                             Normalized EBITDA was Baht 202 million increased by Baht 68 million or
                                     131                          50.7%   50.7%, which included EBITDA of Baht 174 Million and normalization
                                                                          adjustment items of Baht 28 million, which consisted of investment-related
                    83         91
           71                                                      YoY    fees. The increase was mainly from the significant increase in operating
                                                                          revenue and as well as synergy received from BOOSTED NRF Corp., resulting
                                                                          in higher gross profit

                                                                          Normalized EBITDA Margin was 21.2%, decreased from 22.2% mainly due
         Q2/20     Q1/21    Q2/21    1H/20   1H/21                        to increase in total revenue in a higher proportion than the increase in
                                                                          EBITDA
                                                                                                                                                       27
Normalized Net Profit and Net Profit Margin
NORMALIZED NET PROFIT AND NET PROFIT MARGIN
Million Baht, %

                                                                                                                 YoY: Q2/2021 vs Q2/2020:
       13.9%       14.2%                                15.4%             Normalized                             Normalized Net Profit Baht 29 million decreased by Baht 18 million or
                                                                    10.3% Net Profit                38.3%        38.3%, which includes the normalization adjustment items of Baht 16 million.
                                6.2%                                                                             The decrease was mainly from lower adjustment items from lower interests
                                                                          Margin
                                                                                                     YoY         from long-term loan prior to IPO as well as lower Net Profit from higher loss-
                                                                                                                 sharing from Plant And Bean Ltd. as BRC approval was postponed to
                                                            +5.4% YoY                                            September 2021. As production will then start ramping up, it is expected to
                                                                                                                 see further improvement in Q4/2021

                    -38.3% YoY                                                                                   QoQ: Q2/2021 vs Q1/2020
                                                                       98                                        Normalized Net Profit Baht 29 million decreased by Baht 40 million or
                                                           93                                      58.0%         58.0%, which included Net Profit of Baht 13 Million and normalization
                       -58.0% QoQ
                                                                                                                 adjustment items of Baht 16 million. Normalized Net Profit Margin also
                                                                                                    QoQ          dropped from 14.2% in Q1/2021 to 6.2% Q2/2021.
                                                                                                                 The decrease was mainly from lower amount of adjustment items from lower
                                                                                                                 investment-related fees and lower Net Profit as a result of the impact of
                        69
                                                                                                                 container issue as SG&A expenses for the delayed shipments were already
                                                           52          64      Normalization                     recognized in this quarter while the revenue has been shifted to Q3/2021
                                                                               Adjustments*                      and the increase in loss-sharing from Plant And Bean Ltd. from the BRC
                                                                                                                 approval and higher expenses from BOOSTED NRF Corp.
            47
                        48                                                                                       YoY: 1H/2021 vs 1H/2020:
                                                                                                                 Normalized Net Profit Baht 98 million increased by Baht 5 million or 5.4%,
            26                      29                                                              5.4%         which included Net Profit of Baht 34 Million and normalization adjustment
                                                                                                                 items of Baht 64 million. Major portion of the normalization items consisted
                                                                                Net                              of investment-related fees of Baht 28 million, which directly affected the Net
                                    16                     41                   Profit               YoY
                                                                       34                                        Profit.
                                                                                                                 Normalized Net Profit Margin dropped from 15.4% in 1H/2020 to 10.3% in
            21          21                                                                                       1H/2021. Other factor included higher expenses from BOOSTED NRF Corp.
                                    13
                                                                                                                 and City Food and the increase in loss-sharing from Plant And Bean Ltd. from
                                                                                                                 the postponed BRC approval which is expected to receive in September 2021
          Q2/20       Q1/21       Q2/21                   1H/20      1H/21                                       and will start ramping up production afterwards
     *Note: Normalization adjustment items are expenses that are not related to normal or core business operation which include IPO-related expenses, IPO special bonus, professional and legal
     fees for investment-related activities, and business acquisition loan interests and front-end fees, amortization of customer relationships acquired from business acquisitions, service fees for   28
     investments (Cold Chain Project), and City Food acquisition-related fees
Statement of Financial Position
STATEMENT OF FINANCIAL POSITION
                                  ASSETS                                                                     LIABILITIES AND EQUITY
Million Baht, %                                      4,055                                                             4,055
                                                        45                                                               25            Current potion of Long-term Loan
                                                       190     1%                                              1%       104
                                                               5%                                                       143            Others
                                                       167                                                     3%
                                                               4%                                 3,358        3%                      Long-term Loan
                                  3,358                204                                                              524
                                                               5%                                    63       13%                      Short-term Loan from Banks
                                     70                251                                           65
                      Others        104     1%                 6%                           2%       1
                                                                                                    143
                                    187
                                      -     3%         207                                  2%                          315            Trade & Other Payables
 Non-Current Financial Asset                                                                        202         8%
     Investments in Associate       224     6%         285
                                                               5%                           4%
                                                                                            6%      311                  306           Deferred Tax
Short-term loans to Associate       188     7%                 7%
    Cash & Cash Equivalents                                                                                    7%                      Liabilities
                                    284     6%                                              9%
                  Inventories                          613
   Trade & Other receivables                8%                 15%
                                    626
                       PP&E                 19%

                                                                                                    2,574               2,638
                                                      2,093                                77%                65%                      Shareholders’ Equity
                                    1,675
            Intangible Assets                                  52%
                                            50%
                and Goodwill

                                31-Dec-20          30-Jun-21                                     31-Dec-20           30-Jun-21
Total Asset: As of 30 June 2021, the total assets of the Company were Baht 4,055   Total liabilities: As of 30 June 2021, the total liabilities of the Company were Baht
million, increased by Baht 697 million or 20.8% from 31 December 2020 mainly       1,417 million, increased by Baht 633 million or 80.7% from 31 December 2020
due to:                                                                            mainly due to:

✓ Short-term Loans to Associate Company: increased by Baht 204 million             ✓ Short-term Loan from Banks: increased by Baht 381 million mainly from loans
  mainly due to loans given to Plant And Bean Ltd. for facility expansion and        for further investments and for City Food debt repayment
  working capital                                                                  ✓ Long-term Loan: increased by Baht 143 million mainly from loans for further
✓ Non-current Financial Assets: increased by Baht 86 million from increase in        investments
  plant-based investments in Wicked Foods Inc. and Konscious Foods Inc.            ✓ Trades and Other Payables: increased by Baht 113 million mainly from the
✓ Intangible Assets and Goodwill: increased by Baht 418 million mainly due to        increase in current portion of seller notes from BOOSTED NRF Corp.
  the increase in trademarks acquired from Prime Labs and SOL trading deals
  under E-commerce business                                                        Total Equity: As of 30 June 2021, the total shareholders’ equity of the company
                                                                                   was Baht 2,638 million, which increased by Baht 64 million or 2.5% from 31
                                                                                                                                                                           29
                                                                                   December 2020, mainly due to the increased retained earnings and the sales of
                                                                                   BOOSTED shares which resulted in 5x return
Industry Review

            Business Overview

AGENDA       Key Updates

           Q2/2021 Review

         Outlook and Investment
         Plan

                                  30
Project Progress and Outlook

                 NRF Consumer Ltd                                                       Superplants Ltd

         1           Deploy additional 500m in equity and debt to                       1             Build 2 rai control farm and phase 1 40 rai hemp
                     acquire 4-6 companies                                                            fiber, protein and CBD grow farm

   2021                                                                     2021
Corporate        2   Take the best products and sell into Asia through   Corporate              2     Develop company owned SKU
                     NRFC Omni channel platform
 progress                                                                 progress

             3       Launch products made by NRF into Boosted NRF                           3         Plans to launch Cookies and Hemp house (GTH)
                     platform

    Pipeline: Numbers of Companies Acquired                                Pipeline: GTH Grow Area
    Unit: No. of Companies                                                 Unit: Rais

                                                                                                                                              42
                                                                 6

                                                   2
                                                                                                                                 40
                                     2
                        1
        1                                                                                             2

     Q1/21           Q2/21        Q3E/21        Q4E/21         Total         Q1/21                  Q2/21       Q3E/21        Q4E/21         Total
                                                                                                                                                     31
NRF Investment Plan Summary
1) INVESTMENT PLAN
                            2019-2020        2021           2022-2023           Total

                                                               224.8
 New Protein Fund I LP
                                                              1,000.0

                                             413.1
                                                                             3,049.4
 Unovis NCAP Fund II”                                                        Million Baht
 GTH – Investment in Hemp                   1,075.0
               Mad Meat
                               336.5

                               19-20         2021              22-23
2) NRF CAPACITY EXPANSION PLAN
 Dedicated Plant-           2019-2020        2021           2022-2023           Total
 Based Facility

 Konjac Machine
 Retail Store
                                                               115.0         480.0
                                            150.0                            Million Baht
 Ethnic Food                   215.0
 Capacity Expansion
                             2019-2020       2021            2022-2023
        Total                551MB         1,638MB          1,340MB           3,529MB
    Source of fund:         IPO proceeds   Warrant, Loans, Working Capital                  32
Thank You

                      Please scan to give us your feedback

                                                                             Contact
                                                                   Investor Relations
                                                                   Tel: 065-508-9666
FOOD FOR FUTURE GENERATION                                   Email: ir@nrinstant.com33
Appendix 1
Group Structure and
 Investment Plan

                      34
Updated Group Structure
                                                 NRF
                                                                                                     Updated as of 17 August 2021

            eCommerce        Specialty Foods            Functional nutrition                             Plant based

                  100%                100%                          100%                                      100%

          NRF Consumer         City foods                   Super plants                              Nove foods

                                                                                     Manufacturing
3.1%                                                                                50%                                        50%
                             Nakorn Pratom                                                                NRPT
         Boosted eCommerce                                       GTH
                                Factory
                  45%                                                                                 Plant and Bean
                                 Rajburi
55%                              Factory
            Boosted NRF                                                                                 Konscious

                               New Facility

                                                                                     Brand
                                                                                                      Wicked Kitchen
             Prime Labs
                                                                                                        Nove Eats

            SOL Trading      Alternative diary                                                       Root the Future
                                Ie. Soy Milk

                                                                                     Ecosystem
                                                                                                     Big Idea Ventures
           Well Path SPA       Specialty Pet
                                  Food                 Dedicated production lines
                                                                                                        Unovis AM
                                                              Fluid energy
                                                          V Shape Partnership                           Corporate
                                                                                                       investments
                                                            Miracle noodle                                           Phuture
                                                                                                                                     35
                                                           Konjac Partnership
                                                                                                                 Meatless Farm
NRF Investment Plans (1/3)
              1) INVESTMENT PLAN

                                                                                               Investment Amount                                               Total
                  Name                Type of                                                     (Million Baht)                                            Investment
                                    Investment

                                                                  2019-2020                                2021                          2022-2023
                                                                                                                                                              15.4
               New Protein              Equity                         6.1*                                                  9.3
                Fund I LP                1.1%
                                                      Invest in New Protein Fund under BIV
                                                                                                                                                              15.2
                                        Equity                                                              1.4                                10.5
                                                                      3.3*
                                        10.0%
                                                                   Invest in BIV                  Additional Investment             Additional Investment
                                                                                                                                                             363.6
                                        Equity                                                             165.6
                                        25.0%                         198
                                                             25% in PBB (GBP 5m)                         (GBP 4m)
Plant-Based

                                        Equity                       3.1                                                                                      3.1
                                        80.0%         Invest in Ocean Hugger (USD 0.1m)
                                                                                                                                                              190
               Unovis NCAP              Equity
                 Fund II                                                                                     72               118
                                       3.33%**
                                                                                                     Invest in plant-based startups (EUR 5m)
                                        Equity                                                                                                                32.1
                                         8%                                                                32.1

                Mad Meat                Equity                                                                                                                5.1
                                         51%                                                                5.1
                                        Equity                                                                                                                47.9
                                         1.8%                                                              47.9
              Note: *Numbers may be changed as a result of the change in proportion to balance investment share                                                          36
                    **In the process of fundraising, equity amount may change
NRF Investment Plans (2/3)
             1) INVESTMENT PLAN

                                                                                            Investment Amount                                              Total
                 Name               Type of                                                    (Million Baht)                                           Investment
                                  Investment

                                                                2019-2020                            2021                        2022-2023

                                                                                                                                                          144
                                                                                                                                    90
                                      Asset                         35                                19
Functional

                                                      Purchased 2 V-shape Machines                                      Purchased >5 V-shape Machines
                                                                                         Purchased 1 V-shape Machines

                                                                                                                                                          67*
                                      Equity
                  GTH                                                                                67*
                                       49%                                                    Investment in Hemp
                                                                                                                                                           91
                                      Equity                          91
                                      3.7%
                                                         3.7% in BOOSTED USA (USD 3m)

                                                                                                                                                         2,075
E-commerce

                                                                                                                                    1,000
                                      Equity
             BOOSTED NRF
              Corporation              55%                                                                  717

                                                                                               358

                                                                               55% in BOOSTED NRF Corporation (USD 10m)
             Total Investment                                   336.5 MB                         1,488.1 MB                     1,224.8 MB              3,049.4 MB
                                                                                                                                                                     37
              Note: *Value can increase up to 77.8MB depending on Fair Value
NRF Investment Plans (3/3)
              2) NRF CAPACITY EXPANSION PLAN

                                                                                Investment Amount                                                 Total
                                   Type of                                         (Million Baht)                                              Investment
                 Name            Investment                                                                                                    and Equity

                                                      2019-2020                        2021                             2022-2023

                                                                                                                                                 30
                                    Plant                                                                                  15
                                  Expansion              15
              Konjac Machine                     Purchase 1st Konjac Machines                                   Purchase 2nd Konjac Machines
Plant-Based

                                                                                                                                                 150
                                    Plant
               Plant-Based        Expansion                                                               150
               Facility with
                   PBB
               Retail Store
                                 Retail Shop
                 with PTT

                                                                                                                                                 300
                                                                                                          100
Ethnic

                                    Plant
                                  Expansion              200
               Ethnic Food
                 Capacity
                                               Acquire 100% of City Food                      Additional Capacity Expansion
                Expansion
                                               (45% Capacity Expansion)
              Total Capacity Expansion               215.0 MB                       150.0 MB                            115.0 MB               480.0 MB
              Total Investment                       551.5 MB                       1,638.1 MB                         1,339.8 MB              3,529.4 MB

                Target                                                                             D/E < 1.0                  Debt/EBITDA
Appendix 2
Financial Performance
      Support

                        39
Revenue mix – Q2/2021

                   Carbon Neutral business                      Carbon Negative Business            The 3 P’s

81%                                          3%
                                             Plant-based        Plant-based Breakdown
                                                                                             PLANET
Ethnic Food                                                                                  Carbon Reduced
                                             Food               ✓ Proportion of Brand will   Energy Saving - LED
Seasoning, Recipe Mix,
Ready to Eat, and                            Jackfruit meat,      grow fast in the near      CO2 Emission reduction
Beverages                                    Konjac Noodles,      future                     = 527,665.34 kg CO2e/year
                                             Soymilk                                         Carbon Offset
                                                                                             = 4,878 ton CO2 eq/year
                                                                    Brand

                           448                                       1%

                         Million Baht                                                        PEOPLE
                                                                                             Total Followers across all our
                            Q2/2021
                                                                         OEM                 impact Social media = 41,894
                            Revenue
                                                                         99%
                                                                                             Total Impressions for our
                                                                                             social impact content =1.3 Million

                                      1% Functional
                                         Products                                            PERFORMANCE
                                           V-shapes equipment
                                                                                             Operating Revenue +37.0% YoY

             15% E-commerce
                 Business
              Revenues from
                                                                                             EBITDA +28.2% YoY

                                                                                             Normalized Net Profit -38.3% YoY
              BOOSTED NRF Corp.
                                                                                                                              40
Overall Operating Revenue Breakdown by Region
OPERATING REVENUE
Million Baht, %
                                                        Revenue from Europe                                                        Revenue from Asia
                                                                 +20% YoY                                                                  -48% YoY
    Revenue from America                                            +10% QoQ             Europe                                              -15% QoQ
               +115% YoY
                                                                             124
                                                                                                                    Asia
                                                           103      113
                  -10% QoQ                                                                                                          54
                                                                                           28%                       6%
                                                                                                                                              32         28

                                       America           Q2/20     Q1/21    Q2/21
                                                                                                                                  Q2/20     Q1/21      Q2/21

     Q2/20     Q1/21       Q2/21
                                         49%
                                                                                                                                          Revenue from Thailand
                                                                                                                                                      -4% YoY
                                                                                 Revenue from                              11%                           -21% QoQ
                                                                                Oceania& Africa
                                                                                       +61% YoY                                             50          61          48
                                                                                        +21% QoQ
                                                                                                              6%
                                                                                                   29                                      Q2/20      Q1/21    Q2/21
                                                                                         24
                                                                                18                         Oceania
                                                                                                           & Africa
                                                                               Q2/20   Q1/21   Q2/21

                             89%      Revenue from Foreign Countries                          11%       Revenue from Thailand

     •   America, Europe and Oceania & Africa have shown significant growth when compared to Q2/2020
     •   Due to the cargo shortages and increasing freight as a result of global logistics issue, some regions experienced a drop in revenues, especially in Asia.
     •   Revenues from Thailand has fallen, as a result of lower orders from Re-exporting customers, who has also impacted from the global cargo shortage issues.

                                                                                                                                                                         41
1H/2021 Business Overview by Business Lines

         82%         of 1H/2021
                     Operating Revenues         5%         of 1H/2021
                                                           Operating Revenues                   2%    of 1H/2021
                                                                                                      Operating Revenues

          1    Ethnic Food                      2 Plant-based                                  3 Functional Products

                                           Current Products Example                      Sales of V-shape Machine and
              48% Recipe Mix                                                              equipment To Fluid Energy
                                            •   Plant-based Meal Kits
                                            •   Konjac Noodles Ready-to-Eat Meals
              26% Ready-to-Eat              •   Dry and flavored Jackfruit meat
                                            •   Eggplant for Sushi
              21% Basic Seasoning           •   Plant-based Sauces
                                           Future Products Example
              5% Others                     • Plant-based Fresh Meat
                                            • Soy Milk

         70%                30%                      99%                 1%

        OEM            Own Brand                    OEM            Own Brand

    2,000 SKUs and 200 Brands
       for OEM production
                                              Over 30 SKUs                                     11%     of 1H/2021
                                                                                                       Operating Revenues
                                          for OEM Production
        with 7 own brands                                                                      4    E-commerce

          OEM Brands:                     Partners/Customers:                          Building E-commerce platform,
                                                                                    acquiring category leading food and
                                                                                     consumer products , upselling NRF
                                                                                        products on online channels

          Own Brands:
                                                                                    Consumer                E-Commerce

          Distributors:                                                                                NRF Corp.

                                                                                                                            42
Ethnic Food Revenue Breakdown by Business Model
OPERATING REVENUE - ETHNIC FOOD
Million Baht, %

                                                                    YoY: Q2/2021 vs Q2/2020:
                                +41.7% YoY                  27.2%   In Q2/2021, Revenues from ethnic food was Baht 365 million, increased by
                                                                    Baht 78 million or 27.2% mainly due to:
                                                            YoY
                                        748                         ✓ OEM Business: increase in revenue from existing customers of both
                                                                      NRF and City Food in North America and European regions, mainly
                                                                      from Recipe Mix and Ready-to-Eat products
                                                                    ✓ Own Brand: slight decrease in revenue mainly from lower orders of
                                                                      Recipe Mix products such as shrimp and crab pastes from existing
                                        26%     Own Brand             customers in the United States

                                                                    QoQ: Q2/2021 vs Q1/2021:
           +27.2% YoY           528                         4.9%
                                                                    In Q2/2021, Revenues from ethnic food was Baht 365 million, decreased by
                                                                    Baht 19 million or 4.9% mainly due to:
              -4.9% QoQ                                     QoQ
                                                                    ✓ Own Brand: decrease in revenue of Recipe Mix products from existing
                                29%                                   customers in North America as a result of cargo shortages and
              384                                                     shipment delays from global logistics issues (valuing 100MB). If NRF
                        365                                           was able to fulfill all shipments, revenue performance would be as
                                                                      planned
                                                                    ✓ OEM Business: increase in revenue from all product categories
             30%        23%
    287
                                        74%     OEM                 1H: 1H/2021 vs 1H/2020:
                                                            41.7%   In 1H/2021, Revenues from ethnic food was Baht 748 million, increased by
    30%
                                                                    Baht 220 million or 41.7% mainly due to:
                                71%                         YoY
                                                                    ✓ OEM Business: increase in revenue from higher order volumes, from both
              70%       77%                                           NRF and City Food major customers in North America and Europe
                                                                      regions
    70%                                                             ✓ Own Brand: increase in revenue from higher order volumes of all
                                                                      product categories to America and Europe regions

   Q2/20     Q1/21      Q2/21   1H/20   1H/21                                                                                                  43
Q2/2021 Normalization Item Breakdown

                                      Q2/2021 Normalized Net Profit Breakdown

  Unit: Million THB

                                               Normalization Items

                                                                          Investment-
                                                                          related Fees

                                                                                         16

                      Interest and Front-end       Amortization of
                         Fees of Business       Customer Relationship
                         Acquisition Loans

                                                                                         13

                                                                                              44
Key Financial Ratios
FINANCIAL RATIOS

            Inventory Holding
                  Current Ratio Period                         Payment  Period
                                                                 Quick Ratio                                  Collection Period
                                                                                                              Inventory Turnover

 Days                                          Days                                      Days
          54                             51                                                       64
                        50                                           48
                                                        43                                                            52
                                                                                  38                                                45

         Q2/20        Q1/21         Q2/21              Q2/20        Q1/21        Q2/21           Q2/20              Q1/21          Q2/21

                  Current
                      ROARatio                                      ROE
                                                                    ROE                                             ROA
 Times                                                                                                               4.9%          4.6%
                        1.2                                         6.6%
          1.1                                          6.0%                      6.1%
                                         1.1                                                     3.1%

         Q2/20        Q1/21          Q2/21             Q2/20        Q1/21        Q2/21           Q2/20              Q1/21          Q2/21

                    D/EROA
                        Ratio                                  Net Debt/Equity
                                                                     ROE                                      Net Debt/EBITDA
                                                                                                                  D/E Ratio

 Times    1.3                                  Times                                     Times

                                                        0.8                                             3.6

                        0.5              0.5
                                                                                                                      1.0           1.2
                                                                     0.1          0.2

         Q2/20        Q1/21          Q2/21             Q2/20        Q1/21        Q2/21           Q2/20              Q1/21          Q2/21
                                                                                                                                           45
Appendix 3
Industry research
    Plant-Based

                    46
Earth is warming faster than previously thought

IPCC Human Contributed to Hotter Weather Confidence Level                               Effects to Global Climate

                                                                                               Increasing of drought and fire danger

                                                                                                         •   More than 95% of the Western United
                                                                                                             State is facing drought on summer 2021
                                                                                                         •   Hydroelectric power plant was shut down
                                                                                                             due to low level of water in reservoir

                                                                                                         •   Wildfire seasons are longer and more
                                                                                                             destructive than usual due to climate
                                                                                                             change

                                                                                               More frequent flooding

                                                                                                         •   With the increase of 1 Celsius degree, The
                                                                                              +7%            rain can hold more than 7% of water vapor

                                                                                                         •   The rainfall rates as well as the amount of
                                                                                                             precipitation also increase in line with
      Confidence Level
                                                                                                             higher temperature
                         Low                   Medium                    High

                                                                                               Worsening hurricanes
•    IPCC assessed confidence level of human contribution to hotter weather since
     1950 by regions                                                                                     •   More intense of hurricanes, typhoons and
•    Asia, Europe and North America has high confidence level for contributed to                             cyclones
     higher global temperature by human activities                                          +maximum
                                                                                                                  • Increasing maximum wind speed
•    With the higher weather, there are 3 key effects to global climate including the       wind speed
                                                                                                                  • Extensive coastal flooding
     increase of drought, more frequent flooding and worsening hurricanes

    Source: CNN
What is the Definition of Plant-Based?

What is Plant Based?

                     Plant-based products are defined as direct replacements for animal-based products.
                                  For example: plant-based meat, seafood, eggs and dairy

                                                                                                        Fully plant-          Hybrid             Fully
                                                                                                           based             Products          Cultivated

                          Includes
                                                    Tofu & Tempeh Plant-based         Plant-based
                                                                                                           Tofu            Plant-based          Synthetic
                                                                     Meat                 Milk                              burger with          gelatin
                   Biomimicked meat, eggs, and                                                                             cultivated fat
                   dairy (e.g. Beyond Meat)

                   Functional meat replacement
                   made from plants (e.g. tofu,
                                                    Egg Substitute       Meals        Other Dairy
                                                                                                                             Does Not
                   tempeh, jackfruit, seitan)
                                                                                      Alternatives                           Include
                                                      • Cheese
                   Meals with animal ingredients      • Yoghurt
                   replacement (e.g. Amy’s frozen     • Ice cream and frozen novelty & desserts                        Inherently plant-based food
                   meals)                             • Butter
                                                                                                                       (e.g. Kale, Chickpeas)
                                                      • Plant-based dairy spreads, dips, sour cream &
                                                        sauces
                                                      • Ready-to-drink beverages                                       B2B ingredient companies
                   Fungi-and-algae-based
                                                      • Creamers                                                       (e.g. Trophic, Duckweed)
                   products (e.g. Quorn)              • Plant-based condiments, dressing & mayo

                                                                                                                                                     48
  Source: The Good Food Institute
Plant based 2.0 will reframe the category by 2023 disrupting meat
and plant-based brands
Meat Products                                     Dairy Products

    Animal-based Meat        Plant-based Meat         Animal-based Dairy        Plant-based Dairy

✓   Beef                ✓   Plant-based Ground    ✓   Milk Cheese          ✓ Plant-based Cheese
✓   Chicken             ✓   Biomimicked meat      ✓   Yoghurt              ✓ Plant-based Yoghurt
✓   Pork                ✓   Plant-based sausage   ✓   Butter               ✓ Ice cream and frozen
✓   Bacon               ✓   Pea Protein           ✓   Dairy spreads          novelty & desserts
✓   Salami                                        ✓   Creamers             ✓ Plant-based Butter
✓   Sausages                                                               ✓ Plant-based dairy spreads,
✓   Peperoni                                                                 dips, sour cream & sauces
                                                                           ✓ Plant-based Creamers

                                                                                                          49
PLANT-BASED
KEY FACTS :                                 WHAT’S NEW IN 2021 FOR PLANT-BASED?
Not only that Plant-based Food
benefit your health, research has
shown that it can also benefit the
environment and highly sustainable
when compared to normal meat
production

                87% LESS                         New Waves of                  Plant-Based Options                Upgrade of Cheese
                WATER                          Seafood Substitutes                   for Kids                       Alternatives
                                            Some brands start to drop plant-    Plant-Based Companies start    Plant-Based cheese makers are
                                             based tuna and use mushroom       to provide plant-based snacks successfully found ways to make
                96% LESS                    for scallops and use plant-based
                                             ingredients to mimic the real-
                                                                                for kids such as yogurts tube, dairy cheese more authentic in
                                                                                    nuggets and ice pops             textures and flavors
                LAND                                texture of seafood

                89% LESS
                EMISSION

                92% LESS                                     Sustainable Packaging                Beyond Veggie Burgers
                AQUATIC                                       Plant-Based Companies take            Many companies introduce
                POLLUTANTS                                   packaging innovation seriously            new tasty plant-based
                                                             by using packaging that make           alternatives beside burgers
                                                             from composable, recycled or         including hotdogs, Italian-style
Source: BofA, KKP Research, Business Wire                       biodegradable materials             sausages and jackfruit BBQ           50
Plant based is mainstream and this is an imperative

Plant-based to Become Key in Cargill Portfolio        Global Plant-based Meat Market Projections

                                                                                                    Share of
                                                                    Projected Market Size          Meat Market
                                                       Unit: USD Billion

                                                                   A.T.
                                                                                            370       23%
                                                                  (2035)
                                                                 Kearney

                                                             J.P.Morgan                               7%
                                                                                 100
    •    David MacLennan, the CEO of Cargill, US-
                                                                  (2035)
         based major global agricultural company,
         announced that plant-based will become key
         sector in its portfolio

        “Our analysis [suggests] that in 3-4 years                   UBS        85                    6%

         plant-based will be perhaps 10% of the                   (2030)

                        market.”

                                                                                                        51
Global plant-based foods market will see a strong and steady growth
  with Asia Pacific projected to be the rising star
 Global Plant Based Market by Type                                                                                   APAC Q2 Updates

       Unit: Billion USD                                                                     2020-2026F
                                                                                     58.4      CAGR                   APAC market size reached 163 million USD (2020)
                                                                         52.9
                                                               47.9                  23%       Other
                                                    43.4                  23%                                                Growing adoption of emerging
                                         39.3                                                  +8.7%
                              35.6                             23%                   14%                                     technologies for product innovation
                                                     24%                  14%
                                         24%                   13%                              Meat
                               24%                   13%
          21.2      23.1                 12%                                                    +14.0%                       •       Hybrid chicken             •        Chulalongkorn’s
                               12%                                                                                                   nugget infused                      Immune Boosting
                                                                                     63%                                             with plant                          plant based meat
                                                               63%        63%                                                        protein eyeing
                               63%       63%         63%                                                                                                                 won ProVeg Asia’s
                                                                                                                                     for China and                       2021 award
                                                                                                Dairy                                Singapore
                                                                                                +10.3%
          2018      2019      2020      2021F 2022F 2023F 2024F 2025F                                                        Increasing large number of key players
                                                                                                                                     First Pride                 •       Raised Series B
  • Global Plant Based Market is forecasted to grow by 10.4% CAGR between 2020-2025F                                         •
                                                                                                                                                                         funding (45 million
                                                                                                                                     nugget
    and reach 58.4 billion USD in 2025F                                                                                              launched in                         EUR) to expand into
  • Dairy Products has the largest proportion while Meat has the highest growth of                                                   Malaysia in the                     Asia and Europe
    14.0% CAGR                                                                                                                       coming months

                              Increasing Vegan                             Higher Investment in                              Collaboration of international and
                              Population                                   Plant-Based Food                                  domestic food companies
   Key
  Drivers                                                                                                                        •    Indonesian Green Butcher’s beefless steak
                             More development of                          Increasing intolerance                                      partnered with Japanese Pepper Lunch in Indonesia
                             innovative products                          of animal proteins
                                                                                                                             Increasing government investment in
               Plant Based Food Regional Growth                        APAC has the highest growth
                                                                                                                             R&D
      North                                         Europe
     America                                                                                                                 •       Avant (CN) invested             •     Singaporean
                                                     11.6%                                                                           new R&D plant for                     government
      14.1%                                     Asia Pacific                                                           +             cell based meat                       invested 72 billion
                                                                      Singapore as           China as the                            with SG Econmic                       USD in climate
                                                  15.9%                                                                              Development                           and food security
                                                                        the most            biggest market
                                                                                                                                     Board                                 plan
                                                                         robust

Source: Statista, Meticulous Research, Markets and Markets, imarc, Foodabletv, EY, Euromonitor, Poultry World, BCG                                                                               52
Interacting Paths are followed by consumers who want to eat more
Plant-Based Food which is approximately 54% according to Hortman Group

Three Interacting Paths to Plant-Based                                    Plant-Based Food Consumers by Generation

  Consumers mostly change their orientation to animal products by
  taking interacting paths as follows:
                                                                                                               of all consumers would like
                                                                                             54%               to eat more Plant-Based
                                                                                                               food and beverages
                            Trading up within Animal Products
                              • Switching red meat for white meat or
  01                            fish
                              • Buying only higher-quality products
                                e.g. grass-fed, organic, pasture-raised

                                                                                                52%                            58%
                            Reduction of Animal Products                                  Of Millennials and              of Baby Boomers
                                                                                          Gen X Consumers
  02                          • Reducing frequency of consumption
                                                                                                                             Consumers
                              • Reducing portion size
                                                                                             24-55 years old               56-74 years old

                                                                           Age
                            Trading in Plants

                                                                          Major Concern
                              • Increasing Vegetable portion size on                         Animal Welfare
  03                            plate
                              • Replacing some meat and dairy with
                                                                                                                           Health Concern
                                plant-based
                              • Incorporating more vegetarian-
                                focused cuisines                                          Environmental Impact

                                                                                                                                             53
    Source: Hartman Group
COVID-19 reshapes our homecooking culture to be more diversified and
convenient resulting in normalization of ethnic foods consumption
Global Ethnic Foods Market by Type                                                                               Key COVID structural shifts

    Unit: Billion USD
                                                                                                                   Key behaviors to continue in post COVID era
                                                                       79.65
                                                              71.24                                             Deloitte’s global consumers’ survey (40K participants from 18 countries)
                                                      63.72
                                                 57
                             45.6    50.98
           35.47    40.22

                                                                                                                  Cook at Home Buy Fresh Food         Work from Home Shop Online

                                                                                                                   Home Cooking is likely to continue in post COVID future due to
           2018     2019     2020    2021F 2022F 2023F 2024F 2025F                                                                    ▪   Work from home would likely to be
                                                                                                                                          continued as well as infrastructure for online
• Ethnic Foods Market is forecasted to grow by 11.8% CAGR between 2020-2024F                                         Structure            grocery is proven to operate efficiently
  and expected to reach 79.56 billion USD in 2025F                                                                                    ▪   Pandemic has left at least some level of
                                                                                                                                          financial difficulty, and that home
                                                                                                                     Economics            cooking is proven to save more money
                              Direct to consumer shift from online derlivery
                                                                                                                                     ▪    Consumers now have more options to
                                                                                                                                          buy healthier ingredients, try new recipe
                              Normalization through social media breaks adoption barrier                                                  and reduce waste from take away
 Key                                                                                                                 Preferences
Drivers                       Expansion of cultural awareness through soft power
                                                                                                                     COVID reconfigures why and how we consume
                                Demographic shift from growing millenials to global skill                                            ethnic foods
                                workforce migration
                                                                                                                                     Cultural curiosity among gen Y and Z:
Before: Ethnic foods are discovered from              Now: Consumers recreate experience at home                                     learning through flavours

                                                                                                                                     Brands came to rescue customers from
                                                                       +                  +                                          their longing of living the experience

 Travel Abroad     Restaurant     Local Grocer        Online Delivery Social Media breaks     Cook at                                Emerging softpower of social media
                                                      • Grocery        adoption barrier        Home                                  •    Virtual traveling and cooking class in
                                                      •   Restaurant                                                                      Youtube providing both context for cooking
                                                                                                                                          as well as content for international audiences
                           From feeding people to teaching them how to feed themselves

     Source: Deloitte, BOLD Business, Mordor Intelligence, Specialty Foods Association, Mintel, Euromonitor, The Guardian                                                                  54
Global plant based ingredient market is the rising underdog due to its
 unfold potential while ready to eat products are key criterions in
 assessing market maturity
 Global Plant Based Ingredient Market by Type                                                                                                                              Market Maturity Ranked by Ready to Eat

       Unit: Billion USD
                                                                                                                                                                           While most countries have raw cooking products
                                                                                                                                                                         available, Ready to Eat products are what distinguish
                                                                                                              31.2
                                                                                                                                                                                     level of market maturity apart
                                                                                               22.9
                                                                               16.9
                                                                12.4
                                                 9.1
                                 6.7                                                                                                                                                                      Tier 1: Red Ocean
                                                                                                                                                                         Markets with local many brands specialized in ready to eat brands
                                2020           2021F           2022F          2023F           2024F          2025F
                                                                                                                                                                                                                   High Consumer Responsiveness (Flexitarian)

                                                                                                                                                                                                                   High Vendor Robustness
 • Global Plant Based Ingredient Market is forecasted to grow by 36% CAGR
                                                                                                                                                                                                                   Up to Date Regulation
   between 2020-2025F and reach 31.2 billion USD in 2025F

                                                Decreasing cost overtime for production                                                                                                        Tier 2: Moderate Blue Ocean
                                                technology                                                                                                                    Markets with a few brands specialized in ready to eat brands

  Key                                           Growing advancement in biotech
                                                                                                                                                                                                                   Moderate Consumer Responsiveness (Flexitarian)
 Drivers
                                                                                                                                                                                                                   Moderate Vendor Robustness

                                                 Cross combination with biotech (Cell based fat)                                                                                                                   Not up to Date Regulation

                                                             Plant based meat are becoming more identical                                                                                                Tier 4: Blue Ocean
 Categories
 ▪       Soy-bean (Beef & Pork)                                                   Microscopic View                                                                                     Markets with no existing ready to eat brand
 ▪       Mung Bean (Chicken)
                                                                                                                                                                                                                   High Consumer Responsiveness (Flexitarian)
 ▪       Jackfruit (Pulled Pork &
         Seafood)                                                                                                                                                                                                   Moderate Vendor Robustness
 ▪       Etc. (More to come)
                                                                                                                                                                                                                    Not up to Date Regulation
                                                                 Beyond’s Pork tissue                           Pork tissue

Sources: Packaged Facts, Pique News Magazine, Sustainalytics, Green Queen, Food Frontiers, Local Custom Websites, Marketing Oops. , Ipsos, Insider South Africa, Vegconomist, Green Queen, Nutraingredients Asia                                                55
Amazon will be the goliath in global ecommerce landscape and a
main vessel for US Market penetration

    Global Ecommerce Market Overview                                                                       Amazon Performance

    Unit: Trillion USD                                                             7.39
                                                                         6.77                              Market Share Worldwide (2020)                  Key Milestones
                                                       5.55     6.17
                                              4.92                                                                RoW                                 By 2021
                                    4.213
                2.98       3.35                                                                                      12%
                                                                                                                                                      • Half of US
                                                                                                                   5%                                    ecommerce
                                                                                                                 7%
               2018       2019      2020     2021F    2022F    2023F    2024F    2025F
                                                                                                                                                      By 2022
                                                                                                                 8%                                   • The largest US
•    Global ecommerce market is expected to grow at 14% CAGR to reach 7.39 trillion USD by the                                            68%            retailers
     year 2025F
•    Market Share: 1st China (52.1%) followed by US (19.8%) & Market Growth: 1st India (27%)
                                                                                                           •   Almost 1/5 (18%) of categories sold are healthcare products
                         Rise of internet penetration accelerated by COVID
 Key
                         Permanent shift to online shopping likely to continue                                 Q2 Result: Amazon net sales has increased by 27% YtY and
Drivers
                         Advancement of innovation in operation efficiency                                                  reached record of 113.1 billion USD

    Amazon Retail Ecommerce Sales Overview                                                                        Online Stores +16%            3rd Party Seller +38%

                                                                                                                  Subscription +32%             AWS +37%          Retail Store +11%
    Unit: Billion USD                                                           1,546.18
                                                                        1,217.39
                                                               958.52                                              Q2 Growth Drivers and What to Anticipate
                                                      754.70
                                             626.56
                                    495.53                                                                              US economy regains momentum due to vaccination
                292.97 348.63
                                                                                                                        and stimulus package

                2018       2019     2020     2021F    2022F    2023F     2024F    2025F                                 Expansion of infrastructure to support behavioral shift
                                                                                                                        • Expansion of Prime services over 22 countries
                         Amazon infrastructure payoffs as COVID ravages                                                 • Introducing Amazon Pharmacy and other specialized
                                                                                                                           subscription service
 Key                     Utilization of technology innovation in value chain (I.e, automation and drone)                • Further integration of cloud business, entertainment
                                                                                                                           and retails into lifestyle
Drivers                  Extreme proficiency in supply chain management (I.e, buying new 737 cargo)
                                                                                                                        New CEO (Andy Jassy) will hold office in upcoming Q3
                         Integration of digital platform to become lifestyle (I.e, Prime Service)
                                                                                                                                                                                  56
        Source: Business Insider, Statista, Forbes, Barron’s, Digital Commerce 360, Amazon
Appendix 2
Industry research
    E-commerce

                    57
Business Insider’s Forecast in ecommerce and Amazon

Retail Ecommerce Sales Worldwide                                               Amazon Retail Ecommerce Sales

Unit: Trillions USD, %                                                         Unit: Billion USD, %

                                                                                                                                        Amazon
                                                                                                                                754.70 Retail
                                                         7,385 Retail
                                                               ecommerce                                                                ecommerce
                                                 6,773         sales                                                                    sales

                                         6,169                                                                         626.56

                                 5,545
                         4,921                                                                                495.33

              4,213

3,351                                                                                            348.63
             25.7%                                       24.5% % of total                                     42.1%
                                                 23.4%                              292.97
                                         22.4%                  retail sales
20.5%                            21.0%
                         19.6%
             17.8%
13.8%
                         16.8%                                                        19.0%           19.0%            26.4%            % Change
                                 12.7%                                                                                          20.5%
                                         11.2%                  % Change
                                                 9.8%    9.0%

 2019         2020       2021    2022    2023    2024    2025                        2018             2019    2020     2021     2022

                                                                                                                                                    58
      Source: Business Insider
Contribution of third party seller in Amazon: Estimated 60% of net
sales in 2021

Share of paid units sold by third-party sellers on Amazon

  Unit: Share of Paid Units

                                                                                                                                           55% 55%   56%
                                                                                         52% 53% 53% 52%   53% 54% 53% 53%   52%   53% 54%
                                                                           51% 50% 51%
                                                           49% 50% 49% 50%
                                           46%   47% 48%
                                   44% 45%
                         42% 43%
                   40%

             26%

                                                                                                                                                           59
     Source: Statista
You can also read