Pandemic Pressures and Public Health Care: Evidence from England - arXiv
←
→
Page content transcription
If your browser does not render page correctly, please read the page content below
Pandemic Pressures and Public Health Care:
                                                       Evidence from England
arXiv:2201.09876v1 [econ.GN] 24 Jan 2022

                                                              Thiemo Fetzer               Christopher Rauh*
                                                                             22 January, 2022

                                                                                    Abstract

                                                This paper documents that the COVID-19 pandemic induced pressures on the
                                                health care system have significant adverse knock-on effects on the accessibility
                                                and quality of non-COVID-19 care. We observe persistently worsened perfor-
                                                mance and longer waiting times in A&E; drastically limited access to specialist
                                                care; notably delayed or inaccessible diagnostic services; acutely undermined
                                                access to and quality of cancer care. We find that providers under COVID-19
                                                pressures experience notably more excess deaths among non-COVID related
                                                hospital episodes such as, for example, for treatment of heart attacks. We esti-
                                                mate there to be at least one such non-COVID-19 related excess death among
                                                patients being admitted to hospital for non-COVID-19 reasons for every 30
                                                COVID-19 deaths that is caused by the disruption to the quality of care due
                                                to COVID-19. In total, this amounts to 4,003 non COVID-19 excess deaths from
                                                March 2020 to February 2021. Further, there are at least 32,189 missing cancer
                                                patients that should counterfactually have started receiving treatment which
                                                suggests continued increased numbers of excess deaths in the future due to de-
                                                layed access to care in the past.
                                                Keywords: Health; Externalities; COVID-19; Coronavirus; Excess deaths;
                                                Cancer; NHS; Public health care
                                                JEL Classification: I18, I10, D62, H12, H55

                                             * Thiemo  Fetzer, University of Warwick, CAGE and CEPR. Email: t.fetzer@warwick.ac.uk.
                                           Christopher Rauh: University of Cambridge, Trinity College Cambridge, CEPR. Email:
                                           cr542@cam.ac.uk. We would like to thank Dr Karolina Weinmann for helpful comments.
1 Introduction
Despite the widespread availability of effective and safe COVID-19 vaccinations,
the presence of significant pools of unvaccinated groups in society, the inevitable
breakthrough infections, and the emergence of new COVID-19 variants imply con-
tinued pressures on health care systems around the world (see Mahase, 2021; de
Oliveira Andrade, 2020). Not surprisingly, the care for COVID-19 patients is draw-
ing resources that may have indirect effects on the quantity and quality of care
for patients that require medical help for reasons unrelated to COVID-19. Further,
lockdowns and other public-health measures that are taken to slow the spread of
COVID-19 may directly affect both the supply as well as the demand for health
care services by, for example, discouraging individuals to seek medical advice or,
through their impact on the likelihood of falling sick or having an accident (see
e.g. Vandoros, 2021). All of these factors combined can lead to worse public health
outcomes for patients that need medical help independent of COVID-19.
This paper traces out the negative externalities that COVID-19 induced health
care shocks have on non-COVID-19 patients. We study both the arrival of COVID-
19 and the initial disruption of the first wave, along with the effect of ongoing
COVID-19 pressures on the health system’s performance leveraging a broad array
of public administrative data from the NHS in England lasting until November
2021. Throughout, we study margins of both quantity and quality of health care
provision across five domains. First, we show that the initial wave of the pandemic
caused a drastic decline in A&E attendances that was followed by a sharp increase.
While before the pandemic 80% of A&E visits were attended within the NHS set
goal of 4 hours, this share has collapsed to just two thirds in the most recent months
of reporting. Second, we note drastic impacts on the performance of elective care:
since the onset of the pandemic, access to specialist care has been significantly cur-
tailed with waiting lists for referrals increasing by 20% and waiting times shooting
up. Pre pandemic 97% of diagnostics took place within the NHS set goal of 6
2weeks. The share dropped to 56% during the first wave and has only increased
to 71% since, implying notable delays in diagnosis and access to treatment. Given
that the waiting list tends to be around 1 million entries long, these delays have af-
fected millions of patients over the course of the pandemic. Third, non-emergency
consultant-led treatment declined dramatically and has only recently approached
pre-pandemic levels. We calculate that, in comparison to pre-pandemic treatment,
the missing treatments accumulated over the course of the pandemic are 5.6 mil-
lion. Moreover, patients referred for treatment have been 9% less likely to receive
treatment within the NHS set goal of 18 weeks.
Fourth, focusing on the likely longer term repercussions, we show that the dis-
ruption caused by the various pandemic waves has had a significant negative im-
pact on cancer care. In total, we estimate there to be 32,189 fewer cancer patients
receiving first treatment following a decision to treat, along with a notable worsen-
ing performance in terms of times to first consultation and times of first treatment
for urgent cases. For example, while before the pandemic, 91% of urgent referrals
of suspected cancer cases would lead to consultations with a specialist within the
NHS set goal of 14 days, this share has been only 86% since the end of the first
wave. Even more importantly, for cancer treatment, the share of patients receiving
urgent first treatment after referral within the NHS set goal of 62 days has declined
from 78% before the pandemic, to 75% during and 72% after the first wave. Alarm-
ingly, the share has been trending downwards: in the most recent months only 66%
of patients received treatment within 62 days of first referral and we document that
ongoing COVID-19 pressures further worsen this effect. We estimate that amongst
detected urgent cancer cases, 53,068 people had their cancer care delayed past the
NHS set goal. This is likely consequential in driving excess mortality in the fu-
ture as systematic reviews of clinical evidence suggest that even a four weeks delay
of cancer treatment is associated with increased mortality for cancer patients (see
Hanna et al., 2020). For cancer as well as for the other domains, we further show
that delays extend way beyond the NHS set goals with previously non-existent
3large fat tails in delays. Moreover, all previously mentioned aggregate patterns are
not driven by few trusts, but instead are found to be statistically significant across
outcomes and the health care system.
Lastly, we also find robust evidence suggesting that COVID-19 disruptions have
had a notable impact increasing excess mortality among patients attending hospi-
tal for reasons unrelated to COVID-19. We leverage unique data measuring excess
mortality associated with hospital episodes at the provider level. This data is nor-
mally used to evaluate the performance of different NHS providers. Underlying
the expected mortality is an individual patient level mortality risk estimate that is
obtained from a predictive model taking a broad range of patient characteristics
into account to predict the probability of death for each admitted patient within 30
days of admission. Importantly, the data exclude any hospital episodes or visits and
deaths that involve a COVID-19 diagnosis code such as a positive COVID-19 test
result. Since all patients are routinely screened for COVID-19 this implies that virtu-
ally the universe of COVID-19 patients is excluded. Further, all deaths that mention
COVID-19 on the death certificate are also excluded. Hence, this measure of ex-
cess death captures deviations between actually observed deaths and the expected
deaths of patients that were admitted to hospital for non COVID-19 reasons under
normal NHS operating circumstances. Not surprisingly, on average prior to the pan-
demic, the resulting aggregated measure of excess mortality is centered around zero
suggesting that the model has good out-of-sample predictive power. From March
onwards, however, there appear systematic deviations in the excess death measure
with observed deaths being significantly larger than expected deaths among non
COVID-19 patients. This suggests a significant omitted variable: the impact of the
pandemic on the care non COVID-19 patients receive.
We estimate that, for the period from March 2020 to February 2021 alone, there
have been at least 4,003 excess deaths of hospital patients in England that, if it
were not pandemic disruptions, would not have been expected to die. This num-
ber stands significant in the context of actual and estimated COVID-19 deaths. In
4the same period, England reported 124,581 deaths which mentioned COVID-19 on
the death certificate (which contrasts with other COVID-19 death measures over
the same period suggesting 109,250 deaths occurred within 28 days of a positive
COVID-19 test or 102,763 excess deaths estimated by the Office of National Statis-
tics). Thus, this represents a pure excess-death measure capturing excess mortal-
ity among patients who sought out medical care for reasons unrelated to COVID-
19. This implies that our estimates suggest that the excess deaths among hospitals
episodes of around 4,003 individual cases between March 2020 and February 2021
stand at a non-negligible 3.8% of all COVID-19 excess deaths or 3.1% of all deaths
mentioning COVID-19 on the death certificate that were captured during that pe-
riod.
We document that many of the deteriorations, in particular in the quality of
health care provided, are significantly associated with ongoing COVID-19 related
pressures experienced across NHS providers. For many performance measures,
changes are economically meaningfully related to changes in the number of new
COVID-19 admissions that hospitals face. For instance, ongoing COVID-19 induced
hospital pressures significantly increase the waiting times for treatment in A&E.
We also find that the number of non-COVID-19 excess deaths rises sharply with
the number of new COVID-19 admissions. For every doubling of new COVID-19
admissions, there is an additional four non-COVID-19 excess deaths.
In a final step, we look into potential mechanisms. COVID-19 pressures affect
the ability of the NHS to provide care in a multitude of dimensions. Most directly,
sharp increases in COVID-19 admissions increase the demand for care, which natu-
rally, is diverting resources. Yet indirectly, COVID-19 admissions, above and beyond
what we account for by controlling for the spread of COVID-19 in the community,
are exposing NHS staff to higher infection risks, increasing staff absences. This in
turn, is reducing the ability of the NHS to provide care. We document that frontline
health care staff – as opposed to managerial NHS staff – see notably higher staff ab-
sence rates if they are hit by a significant influx of new COVID-19 patients in need
5of hospital care. Further, the erratic COVID-19 induced health care demand surges
may indirectly affect the quality of care provision through simple physical exhaus-
tion and stress. While these indirect mechanisms cannot be quantified, in the paper
we document that the link between staff absence rates and COVID-19 admissions
is notably weaker, the higher the share of NHS staff that is fully vaccinated, even
after controlling for community transmission and population vaccination rates.
Measuring the indirect impacts of COVID-19 pressures on non-COVID-19 care
is, not surprisingly, difficult. We take advantage of the fact that the NHS had
produced measures of excess death based on individual-level patient microdata.
This allows us to capture the indirect burden of the pandemic Measures of excess
death are often computed due to a lack of data on COVID-19 deaths. For example,
in India, it was recently estimated by numerous studies that the true number of
COVID-19 deaths may be actually notably larger (Adam, 2022; Jha et al., 2022). Yet,
these measures of excess death may inadvertently be confounding deaths that arise
from disruptions in care for non COVID-19 reasons. In this paper, we can actually
quantify the extent of this indirect factor of excess death. In the UK, recorded
COVID-19 deaths match very closely with excess deaths.
The UK is uniquely positioned to enable the study of the impact of the pan-
demic on wider availability and access of health care. It is one of the few advanced
economies that boast a national public health care system – the National Health
Service (NHS) – implying generally quite good data availability for research while,
at the same time, having suffered some of the worlds highest pandemic infection
rates and death tolls. Importantly, measuring system-wide disruptions and chal-
lenges brought about by the pandemic is generally difficult in many countries due
to the often decentralized or fragmented organization of health care systems with
a mix of public- and private providers organized across different layers. This is the
first paper to show the impact of the arrival and the ongoing pressures imposed
by COVID-19 on a countries’ health care system as a whole. Naturally, there is a
question on whether the pandemic will have scarring effects on societies. Within
6economics, there has been a debate on whether and to what extent there are scar-
ring effects. In this paper we document that, at least based on the data from the
health care system, there is likely to be notable scarring effects in terms of worse
public health outcomes which are likely to have an economic and health impact for
years to come.
Already going into the pandemic, health care systems were deprived of human
resources (Lasater et al., 2021; Clements et al., 2008), and from suffered losses of life
(see Bandyopadhyay et al., 2020 for a review) and the impact on the physical and
mental well being among health care staff (Quintana-Domeque et al., 2021; Sun et
al., 2020). All these components are likely to further erode the ability of the health
care sector to attract and retain human capital.
The “missing” cancer patients were already flagged early in the pandemic by
charities (Macmillan, 2020), and the medical literature has been discussing how
health care systems are reorganizing to address the issues (e.g. Richards et al., 2020)
and the trade-offs involved in providing cancer care during the pandemic (e.g. Ku-
tikov et al., 2020). We are able to provide a lower bound on the likely number of
deaths that may have been caused by the deterioration of care that patients receive
in hospital under COVID-19 stress finding that these may easily account for a vast
number equivalent to at least 3% of all officially counted COVID-19 deaths. Our
approach contrasts with existing work looking at excess deaths relying on mod-
elling studies of the likely increases, e.g. due to undetected or delayed treatment of
cardiovascular diseases (e.g. Banerjee et al., 2021) or cancer (e.g. Lai et al., 2020).
Much of the economic literature has tried to characterize optimal policies to
minimize the lives versus livelihood trade-off (e.g. Bethune and Korinek, 2020).
Governments have introduced measures curtailing individual freedoms to help put
a check on transmission and keeping hospitalization pressures down. Economists
have studied the causal impact on the spread of COVID-19 of compulsory face
masks (Abaluck et al., 2021; Mitze et al., 2020); (digital) contact tracing (Fetzer and
Graeber, 2021; Wymant et al., 2021); targeted or untargeted lockdowns or reopen-
7ings (e.g. Fajgelbaum et al., 2020; Fetzer, 2021) along with their impacts on mental
health (Adams-Prassl et al., 2022) as well as its general deterioration during the
pandemic (Etheridge and Spantig, 2020; Proto and Quintana-Domeque, 2021). This
paper is among the first to document and quantify the negative externalities that
COVID-19 has on the quantity and quality of non-COVID-19 health care.
2 Data
We leverage a multitude of data sources to document comprehensively how the
COVID-19 induced disruptions affect both access as well as quality of care across
NHS Trusts in England.
2.1 A&E attendances and emergency admissions
We measure the performance of the accident and emergency (A&E) units in the UK
in terms of the level of demand as well as the quality of performance as measured
by the waiting times to receive treatment using data from the A&E Attendances
and Emergency Admissions dataset. This captures both measures of absolute num-
ber of attendances over time for all A&E types, including Minor Injury Units and
Walk-in Centres, and of these, measures of performance capturing e.g. the num-
ber discharged, admitted or transferred within four hours of arrival.1 The data is
arranged as a monthly panel at the provider level.
2.2 Referral to treatment and waiting times
NHS Constitution gives patients a legal right to access services within maximum
referral to treatment (RTT) waiting times. Waiting times statistics are collected to
1 This
data is available at https://www.england.nhs.uk/statistics/statistical-work-areas
/ae-waiting-times-and-activity/.
8ensure that the NHS can be held accountable.2 Patients referred for non-emergency
consultant-led treatment are on RTT pathways. An RTT pathway is the length of
time that a patient waited from referral to start of treatment, or if they have not yet
started treatment, the length of time that a patient has waited so far. The incomplete
pathway operational standard is the measure of patients’ constitutional right to start
treatment within 18 weeks.3 Each pathway relates to an individual referral rather
than an individual patient, so if a patient was waiting for multiple treatments they
may be included in the figures more than once. Incomplete pathways, often referred
to as waiting list times, are the waiting times for patients waiting to start treatment,
as at the end of each month. The incomplete waiting time standard was introduced
in 2012 and states that the time waited must be 18 weeks or less for at least 92% of
patients on incomplete pathways.
These data are available at the provider level. We leverage the data pertaining to
the NHS Trusts that carry out the vast majority of treatments. The data is arranged
as a panel at the provider by treatment function by the pathway status by month
providing measures of the total number of patients on waiting lists, along with a
breakdown capturing how long individuals have been waiting for treatment.4
2.3 Diagnostics waiting times and activity
The NHS collects monthly data on waiting times and activity for 15 key diagnostic
tests and procedures. This data collection effort is intended to monitor activity and
identify bottlenecks in diagnostic services recognizing that early diagnosis is central
to improving health outcomes. The waiting list data is a “snap shot” of the waiting
2 Thisdata is available at https://www.england.nhs.uk/statistics/statistical-work-areas
/rtt-waiting-times/.
3 An RTT pathway ends with the start of first treatment; the start of active monitoring of a con-
dition initiated by the patient or care professional; a decision not to treat a condition; if a patient
declined an offered treatment; or if a patient died before treatment.
4 The treatment functions are Cardiology, Rheumatology, General Surgery, Urology, Trauma &
Orthopaedics, Ear, Nose & Throat (ENT), Ophthalmology, General Medicine, Thoracic Medicine,
Gynaecology, Gastroenterology, Dermatology, Geriatric Medicine, Oral Surgery, Neurosurgery, Neu-
rology, Cardiothoracic Surgery, Plastic Surgery, and a composite Other category.
9list on the last day of the month in question. The activity data is the actual num-
ber of procedures carried out during the month in question. Delayed diagnostics
can significantly lengthen patient waiting times to start treatment. Diagnostic tests
refers to set tests or procedures used to identify and monitor a person’s disease
or condition, allowing a medical diagnosis to be made. This contrasts with actual
therapeutic procedures that aim to actually treat a persons condition.5 The data is
arranged at the provider by diagnostic test by time level.
2.4 Cancer referrals, treatment, and waiting times
The NHS collects data and sets targets for the performance of cancer care services.
These are arranged at three levels. Following an urgent referral for suspected cancer,
at least 93% of patients should be seen by a specialist within two weeks. A second
target involves first treatment: for all cancer treatment types, at least 96% of patients
should start a first treatment for a new primary cancer within one month (31 days)
of the decision to treat. The overarching target is that at least 85% of patients should
start a first treatment for cancer within two months (62 days) of an urgent referral.
This allows a construction of measures both on the extensive margin capturing
numbers of individuals referred to a specialist; number of treatment decisions taken
and number of actual treatments commenced. Similarly, it allows for measures
on the intensive margin capturing care quality measured by the time it takes for
individuals to be seen by a specialist and to commence treatment.6 This data is
arranged across a range of datasets at the provider by (suspected) cancer type by
care setting (admitted or not-admitted) and by time.
5 This data is available at https://www.england.nhs.uk/statistics/statistical-work-are
as/diagnostics-waiting-times-and-activity/monthly-diagnostics-waiting-times-and-ac
tivity/. The following diagnostic tests are considered: MRI, CT, Ultrasound, barium enema, dexa
scans, audiology assessments, echocardiography, electrophysiology, peripheral neuropathy, sleep
studies, urodynamics, colonoscopy, flexi sigmoidoscopy, cystoscopy, gastroscopy.
6 This data is available at https://www.england.nhs.uk/statistics/statistical-work-areas
/cancer-waiting-times/monthly-prov-cwt/.
102.5 Measuring non-COVID-19 excess mortality
The Summary Hospital-level Mortality Indicator (SHMI) reports on mortality at the
NHS trust level across England and is produced as an official monthly statistic by
NHS Digital. The SHMI includes deaths which occurred in hospital or within 30
days of discharge and is calculated using Hospital Episode Statistics (HES) data
linked to Office for National Statistics (ONS) death registrations data.7 The SHMI is
the ratio between the actual number of patients who die following hospitalisation
at the trust level and the number that would be expected to die. The expected prob-
ability of an individual patients death is estimated from a statistical model based
on the characteristics of the patients. These characteristics include the condition the
patient is in hospital for, other underlying conditions the patient suffers from, age,
gender, method and month of admission to hospital, and birthweight (for perina-
tal diagnosis groups). For each admission a risk of death score is computed for
which then the cumulative expected deaths can be computed and contrasted with
the observed number of deaths that occur while patients were in hospital or within
30 days of discharge. Crucially, the SHMI data remove any activity or death that
is related to COVID-19. Specifically, if any hospital episode within a provider spell
have a COVID-19 diagnosis code recorded (such as, for example, if a patient tests
positively for COVID-19), then the spell is excluded from the analysis. Since all
admitted patients are routinely tested for COVID-19 this implies that virtually all
hospital episodes under consideration exclude COVID-19 patients. Moreover, for all
deaths included in the SHMI, if COVID-19 is recorded anywhere on the death cer-
tificate, then the death and the spell it is linked to are also excluded from the SHMI.
This ensures that we focus exclusively on deaths and in particular, excess deaths in
care settings that are not directly attributable to COVID-19, but may still be driven
by COVID-19, due to its impact on the quality of care that can be provided.
The data is reported as twelve month rolling cumulative totals, that is, for ex-
7 The data is available on https://digital.nhs.uk/data-and-information/publications/sta
tistical/shmi/.
11ample, the monthly publication of March 2020 includes the cumulative total num-
ber of hospital episodes or “spells”, the number of observed deaths or the num-
ber of expected deaths over the twelve month window ranging from April 2019 to
March 2020 inclusive. That is, for every reporting month t, the measures we cap-
ture the twelve month cumulative totals, that is, ∑tτ =t−12 Obs p,τ , ∑tτ =t−12 Exp p,τ and
∑tτ =t−12 Spells p,τ .
We can compute the number of excess deaths in a twelve month rolling window
as reported in month t as
t t t
∑ Excess p,τ = ∑ Obs p,τ − ∑ Exp p,τ
τ =t−12 τ =t−12 τ =t−12
Naturally, the above measure can be considered to be the residual of a regres-
sion that is the result of having aggregated the individual predicted mortality risks
h( xi,p,t ) of observation i that is captured in a set of features x about the individual
i. If this model was unbiased, we would expect that the expected value of this mea-
sure E(∑tτ =t−12 Excess p,τ |h( x )) = 0. Naturally, if there was an omitted variable zi,p,t
either at the individual, provider- or time level that affects the number of observed
deaths in a way that the statistical model to generate the expected deaths measure
has not taken into account for – i.e. if there is an omitted variable - in the risk model,
we would expect the above condition to be violated, i.e. that there is indeed some
structure in the residuals. We document that up to February 2020, there is no struc-
ture in the residuals with the average excess deaths across providers and over time
to hover close to zero. Yet, from March 2020 onwards, the pattern suggests that
there is indeed an important omitted variable in the risk model that results in a no-
table divergence between the observed number of deaths and the expected number
of deaths. In section 4.6 we document that measures of COVID-19 pressures at the
provider level p capture this pattern quite well.
122.6 NHS sickness absence and vaccination rates
We also study staff absence rates as a potential mechanism along with staff vacci-
nation rates. Detailed breakdown of staff absence rates by staff group types which
broadly distinguishes doctors, nurses, management and other support staff is avail-
able as a monthly measure.8 We also construct a (cross sectional) measure of the
share of staff fully vaccinated. This data was broken down by NHS Trust level from
October 2021 onwards and we use this first reporting month as a cross sectional
characteristic to explore heterogenous treatment effects. We also construct wider
population vaccination rates and case numbers in catchment areas of NHS Trusts
described in more detail next.
2.7 Measuring provider-level exposure to COVID-19
We construct a range of measures to a specific providers exposure to COVID-19.
We observe three measures directly at the health care provider level: the number of
new hospital admissions who tested positive for COVID-19 in the 14 days prior to
hospital admissions or who during their stay in hospital inpatients were diagnosed
with COVID-19 after admission. The number of cases in hospital measured as
the number of people currently in hospital with confirmed COVID-19 through a
positive PCR test for COVID-19 in the past 14 days. The number of COVID-19
patients in beds which can deliver mechanical ventilation.
We also construct a measure of the number of cases within the community across
catchment areas of NHS providers. NHS trusts are not defined spatially explicitly,
but rather, can serve multiple regions. Yet, most NHS Trusts are spatially quite con-
centrated. To allocate NHS trusts and providers to specific locations and to merge
in additional data, we leverage an analysis of individual-level micro data from the
Hospital Episodes Statistics dataset which breaks down all hospital visits to an NHS
8 Thesedata are available on https://digital.nhs.uk/data-and-information/publications
/statistical/nhs-sickness-absence-rates.
13provider location by the location of residence of the patients at the granular middle
layer super output area (MSOA) which have, on average, a population of 8,000 resi-
dents.9 We allocate MSOA’s to NHS trusts on the basis of a first-past-the-post basis
– that is, an MSOA is counted towards the catchment area of an NHS trust if that
trust handles the most hospital episodes across all NHS trusts that serve residents
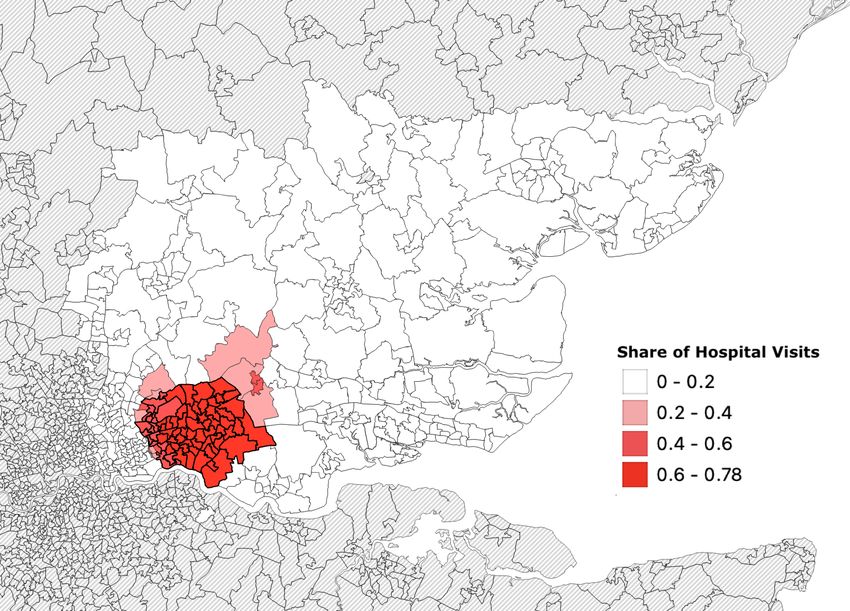
from this MSOA. As illustrated in Appendix Figure A1 there is, not surprisingly,
ample spatial clustering implicit in this. Having this mapping of MSOA’s that are
spatially explicit to NHS trusts (which may operate out of several sites within an
area) allows us to construct measures of the cumulative community exposure to
COVID-19 as COVID-19 case figures along with vaccination rates are provided at
the MSOA level.
We next describe the empirical analysis that we carry out.
3 Empirical analysis
Most of the datasets we leverage here are monthly panel datasets allowing us to
study the evolution of key measures of health care system within providers and
over time. We carry out two main sets of exercises: first, studying the evolution
of NHS performance across a broad range of metrics within providers over time,
contrasting the time before- and after March 2020 and second, the performance of
NHS providers since March 2020 and to what extent COVID-19 pressures continues
to affect the ongoing operations during the pandemic. The former allows us to
quantify the pandemic-induced backlogs and care quality concerns that arise on
the extensive margin, while the latter allows us to study how ongoing COVID-19
pressures affect the quality of care on a recurrent basis – allowing us to further shed
light on the underlying mechanisms behind the shock.
9 This
data is available on https://app.powerbi.com/view?r=eyJrIjoiODZmNGQ0YzItZDAwZi00M
zFiLWE4NzAtMzVmNTUwMThmMTVlIiwidCI6ImVlNGUxNDk5LTRhMzUtNGIyZS1hZDQ3LTVmM2NmOWRlODY2N
iIsImMiOjh9.
143.1 Before and after the arrival of COVID-19
We begin by documenting the impact that the arrival of COVID-19 had, in partic-
ular, the initial wave in March 2020, on care provision contrasting both quantity as
well as quality of care before and after the arrival of the pandemic over time. We
separate three distinct regimes: i) before the pandemic, ii) during the first wave, and
iii) in all subsequent waves. Contrasting across these three regimes is helpful, as
naturally, the pre-pandemic performance and implied trends allow us to construct
a simple counterfactual evolution of how NHS performance may have evolved over
time, had it not been for the arrival of the pandemic.
Specifically, we estimate simple models of the form
y p,t = α p + νt + e p
for a measure of quantity or quality of NHS care provided in provider p during
month t. The provider fixed effect, α p , captures time-invariant provider specific
idiosyncratic level differences in both quality and quantity of care, while the time
fixed effects νt capture the distinct time variation in performance common across
providers. The arrival of the pandemic constitutes a common shock that affected the
health care system as a whole, while the subsequent waves were handled notably
differently with much more specific interventions and decisions to maintain service
quality taken at the individual provider level.
The above allows us to estimate counterfactual time-paths and evaluate how
the estimated performance ν̂t compares with such counterfactual time-paths. We
distinguish three time periods: the period prior to the pandemic up to March 2020;
the period of the first lockdown constituting major disruption of the health care
system from March to June 2020; and the period since July 2020. Contrasting the ν̂t
across the three regimes allows us to estimate the gaps in health outcomes and the
extent to which such gaps may or may not be closed.
The analysis will highlight that, while the outsets of the pandemic may have
15been a system-wide common shock, the ongoing pandemic may exert different
pressures across providers. While the arrival of the pandemic marks an unexpected
shock, the initial reaction to the shock may not be representative of the ongoing
pressures that COVID-19 poses on hospitals in the foreseeable future. Hence, we fo-
cus explicitly on exploiting cross-provider variation across NHS trusts in the within
pandemic exercise.
3.2 Within pandemic
The second set of exercises focuses on the period since March 2020, documenting
how, within the pandemic, the idiosyncratic variation in COVID-19 cases affecting
health care providers differentially, impact the quantity and quality of care pro-
vided. That is, we specifically document how ongoing pandemic pressures affect
the provision of care.
For that purpose we estimate specifications of the form
y p,t = α p + νt + β × COVID-19 p,t + ξ × X p,t + e p
Compared with the previous exercise, this in essence studies to what extent we
can attribute the variation around the common time fixed effects νt since March
2020 can be attributed to providers being differentially affected by the pandemic
since March 2020. Here, COVID-19 p,t captures a provider-specific COVID-19 expo-
sure measure, such as, the number of COVID-19 cases within the provider’s typical
area of operation; the number of COVID-19 hospital cases; the number of admit-
ted COVID-19 patients or the number of patients on mechanical ventilation beds.
Throughout the results presented in the main body include additionally a control
capturing the log number of COVID-19 cases detected across MSOAs that make up
the main catchment area of a different provider. This is naturally a very demand-
ing specification as it puts specific focus on pressures faced by providers in form
of hospital admissions of said COVID-19 cases. Depending on the outcome data
16of interest, we estimate more demanding specifications that, for example, capture
provider and function area specific fixed effects, capturing, e.g. different demand
levels for various health care services such as cardiology or dermatology services.
Identification assumption We treat the variation in COVID-19 pressures hitting
different NHS providers as exogenous. Given the notable heterogeneity both in
intensity and timing of COVID-19 infections across the country this is not an un-
reasonable assumption to make. Throughout the exercises presented in the main
paper we control for the extent of community transmission of COVID-19 within
catchment areas of different providers. This implies that we put specific focus on
the shocks to COVID-19 cases hitting different providers at different points in time
which, in turn, is a function of the underlying demographic makeup of the pop-
ulation in the catchment area. All results are robust, and most even larger, when
excluding the measure of community transmission as control variable as shown in
Appendix Tables A1–A8.
Treating COVID-19 pressures at the provider level as an exogenous source of
variation would be violated, if, for example COVID-19 patients were avoiding spe-
cific providers that are under significant distress already – that is, if patients sick
with COVID-19 purposefully avoid going to a hospital that has notable new num-
bers of COVID-19 patients. Since the extent to which providers are overwhelmed in
local areas is not public knowledge and given that COVID-19 patients can deterio-
rate quickly, it is unlikely that such strategic behavior would affect which hospital to
go to. Similarly, our identification strategy is relying on the assumption that there is
no reverse causality, i.e. that COVID-19 patients do no strategically avoid hospitals
due changes in non-COVID-19 related care which we use as dependent variable.
Again this sort of sophisticated behavior is unlikely due to lagged publication of
the data and the urgency of the situation.
173.3 Non-COVID-19 excess mortality
As indicated, the data from NHS Digital (2021) provide us with an estimate of
the expected mortality of hospital admissions for each diagnostic based on a range
of patient characteristics. Importantly, this excludes all COVID-19 related deaths.
We study whether with the start of the pandemic, the structure of excess deaths
is different compared to before the pandemic started, and further, to what extent
month-on-month variation in COVID-19 pressures is affecting the excess deaths.
As the data is reported at the monthly level but as twelve month cumulative rolling
totals this dampens the month-on-month variation. We carry out two complemen-
tariy exercises that document however, that this is not an issue.10 The reported data
in a given reporting month t provides the cumulative totals of the observed- and
expected deaths ∑tτ =t−12 Obs p,τ and ∑tτ =t−12 Exp p,τ . This implies we can compute
the month-on-month changes as
t t t −1 t −1
∆Excess p,t =[ ∑ Obs p,τ − ∑ Exp p,τ ] − [ ∑ Obs p,τ − ∑ Exp p,τ ] (1)
τ =t−12 τ =t−12 τ =t−13 τ =t−13
=[Obs p,t − Exp p,t ] − [Obs p,t−13 − Exp p,t−13 ].
This implies we can capture the number of excess deaths in a given month t, rather
than the twelve month rolling window in the above expression. If we denote the
genuine monthly excess number of deaths as Excess p,t = Obs p,t − Exp p,t , we can
exploit month-on-month variation in COVID-19 pressures at the hospital level by
estimating variations of the below specification:
Excess p,t = αi + νp + γt + β × COVID-19 p,t + ξ × X p,t + νi,p,t . (2)
10 A monthly rather than twelve month rolling sum of the excess mortality data was requested by
the researchers via email and via a Freedom of Information request – all communication relating to
this FOI request can be tracked here https://www.whatdotheyknow.com/request/shmi_data_by_p
rovider_at_monthly.
18Crucially, given the above transformation, the vector of additional control variables
X p,t should include [Obs p,t−13 − Exp p,t−13 ] as control variable.
Alternatively, we also estimate alternative specifications that do not transform
the data in the above fashion. Given the reporting in twelve month cumulative to-
tals this implies we need to measure the COVID-19 pressures not month-on-month
but similarly compute cumulative totals over a time window. For example, we can
estimate the impact of COVID-19 pressures in the last ξ month relative to the re-
porting month t on the log difference in observed- vis-a-vis expected number deaths
cumulatively in the last twelve months as in
t t ξ
log ∑ Obs p,τ − log ∑ Exp p,τ = νp + γt + β × ∑ COVID-19 p,τ + νp,t .
τ =t−12 τ =t−12 τ =t−12
We explore a range of variations of the above to document the robustness.
We next present some descriptive evidence across the outcomes.
4 Quantity and quality of care before and after the ar-
rival of COVID-19
We begin by presenting some descriptive statistics that highlight how the pandemic
affected both the quantity as well as the quality of care being provided by the NHS
system across a broad range of outcome measures.
4.1 A&E attendance and waiting times
Quantity In the top left corner of panel A of Figure 1 we see the absolute number
of visits to A&E departments by month. The pre-pandemic months are marked as
gray circles, the observations during the first wave by red diamonds, and after the
first wave by blue triangles. The averages during these three periods are added as
horizontal lines. We see that before the pandemic the absolute number is relatively
19stable, oscillating around a mean of 1.3 million visits per month. We see that during
the first wave, visits drop sharply to an average of 0.9 million visits. This drop can
likely be attributed to both people being less exposed to other infectious diseases
and risky activities during the lockdown, as well as a demand effect driven by
people fearing potential exposure to COVID-19, and therefore avoiding a visit to
A&E. After the first wave, we see strong fluctuations trending upwards towards the
original pre-pandemic levels.
Quality In the top left corner of panel B of Figure 1 we show that the share of
visits to A&E whose waiting times are less than the NHS set goal of 4 hours. Pre
pandemic, the share fluctuates around 80% with seasonal variation. While the share
increases with onset of the pandemic to an average of almost 90% during the first
wave, the share begins to drop post pandemic, and is around 65% for the last
months in the dataset. Looking at the aggregates of the three defined periods in
Table 1, we see in column (5) that after the first wave the share of those waiting
less than the NHS set goal of 4h is 3.8 percentage points (pp) lower than before the
pandemic.11
4.2 Referrals to specialist treatment
Quantity In the top right corner of panel A of Figure 1 we see the absolute number
of completed referrals to specialists. Before the pandemic, on average about 1.2
11 Following a similar logic as panel B of Figure 1, we also look at the increase in the fat tail of
waiting times in Appendix Figures A2 and A3. Moreover, we show the distributions of qualities in
the different time intervals in Appendix Figure A4. Pre-pandemic, close to no patients wait more
than 12 hours when visiting A&E. However, in the mean time the share is rising steadily to 1%.
While only 2.5% wait more than 36 weeks for a referral to a specialist before the pandemic, this
share skyrockets to 15% after the first wave, before stabilizing at just below 10%. For diagnostics,
the fat tail of long waits above 12 weeks is nearly non-existent before the pandemic but peaks at
about one third during the first wave, and still remains fairly flat above 10% since. The share of
those waiting more than 104 days for cancer treatment after an urgent referral is close to 6% before
the pandemic, but almost doubles at one point during the first wave and is close to 9% over the last
months in the dataset. In Figure 2 we look at the time fixed effects when running the regressions at
the trust level. The patterns are confirmed and the confidence intervals suggest that the increases in
high waiting times is not driven by few trusts.
20million referrals to specialists are completed per month. During the first wave
this number drops dramatically by almost half to around 0.7 million completed
referrals. Following the first wave the number of completed referrals rebounds to
pre-pandemic levels.
Quality In the top right corner of panel B of Figure 1 we see the share of referrals
that are completed within the NHS set goal of 18 weeks, which trended down-
wards before the pandemic hitting 80% before the outbreak. While the initial levels
during the onset remain at comparable levels, the share drops to two-thirds after
the first wave, then shoots up again yo almost 80% before trending downwards to
around three-quarters in the last months of the dataset. The aggregates in Table 1
indicate that the share of completed referrals within the NHS set goal of 18 weeks
is 2.4pp and 7.7pp lower during and after first wave compared to before the pan-
demic. While during the first wave the share increases by 4.8pp for the admitted
and decreases by 4.9pp for the non-admitted patients, after the first wave the drop
is similar across both types of patients.
4.3 Diagnostic waiting list
Quantity In the bottom left corner of panel A of Figure 1 we see the absolute
number patients on the diagnostic waiting list. Before the pandemic the average
length of this waiting list is below one million people. When the pandemic hits, the
list shortens briefly during first two months of the first wave and then increases to
almost 1.4 million people in the last month of the dataset.
Quality In the bottom left corner of panel B of Figure 1 we see the share of patients
on the waiting list who have been waiting less than the NHS set goal of 6 weeks.
While pre pandemic the great majority of the list is waiting less than 6 weeks, with
only very moderate fluctuations across months, during the first wave the share of
the list waiting less than 6 weeks drops to nearly half. After the first wave this share
21increases but stabilizes below 80%. The aggregates in Table 1 suggest that instead
of 97% of the waiting less being within the NHS set goal before the pandemic, the
shares drops to 56% during and 71% after the first wave.
4.4 Cancer treatment and detection
Quantity In the bottom right corner of panel A of Figure 1 we present the total
number of urgent suspected cancer patients receiving their first treatment. We see
that before and after the first wave the average levels of treatments is very similar at
13,326 treated cases per month. However, during the first wave many urgent treat-
ments are displaced dropping by an average of 2,352 cases per month. In panel A
of Appendix Figure A5 we further show that the absolute number of consultations
with specialists following urgent referrals fluctuates around an average of 189,983
per month before the pandemic, and drops below 100,000 at the height of the first
wave, before increasing above pre-pandemic levels after the first wave. A similar
pattern can be observed for treatments following decisions to treat.12 During the
first wave the monthly average of urgent referrals being seen by a specialist dropped
by 60,772 cases per month as can be seen in Table 1.
Given that cancer is a serious negative shock and an outcome which is unlikely
to be strongly affected by short-term behavioral responses to lockdowns, we look
into the heterogeneity across different types of cancer. In Panel A of Appendix
Figure A6 we show the absolute number of cancer referrals that received their first
treatment for breast, lower gastrointestinal, lung, skin, urological, and other can-
cers drop drastically during the first wave. However, only for lung and urological
cancer levels remain below pre-pandemic levels after the first first wave. In panel B
of Appendix Figure A6 we show the number of urgent referrals leading to a con-
sultation with a specialist. Even for suspected children’s cancer, a disease affecting
12 The difference between referrals to first treatment, with a goal of 62 days, and decisions to
treat leading to first treatment, with a goal of 31 days, is that the referrals to first treatment measure
includes only urgent cases, whereas decisions to treat leading to first treatment include all suspected
cancer types.
22a demographic group which in general is only mildly affected by COVID19, the
number of urgent referrals leading to a consultation with a specialist drops from
an average above 800 cases per month before the pandemic to less than half at the
peak of the first wave, despite the arrival rate of this disease likely being constant.
Quality In the bottom right corner of panel B of Figure 1 it becomes clear that
waiting times to first treatment has increased over the course of the pandemic. For
the last observations only two-thirds of cases receive their first treatment within the
NHS set goal of 62 days. Panel B of Appendix Figure A5 shows that the share of
referrals being seen by a specialist within 14 days remains close to pre-pandemic
levels of above 90% during the first wave, but deteriorates to almost 75% after the
first wave. Similarly, the share of treatments taking place within 31 days after the
decision to treat drops down to below 94% compared to an average above 96%
before the pandemic. In panel A of Appendix Figure A7 we show for each type of
cancer that the quality, measured in terms of receiving treatment within less than
62 days after an urgent referral, suffers not only during the first wave, but that the
negative impact persists, and in some cases even deteriorates further in more recent
months.
4.5 Across trust dispersion
For each of the previously discussed outcomes we also run regressions at the trust
level, while including trust and time fixed effects, and clustering the standard errors
at the trust level. In Figure 2 we plot the coefficients for each month with the
corresponding 90% confidence interval. For the sake of interpretation we center the
average of the pre-pandemic coefficients around zero such that coefficients during
the pandemic can be interpreted as deviations from the mean in normal times. Both
the patterns for quantity (panel A) and quality (panel B) are confirmed.13
13 In Appendix Figures A8 and A9 we show the same coefficients for difference types of cancer.
234.6 Overall non-COVID-19 excess mortality
Figure 3 provides a picture capturing the evolution of this estimate excess death up
until February 2021 summed up across NHS trusts. Reassuringly, we observe that
the estimate of excess death is close to zero up until February 2020, before shooting
up. In total, we estimate that there are 4,003 excess deaths that are not related to
COVID-19 from March 2020 to February 2021. These are cases that, under normal
circumstances, considering the patients characteristics, should not have died within
30 days of their hospital episode.
5 Within pandemic pressures on non-COVID-19 care
resulting from COVID-19 admissions
In the previous section we saw that both quantity and quality across a range of treat-
ments and services deteriorated drastically with the arrival and continuation of the
pandemic. The results, however, also suggest that there is significant heterogene-
ity across NHS trusts and across time. We aim to understand that heterogeneity a
bit better. While the arrival of the pandemic marks an unexpected shock, the ini-
tial reaction to the shock may not be representative of the ongoing pressures that
COVID-19 poses on hospitals in the foreseeable future.
For each of the outcomes, we regress measures of quantity and quality discussed
previously on three different measures of COVID-19 pressures at the provider level:
the logs of i) new COVID-19 admissions, the number of COVID-19 cases in hospital,
and the number of COVID-19 cases on ventilators. We control for an exhaustive
set of fixed effects adapted to the unit of analysis and listed at the bottom of the
regression results in Tables 2-5, while clustering standard errors at the provider
level.
245.1 A&E attendance and waiting times
In columns (1) and (2) of Table 2 we do not see much of a relationship between
COVID-19 pressures and A&E visits or admissions. However, in column (3) - (5), we
find that COVID-19 related pressures exhibit a positive and significant relationship
with increases in the share of patients waiting more than 4 hours, 4-12 hours, and
more than 12 hours. For instance, in column (3) of panel A, a 1% increase in new
COVID-19 admissions is associated with an increase of 0.03% in the share of visitors
to A&E waiting more than the NHS set goal of 4 hours. While an increase of 0.03%
might not sound dramatic, one has to bear in mind that COVID-19 admissions
fluctuate wildly during the observed period. Increases of 100% are not uncommon
as can be seen in Appendix Figure A10 which shows the distribution of month on
month changes in log(1+new COVID-19 admissions) at the trust level. The standard
deviation of changes is 0.65 and 13.5% of observations see swings of more than 100
log points.
5.2 Referrals to specialist treatment
In Table 3 we look at three different groups of outcomes for referrals: i) total refer-
rals, ii) length of the waiting list, and iii) waiting times. When outcomes are related
to multiple months of actions, we capture cumulative pressures by summing pres-
sures over the corresponding number of months. In column (1) we see that new
referrals tend to decrease when new COVID-19 admissions or cases in the hospital
increase. However, when inspecting columns (2) and (3) it becomes clear that this
effect is predominantly driven by completed referrals amongst admitted patients
who see a drop of 0.09% when new COVID-19 admissions increase by 1%.
In column (3) we see a weakly positive relationship between the length of the
waiting list and pressures. However, in column (5) we find that the aggregate
waiting list exhibits a strong significant relationship with pressures, for instance,
increasing by 0.03% with a 1% increase in COVID-19 cases on ventilators.
25Concerning waiting times the evidence is stark. The share of referrals waiting
more than the NHS set goal of 4 weeks in column (7), 8 weeks in column (8), or
12 weeks in column (9) is highly significant for each of the proxies for COVID-19
related pressures.
5.3 Diagnostic waiting list
In column (1) of Table 4 we find no significant evidence about the relationship
between COVID-19 pressures and the quantity of diagnostic activities. A similar
conclusion can be drawn from the impacts on average waiting times or the share
waiting more than NHS set goal of 8 weeks. However, when we look at scans using
computerized tomography (CT), which are specialized scarce machines, we detect
a strong significant increase in waiting times and the share of referrals waiting for
a scan when new COVID-19 admissions increases. This can likely be explained
by the reliance on CT scans to gauge the extent of damage to the lung exerted by
COVID-19 and resulting congestions in the health care system.
5.4 Cancer treatment and detection
In Table 5 we look at how COVID-19 pressures relate to cancer consultations and
treatments. In columns (1) and (4) we show that neither the share of urgent referrals
seen by a specialist nor their waiting times seem to be systematically related to
COVID-19 pressures. However, for treatments we see both a significant reduction
in those following the decision to treat as well as those following referrals when
COVID-19 pressures increase. For instance, as can be seen in column (3), a 1%
increase in new admissions is associated with a 0.02% drop in those receiving urgent
first treatment. Moreover, in columns (5) and (6) we show that waiting times for
treatments following the decision to treat and referrals increase substantially with
COVID-19 pressures.
265.5 Non-COVID-19 excess mortality
We next turn to study the impact of ongoing COVID-19 pressures on non COVID-
19 hospital excess mortality. The analysis of aggregate figures suggests that with
the onset of COVID-19, there has been a quite persistent increase in non COVID-19
related hospital excess mortality. We next explore to what extent there is cross-
provider variation in this excess mortality and to what extent it can be linked to
COVID-19 induced pressures.
The results from this analysis are presented in Table 6. Across the three panels
we capture different measures of COVID-19 pressures with the average monthly
number of new daily hospital admissions as main measure being presented in Panel
A. The dependent variable measures the month on month change in the number
of excess deaths, which, as was indicated in section 4.6, approximates the monthly
number of excess death quite accurately as long as we control for the base effects
Obs p,t−13 − Exp p,t−13 . Throughout Panel A, the results are quite stable suggesting
that increased COVID-19 admission numbers at the provider level translates into
some notable structure in the estimate of the excess deaths. The point estimates
suggest that a 10% increase number in average daily new hospital admissions due to
COVID-19 translates into 0.41 additional excess deaths. This result remains robust
across different specifications, including, adding linear-time trends at the provider
level in column (6).
This suggests that, in particular, pressures resulting from increases in new COVID-
19 hospital admissions and occupation of beds with mechanical ventilation is asso-
ciated with significant worsening survival chances for patients that get admitted
to hospital for non COVID-19 reasons. Figure A17 suggests that the effects are
strongest in hospitals that experience, based on its empirical distribution, relatively
large shocks of new COVID-19 patients being admitted. Further, Appendix Tables
A9, A10 and A11 find very similar results when adapting the empirical design to
study the excess mortality data as reported by NHS digital as twelve months rolling
27cumulative totols, for which, we then construct a rolling cumulative measure of the
COVID-19 pressures to match that data structure.
The diagnosis-specific data is too sparse to allow us to estimate the preferred
specification exploiting month-on-month changes.14 Hence, we work with the cu-
mulative twelve month rolling window design to study to what extent COVID-19
pressures in the last three months affect the cumulative twelve month rolling sum
of excess death by diagnostic group. Figure A18 presents results from estimating
such a heterogenous effects version focusing on 15 of the 142 diagnosis codes for
which the vast majority of NHS providers have a near complete record of observed
and expected deaths, along with the number of spells. The results suggest that the
increase in mortality at the provider level is driven, to a significant extent, by ur-
gent care needs, such as heart attacks (acute myocardial infraction). This suggests
that COVID-19 induced hospital pressures are causing a notable increase in non
COVID-19 related excess deaths due to, likely, a worse quality of care. We next
explore this in some detail.
6 Mechanisms
Naturally there is a broad range of mechanisms that may be at play. In this section
we focus on two datasets to explore the underlying mechanisms. We focus in par-
ticular on the cancer care as well as the excess death dataset as they provide hard
outcome measures capturing performance measures that are end-to-end.
6.1 Staff absence rates
We begin by studying staff absence rates. Using monthly data at the provider by
staff group level measuring the number of full-time equivalent (FTE) days that are
14 This
is driven by the noisiness of month-on-month changes due to the fact that confidentiality
protection implies many missing observations once the excess death is broken down by diagnosis
group.
28You can also read