Parks and Recreation Master Plan 2022 - Parks & Recreation Master Plan
←
→
Page content transcription
If your browser does not render page correctly, please read the page content below
2022
Parks and Recreation Master Plan

        Parks & Recreation Master Plan
City of New Baltimore

City of New Baltimore Recreation Plan Amendment
            Resolution by City Council

                     Acknowledgements
          City of New Baltimore City Administration
                          John Dupray, Mayor
      Bonnie McInerney-Slater, Administrative Assistant to the Mayor
                        Marcella Shinska, Clerk
                        Jeanne Bade, Treasurer

                             City Council
                         Thomas Semaan, Mayor
                       David Duffy, Mayor Pro-Tem
                               Ryan Covert
                              Jacob Dittrich
                                Mel Eason
                            Florence Hayman
                            Laura Szymanski

               Parks and Recreation Commission
                         Dawn Wolschleger, Chair
                             Michelle Anulli
                             Joseph Glinski
                            Eric Haydamack
                              Amber Laske
                              Michael Zoli

                         Special Thanks To
                 The Residents of the City of New Baltimore
      City of New Baltimore Parks and Recreation Staff and Volunteers

                             Plan Authors
               Tim Novak – Director of Parks & Recreation
         Adam Abraham – Assistant Director of Parks & Recreation

                  Parks & Recreation Master Plan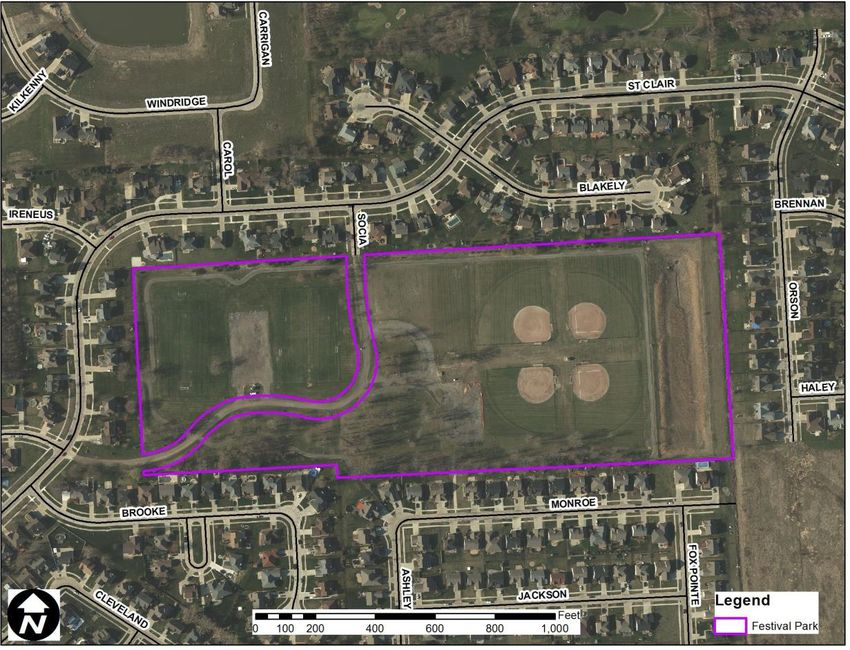
City of New Baltimore

                          Table of Contents
Section 1.0 Community Analysis                                1
Introduction                                                  2
Purpose                                                       3
Regional Setting                                              4
History                                                       4
Demographic and Economic Characteristics                      5
Population Analysis                                           5
Age                                                           7
Age by Lifecycle Category                                     9
Gender and Race Characteristics                               10
Household Characteristics                                     11
Labor Force Participation                                     13
Disability Characteristics                                    13
Demographic Considerations                                    13
Community Land Use and Natural Features                       14
Land Use                                                      15
Natural Features                                              17

Section 2.0 Administrative Structure                          18
Introduction                                                  19
City Council                                                  19
Commission of Parks and Recreation                            20
City of New Baltimore Recreation Department                   20
Recreation Programming                                        20
Recreation Budget                                             21

Section 3.0 Parks and Recreation Inventory                    22
Introduction                                                  23
State and Regional Inventory                                  23
Macomb County Inventory                                       24
City of New Baltimore Inventory                               26
County Line Park                                              27
County Line Pathway                                           28
Lillian Lucas Trail System                                    29
Festival Park                                                 30
Maynary “Red” Aurand Memorial Park                            32
Reginald-Brady Park                                           34
Ruedisale Point Park                                          36
Walter & Mary Burke Park                                      38
                             Parks & Recreation Master Plan
City of New Baltimore

Anchor Bay School District Site                                    40
All-Star Sports Center                                             41
Anchor Bay Woods Preserve                                          42
Bev’s Dance Studio                                                 43
Cedar Glen Golf Club                                               44
Sunsation Harbor Marina                                            45

Section 4.0 Planning and Public Input Process                      46
Introduction                                                       47
Planning Methods                                                   47
Public Input Process                                               48

Section 5.0 Goals and Objectives                                   49
Introduction                                                       50
Provide Parks and Recreation Opportunities                         50
Foster Community Development and Engagement                        51
Promote Environmental Stewardship                                  51
Encourage Healthy Lifestyles                                       52
Support Economic Development                                       52

Section 6.0 Action Plan                                            53
Introduction                                                       54
Walter and Mary Burke Park                                         54
Reginald Brady Park                                                55
Ruedisale Point Park                                               56
Maynard “Red” Aurand Memorial Park                                 57
Lillian Lucas Trail System                                         58
Festival Park (Bay-Rama Site)                                      58
City of New Baltimore Parks and Recreation Center                  59
County Line Park                                                   59
Anchor Bay School District Site                                    59
Non-Motorized Trail Network                                        60
Anchor Bay Woods Preserve                                          61
Water Trails                                                       61

                                  Parks & Recreation Master Plan
Community Analysis

Section 1.0
Community Analysis

City of New Baltimore
Parks and Recreation Master Plan

1
Section 1.0

Introduction
The City of New Baltimore is located in eastern Macomb County on the shores of Lake St. Clair. Once
known as a nautical oasis on the outskirts, the City of New Baltimore has evolved into a hub of activity
along Anchor Bay. New Baltimore has morphed into a budding suburban community which is
appealing to residents, businesses, and visitors because of its modern conveniences nestled amongst
the unique historical character and charm of the community. The City is anchored by its traditional
downtown boasting an emergent local economy, viable residential housing stock offering a mixture
of housing options, and close proximity to Macomb County’s greatest natural resource, Lake St. Clair.

Over the past decade the allure of the City of New Baltimore continued to spur considerable growth
for the community. In 2000, New Baltimore had a population of 7,405 residents with 2,942
Households. The 2020 Census concluded that the City of New Baltimore has a population of 12,358
residents with 4,672 households. In two decades, the City had a 67% increase in population and a
59% change in the number of households. This growth, attributed primarily to residential
construction, has ushered the City into a promising era of community progress and opportunity.

Numerous variables come into play when a city develops at the rate New Baltimore has experienced
over the past three decades. The complexities of physical infrastructure encompassing roads, water
and sewer, the placement and density of various land uses, and the administration of basic city
services become strained and spread thin as a City grows. A municipality must act efficiently and
effectively in order to meet community needs as the population booms.

Along with the strain to maintain governmental services, there is a greater need for amenities beyond
simply physical infrastructure and tax collection. One community-based service that is continually at
the forefront of municipal service expansion is recreational programs and facilities. A quality, high-
functioning Parks and Recreation department has the ability to unify a local community. Parks,
beaches, youth sports, dance classes, leisure programs, senior services, and recreation centers
quickly become a source of pride for a community and its residents. These community investments
become destinations and identifiers which allow residents and visitors to engage and experience all
that a city has to offer. As the City of New Baltimore has evolved and grown into a burgeoning
suburban community, the City has a great opportunity and ability to evaluate, plan, and invest in
parks and recreation. The City of New Baltimore Parks and Recreation Master Plan 2022 provides a
mechanism for New Baltimore to consider its parks and recreation services and facilities at a
comprehensive level.

                                                                                                      2
Community Analysis

Purpose
The purpose of the Plan is to establish appropriate policies to guide the development of the City’s
recreation infrastructure and services. The preparation of this Recreation Plan also seeks to fulfill the
following objectives:

1.   Determine the City’s relationship with recreation providers at the local, regional, and state
     levels.

2.   Identify short and long-term recreation needs within the City of New Baltimore.

3.   Develop policies, programs, and procedures designed to address the City’s recreation needs.

4.   Identify needed capital improvements to parks and recreation facilities and programs to meet
     the recreation needs of all age groups.

5.   Explore innovative approaches to providing recreation services and programs.

6.   Establish an efficient and cost-effective structure for administering recreation programs.

7.   Encourage cooperative relationships and policies with other public, nonprofit, and private
     recreation providers.

8.   Include a capital improvement program, identifying specific projects and intended funding
     sources to be implemented over a specified time frame.

This Recreation Plan follows the planning guidelines established by the Michigan Department of
Natural Resources. It begins with an examination of relevant physical, social and economic
characteristics that may influence future recreation needs. Included in this analysis is an inventory of
existing recreation facilities available in or near the City of New Baltimore. The second part of the
Plan offers a summary of existing recreation needs based on recognized and accepted recreation
planning standards. Based on any identified deficiencies, and the City’s stated recreation goals and
objectives, a Plan for addressing these needs is offered. The Plan is further expanded to those projects
which are needed and can be financed over the next five (5) years. Other projects included in the
Plan are considered for implementation over a longer time frame.

3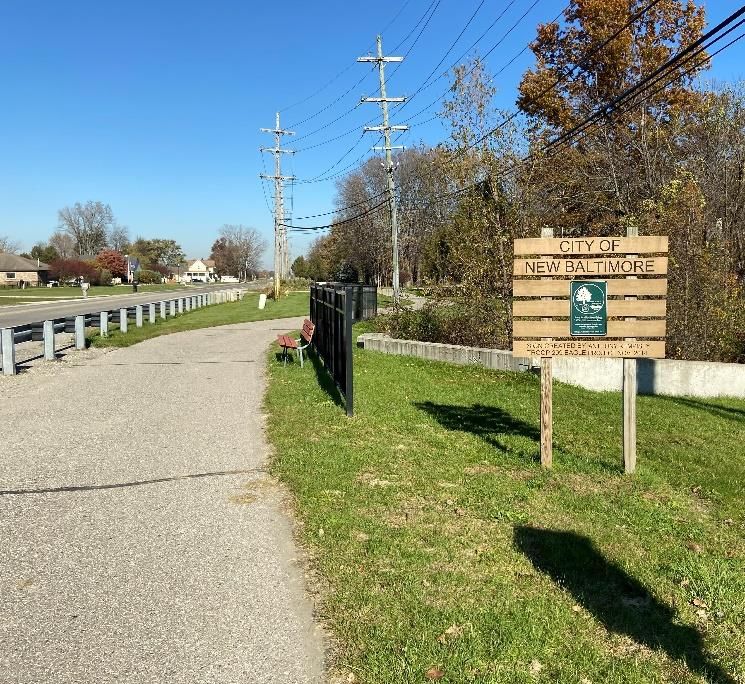
Section 1.0

Regional Setting                                       Map 1: New Baltimore Regional Setting
New Baltimore is located in an opportunistic
area in Southeast Michigan. Located on the
shores of Lake St. Clair, the City of New
Baltimore has an enormous ability to leverage
the power of this unique natural resource. The
City is also connected to the region through an
integrated transportation network. I-94 and M-
29 (23 Mile Road) provide quick access to and
from the community, the local street network
links the residents and visitors to major
destinations, and being only 25 miles north of
Detroit, New Baltimore is still connected to the
hub of the metropolitan region. Chesterfield
Township borders the City to the west and
north, while Anchorville frames the eastern
boundary of the community with Lake St. Clair
to the south. New Baltimore’s regional setting
will play an integral role in the short and long-
term parks and recreation planning efforts of
the community. As this plan is maintained and
implemented it is imperative that all
stakeholders acknowledge the role that New
Baltimore will fulfill in the region.

History
French hunters and fur trappers, in 1796, were
the first inhabitants of that portion of Macomb County that later became New Baltimore. They were
drawn to this area due to the close proximity to the Lake and other water features, which was helpful
with agriculture and trapping. The first evidence of a settled community came in 1845, when a Mt.
Clemens businessman, Alfred Ashley, platted 60 acres of land lying in what is today Downtown New
Baltimore. This settlement would become known as the Village of Ashley on September 20, 1851,
and quickly became home to a number of businesses.

Throughout its history, New Baltimore has been linked to the regional economy by virtue of the City’s
access to the waterfront and the region’s transportation network. In its early years, New Baltimore
took advantage of its waterfront location to operate port facilities exporting agriculture
and manufacturing products to other communities. As automobile transportation increased in
importance and travel patterns changed, so did the development of the City. The water and
waterfront were no longer the preferred way to move products and people. Faced with this realization,
the City of New Baltimore transformed into a focal point for resort, commercial, and recreational
activities along the waterfront.

                                                                                                    4
Community Analysis

The community began to thrive again in the early twentieth century due in large part to a number of
major destinations including an opera house, hotels, salt baths, summer and winter recreational
activities, saloons, a brewery and numerous resort and commercial establishments. In 1931 the City
of New Baltimore was officially incorporated. For many years the City remained a hub of activity.

Today the City of New Baltimore is still known for its proximity to the water, however, the majority
of activity and development within the community has focused more on residential housing and
commercial corridors. The City still boasts a traditional downtown core and many waterfront amenities
with many distinctive features and experiences.

It is evident that the critical mass and interest that once surrounded this community and its waterfront
is no longer as noticeable as it once was. This parks and recreation plan will provide the community
with a great opportunity to recapture the vibrancy that was once attributed to the City of New
Baltimore and its recreational services.

Demographic and Economic Characteristics
In order to develop a parks and recreation plan that is in tune to the current and future needs of the
City, a comprehensive demographic and economic analysis of the community is needed. The following
sub-sections will highlight a number of significant population and household trends that have shaped
the City of New Baltimore. These trends will undoubtedly have an impact on parks and recreation
planning. Beyond how many people live in your community, more refined demographic and economic
data will paint a more polished picture of the residents of the City of New Baltimore.

Population Analysis
Since the 1950’s the City of New Baltimore has experienced a steady increase in population from
decade to decade. In 1950, the City of New Baltimore had a population of 1,806 individuals. Over the
next three decades the City’s population would increase over 200% to 5,439 residents in 1980. From
1980 to 2000, the City’s population continued to grow at a slower pace adding 1,966 residents, or a
36% increase, to reach a population of 7,405. In 2020 the City of New Baltimore’s population reached
12,358 residents, which was a 67% increase for the past two decades.

    Table 1:              City of New Baltimore Population and Household Analysis
    Population and
    Household           Year                         Population             Household
                        2000                           7,405                    2,942
                        2010                           12,084                   4,434
                        2020                           12,358                   4,672
                        2035                           14,559                   5,934
                       Sources: U.S. Census Bureau

5
Section 1.0
The City’s population is projected to continue its upward trend over the next couple of decades with
the Southeast Michigan Council of Governments estimating New Baltimore’s population to reach
14,559 residents by 2035. The number of individuals that reside in a community alone does not
provide an adequate analysis of a community’s residency. Population distribution and density are
important factors to consider when developing comprehensive plans impacting recreational services,
programs, and facilities.

                              Map 2: Population by Census Blockgroup

The 2010 Census established six Block Groups within the City of New Baltimore. These population
nodes establish standard geographies which the Census Bureau utilizes to compute and track
population. Map 2 identifies the Census Block Groups, their population, and the number of residents
per acre within each area. The distribution of the Census Block Groups highlights a number of
interesting aspects of New Baltimore’s population. The six Block Groups range in population from
5,003 to 735 residents, and in size from 1,171 to 161 acres. Newer suburban residential development
in the northern and eastern portions of the community has increased the population and density of
two Block Groups, 260992200023 and 260992200013.

                                                                                                   6
Community Analysis
The development in these areas has tipped the population scales of the community with the majority
of residents now living in areas north of Green Street. The Census Block Groups that border the Lake
still possess a strong core of residents. These four Block Groups, 260992200022, 260992200021,
260992200012, and 260992200011, account for just over 36% of the City’s population and combined
have a population density of 2.32 residents per acre. When analyzing the lakefront area, it becomes
evident that there is no more vacant land to be developed. Any new residents or development
opportunities will most likely occur in the areas north of Green Street.
Age
Age characteristics are useful demographic indicators for parks and recreation planning purposes. For
example, a community’s age composition will help determine the appropriate mix of needed
recreation services and facilities. A younger population suggests the need for more active recreational
services, programs and facilities. An older population would have more demand for walking trails,
exercise areas, dance halls, craft rooms, pool rooms and more passive recreational amenities. In
1990, the City of New Baltimore’s median age was 33.2. By 2000 it shot up to 36.2, and in 2010 it
reached 37.1, and it currently sits at 40.3. Over the past two decades the City’s median age has
increased by 4 years. Clearly on the surface this trend illustrates that the City of New Baltimore is
aging, but that does not fully describe the City’s demographic change. Over the past decade New
Baltimore’s median age increased by 3.2. This can be attributed to the increase of population from
the last two decades and their children aging. This age increase is crucial to determining how the City
will plan and implement new amenities and programs.
Table 2: Median Age
Median Age Analysis
1990 2000 2010 2020
City of New Baltimore 33.2 36.2 37.1 40.3
Macomb County 33.9 36.9 39.9 40.9
Michigan 32.6 35.5 38.9 39.5
United States 32.9 35.3 37.2 38.0
Source: U.S. Census Bureau
7Section 1.0
Table 3: Age Groups
City of New Baltimore Population Change by Age Groups
1990 2000 2010 2020 Change
2010-2020
Age Number % Number % Number % Number %
Under 5 402 6.93% 540 7.29% 856 7.1% 646 5.2% -210
5 to 9 363 6.26% 529 7.14% 1,049 8.7% 804 6.5% -245
years
10 to 14 404 6.97% 531 7.17% 1,040 8.6% 1,010 8.2% -30
years
15 to 19 418 7.21% 436 5.89% 798 6.6% 893 7.2% 95
years
20 to 24 457 7.88% 353 4.77% 530 4.4% 717 5.8% 187
years
25 to 34 1,053 18.16% 1,118 15.10% 1,362 11.3% 1,086 8.8% -276
years
35 to 44 922 15.90% 1,425 19.24% 2,233 18.5% 1,749 14.2% -484
years
45 to 54 645 11.12% 1,099 14.84% 1,813 15.0% 1,926 15.6% 113
years
55 to 64 454 4.31% 655 5.42% 1,266 5.3% 1,790 14.5% 524
years
65 to 74 388 6.69% 374 5.05% 684 5.7% 1,089 8.8% 405
years
75 to 84 241 4.16% 273 3.69% 359 3.0% 528 4.3% 169
years
8five 51 0.88% 72 0.97% 138 1.1% 120 1.0% -18
years
and over
Total 5,798 100% 7,405 100% 12,084 100% 12,358 100% 230
Source: U.S. Census Bureau
Between 2010 and 2020, only half of the Census age groupings in the City of New Baltimore increased.
While the 35 to 44 and 45 to 54 age groups account for 30% of the City’s population, the past decade
saw considerable decreases in the Under 5, 5 to 9, 25 to 34, and 35 to 44 years groups. In 2010 the
four age groups that include all residents 19 years and younger encompassed over 30%. This dropped
to 27% in 2020, the same as these groups contained in 2020. Even though the number of children
within the City is decreasing, it is important to highlight that the elderly age groups in New Baltimore
are still increasing. The three age groups encompassing New Baltimore’s 65 and over population
account for 14.1% of the total population in 2020, an increase from 9.8% in 2010.
8Community Analysis
Age by Lifecycle Category
A more understandable picture of the City’s age distribution is possible when individual age groups
shown on the previous table are combined into a smaller number of groups, which more closely
resemble identifiable stages of a normal human lifecycle. Selected categories and the age intervals
that they represent include: pre-school (0-4), school (5-19), young adult (20-24), family formation
(25-44), middle-age (45-64), and seniors (65+). The percent of the City’s population that falls into
each of these categories is shown in Table 4 for New Baltimore and Macomb County for 1990, 2000,
and 2010.
Table 4: Lifecycle Category
Age By Lifecycle Category Analysis
New Baltimore
1990 2000 2010 2020
Life Cycle Number % Number % Number % Number %
Pre-School (Under 5) 402 6.93% 540 7.29% 856 7.08% 646 5.2%
School (5-19) 1,185 20.44% 1,496 20.20% 2,887 23.89% 2,707 21.9%
Young Adult (20-24) 457 7.88% 353 4.77% 530 4.39% 717 5.8%
Family Formation 1,975 34.06% 2,543 34.34% 3,595 29.75% 2,835 22.9%
(25-44)
Middle-Age (45-64) 1,099 18.95% 1,754 23.69% 3,035 25.12% 3,716 30.1%
Seniors (65+) 680 11.73% 719 9.71% 1,181 9.77% 1,737 14.1%
Total 5,798 100% 7,405 100% 12,084 100% 12,358 100%
Macomb County
1990 2000 2010 2020
Life Cycle Number % Number % Number % Number %
Pre-School (Under 5) 48,914 6.82% 51,062 6.48% 48,815 5.80% 47,739 5.5%
School (5-19) 142,682 19.89% 156,675 19.88% 165,810 19.72% 104,870 12.05%
Young Adult (20-24) 53,688 7.48% 44,772 5.68% 49,511 5.89% 53,640 6.2%
Family Formation 236,119 32.91% 248,217 31.49% 219,832 26.14% 220,447 25.33%
(25-44)
Middle-Age (45-64) 147,540 20.57% 179,772 22.81% 236,830 28.16% 248,659 28.57%
Seniors (65+) 88,457 12.33% 107,651 13.66% 120,180 14.29% 144,390 16.59%
Total 717,400 788,149 840,978 870,325
Source: U.S. Census Bureau
9Section 1.0
Each lifecycle category is a useful indicator of population trends. For example, a rise in the pre-school
and school age categories would strengthen the need for more youth recreational services, while an
increase in the senior lifecycle category would suggest a need for more passive recreational services
and amenities.
In 2000, the Pre-School lifecycle category accounted for 7.29%, 540 residents, of New Baltimore’s
population. In 2020, that lifecycle group dropped to 5.2%, or 646 residents. Children in the School
lifecycle category had a differing trend, increasing slightly in the same time period. In 2000, the City
of New Baltimore had 1,496 children (20.2% of the total population), and in 2020 the number reached
2,707 children (21.9% of the total population). By combining these two lifecycle categories it becomes
evident that in 2020 over 25% of New Baltimore’s population was under the age of 20. A decrease
in the Family Formation (25-44) lifecycle category, 2,835 residents (22.9% of the total population) in
2020, demonstrates that many of the people who moved to New Baltimore in the early 2000’s have
stayed, and they and their children are moving into new lifecycle categories.
Analyzing the other spectrum of the lifecycle categories illustrates that the City’s elderly population is
growing considerably. The number of Seniors (65+) increased from 2000 to 2020 by over 1,000
residents (719 to 1,737), and the percentage of Seniors as a part of the City’s whole population
increased from 9.71% to 14.1%. The Middle-Age (45-64) lifecycle category also saw a substantial
increase in population. From 2000 to 2020 the number of Middle-Age residents in the City of New
Baltimore grew by almost 2,000 residents, from 1,754 to 3,716. With over 44% of the City’s
population over the age of 45, New Baltimore must be cognizant of the potential for this number to
grow over the next decade as the Family-Formation residents continue to age.
Gender and Race Characteristics
Female and male residents of New Baltimore are only separated by 34 people. Females comprise
50.14% of the City’s population, compared to 49.86% for males. Since 1990, the proportion of female
residents has hovered between 51 and 52 percent, so the City is now seeing a slightly more neutral
distribution.
Based on the results of the 2020 Census, 93.7% of New Table 5: Gender
Baltimore’s population is white. The second largest race
in the City is Black or African American accounting for 2020 Male/Female Distribution
3.2% of the City’s population. The Hispanic or Latino Number Percentage
population of New Baltimore is 221 residents, 2.3% of Females 6,196 50.14%
the City’s total population. Over the past decade New
Baltimore’s racial composition has changed very little, Males 6,162 49.86%
seeing only a slight increase in minority residents. Source: U.S. Census Bureau
10Community Analysis
Table 6: Race
City of New Baltimore Race Analysis 2020
Number %
White 11,574 93.7%
Black or Africa American 394 3.2%
American Indian and Alaska Native 115 0.9%
Asian 47 0.4%
Native Hawaiian and Other Pacific Islander 17 0.1%
Some Other Race 47 0.4%
Two or More Races 164 1.3%
Total 12,358 100.00%
City of New Baltimore Hispanic/Latino Analysis 2020
Number %
Hispanic or Latino 288 2.3%
Source: U.S. Census Bureau
Household Characteristics
The population analysis illustrates that the City
Table 7: Household Size
of New Baltimore has been experiencing a
considerable rise in population over the past
two decades. As the number of individuals Average Household Size Analysis
within the City has increased, so has the 1990 2000 2010 2020
number of households and the size of the
New Baltimore 2.53 2.48 2.72 2.88
households. In 2000 the household count was
2,942, and in 2010 it ballooned to 4,434 Macomb County 2.68 2.52 2.51 2.46
households. From 2010 to 2020 it increased by Michigan 2.63 2.56 2.49 2.55
another 341 households to 4,775. In two Source: U.S. Census Bureau
decades, New Baltimore’s household count
swelled by over 1,800 households. The average household size has continued to climb as well. This
is likely attributed to families having more children as well as families having multi-generational
homes, with senior-aged grandparents moving in with their children.
11Section 1.0
Currently, 70.7% of the City’s Table 8: Household Characteristics
4,775 households were
considered Family Households. Of 2020 Household Characteristics
those households, 58.8% of them
were married couples, and 8.2% Family Married Female-
Households Couple Headed
of them were Female-Headed
Families Households
Households. Total Family
City of New Baltimore 70.7% 58.8% 8.2%
Households and Married Couple
Households are above the Macomb County 64.5% 47.0% 11.4%
Macomb County average, and the Source: U.S. Census Bureau
Female-Headed Households are
below. This is indicative of New Baltimore households representing a more traditional family makeup.
Economic characteristics of households Table 9: Household Characteristics
also impact recreational opportunities.
Household income levels illustrate
2020 Household Income Analysis
varying degrees of wealth and poverty
within a community. By understanding New Baltimore Macomb County
the diverse income levels of a Number % %
community, an individual or
Less than $15,000 217 4.5% 4.4%
organization can better recognize the
ability for residents to support $15,000 – $24,999 208 4.3% 3.4%
recreational activities. For example, a $25,000 – $34,999 213 4.4% 7.9%
household with higher income levels will $35,000 – $49,999 480 9.9% 9.8%
have more opportunities to participate
$50,000 – $74,999 432 8.9% 12.2%
in a wider range of recreational
activities, especially those with $75,000 – $99,999 699 14.4% 19.4%
associated fees. The opposite will $100,000 – $149,999 767 15.8% 14.4%
generally be true for households with $150,000 – $199,999 1,087 22.4% 17.3%
lower incomes. $200,000+ 446 9.2% 6.5%
The average household income in New Total 4,855 100.00% 100.00%
Baltimore decreased from 2010 to 2020 Average Household $88,158.00 $80,511
by $64, from $88,222 to $88,158. In Income
2010, the average household income Source: U.S. Census Bureau
was almost $13,000 over the County’s average. This decrease to less than $8,000 in 2020. A greater
percentage of New Baltimore residents have an average household income over $75,000 than is the
case for Macomb County. The largest household income category for New Baltimore in 2010 was
$100,000 – $149,999, encompassing over 21% of all households in the Community. Comparably
only 16.40% of all the City’s household incomes are $34,999 and below, while 22.80% of the County’s
household incomes fall within those parameters. New Baltimore also boasts 178 (4%) households
with an average household income of $200,000+.
12Community Analysis
Labor Force Participation
In 2010, the City of New Baltimore had a
Table 10: Labor Force
resident civilian labor force of 5,263, which
is 43.55% of the City’s total population.
That total is now 6,194, or 50.1% of the City of New Baltimore Labor Force Characteristics
total population. The increase in the City’s 1990 2000 2010 2020
labor force can be attributed to a number
of factors ranging from the increase in Civilian Labor Force 2,953 4,036 5,263 6,194
population to the increased participation of Employed 2,760 3,878 4,705 5,846
females in the labor force. Regardless, the Unemployed 193 158 558 273
more robust labor force a community
Source: U.S. Census Bureau
possesses the more opportunity there is for
local economic prosperity. As a local economy grows, the community has the ability to invest in many
community and cultural amenities, including parks and recreation services.
Disability Characteristics
Planned improvements to the City’s park and recreation system must consider the needs of any
special population groups, particularly those that may prevent them from having access to recreation
facilities and services available to other City residents. Information on the disability status of the
population was collected as part of the 2020 Census. For the City of New Baltimore, 12.15% of all
residents have a disability. That is roughly 1 in 8 residents who need special accommodations in order
for them to have equitable access to recreational offerings.
Table 11: Disability
2020 Disability Characteristics
Under 18 years 18 to 64 years 6five years and over
# With % of # With % of # With % of
Disabilities Total Pop Disabilities Total Pop Disabilities Total Pop
City of New Baltimore 144 4.6% 791 10.7% 567 32.8%
Macomb County 8,318 4.6% 59,144 11.0% 52,507 35.2%
Source: U.S. Census Bureau
Demographic Considerations
The information evaluated in the preceding demographic and economic analysis has significant impact
on parks and recreation planning for the City of New Baltimore. The single most impactful conclusion
is the reality that the City of New Baltimore is a growing community. With a steady influx of new
residents, the City has an ability to leverage higher population and household counts into strategic
investments in parks and recreation. As new residents begin to integrate themselves into New
Baltimore, parks and recreation services, programs, and amenities can be an initial link to their new
home. This means both a financial and administrative commitment from the City, resulting in
community commitment can lead to civic pride and desirability.
13Section 1.0
The City must acknowledge the rise in the senior population as a major driving factor for recreation
facilities and programming. The City of New Baltimore will likely see a rise in children within the
community over the next decade due to older families progressing and younger families moving into
the City. These young families will put greater weight on the need for parks and recreation services.
From playgrounds, to youth sports, to special events and summer camp, New Baltimore has the
capabilities to engage the City’s youth. On the other hand, it is evident that as a whole, our region,
county, and local communities are seeing increases in the senior population. It is vital that New
Baltimore connect with this demographic and ensure that these individuals remain dynamic members
of the community and society at large. The City’s seniors have invested in New Baltimore. In some
cases, these individuals have lived in the community for decades. One way the City can repay this
loyalty is providing the elderly with parks and recreation services that fit their needs. Improving or
adding walking paths, wellness activities, and senior programs, New Baltimore can engage the City’s
elderly population.
Regardless of the numbers, parks and recreation must be an essential service supported by the City
of New Baltimore, it’s elected officials and appointed officers. Parks and Recreation programs,
services, and amenities are a prime ingredient in the City’s future prosperity. Each community has
homes, businesses, and roads; however not every community has a beach, or a waterfront park, or
top-notch athletic fields. A pledge to parks and recreation provides your community with the ability
to set itself apart. This Plan is the first step in that pledge to parks and recreation. The following
sections will provide the City of New Baltimore with a practical set of goals and objectives that will
pledge the community’s commitment to parks and recreation.
Community Land Use and Natural Features
One of the most essential functions when planning for parks and recreation is analyzing land. The
distribution of land uses, natural features, and development patterns will impact where a community
can and should invest in parks and recreation resources. For example, new residential developments
provide opportunities to link parks with growing population clusters, pristine natural areas allow for
a community to highlight environmental stewardship, and exclusive recreational zoning districts
protect and preserve land for parks and other recreation infrastructure.
By analyzing land uses and natural features the City of New Baltimore can better integrate parks and
recreation into the existing community fabric.
14Community Analysis
Land Use
Currently the City of New Baltimore is comprised of 2,958.8 acres of land. As an evolving suburban
community, the most prevalent land use classification within the City is Residential. Single-Family
Residential is the largest land use classification in New Baltimore accounting for 1,253.9 acres,
42.38% of total land. Multi-Family Residential and Manufactured Home Parks round out residential
land uses in New Baltimore, and account for 45.3 acres of land, 1.53% of total land. All together,
residential uses cover almost 44% of New Baltimore’s total land. The predominance of residential
land uses illustrates that New Baltimore has a commitment to establishing new, and nurture existing,
residential developments that will provide the City with a stable population and tax base. Beyond
residential, the City also has established core areas for private business functions.
Table 12: Land Use New Baltimore has established a number of core
areas for commercial uses. Covering 132.1 acres,
New Baltimore 2020 Land Use Summary 4.46% of total land, Commercial development is
generally located along major thoroughfares and
Acreage % within the City’s traditional downtown area. The
Agriculture 8.5 0.29% City also has a concentration of Industrial uses
located primarily in the areas surrounding
Commercial 132.1 4.46%
Industrial Road on the west side of the City. In
Industrial 69.3 2.34% total New Baltimore has 69.3 acres, 2.34% of
total land, attributed to Industrial Uses ranging
Institutional 206 6.96%
from large scale manufacturing facilities to
Manufactured Home Park 2.2 0.07% specialty tooling companies. The City of New
Baltimore also has set aside land for
Multi-Family Residential 43.1 1.46%
Transportation and Utility providers within the
Open Space 683.3 23.09% Community. Currently the City has 420.5 acres,
14.21% of total land, throughout the community
Recreation 139.9 4.73% set aside for Transportation and Utility services.
Single Family Residential 1,253.9 42.38% Beyond residential, commercial, and industrial
uses, New Baltimore facilitates a mixture of
Transportation & Utilities 420.5 14.21% significant land use classifications that provide the
Total Acreage 2,958.8 100% City with the ability to strengthen its parks and
recreation services and preserve the City’s natural
beauty. The City of New Baltimore utilizes four distinct land use classifications to fortify its community
character: Agriculture, Institutional, Open Space, and Recreation. The New Baltimore land use
analysis highlighted 139.9 acres, 4.73% of total land, set aside exclusively for Recreational Uses.
The Recreational land use classification includes Cedar Glenn Golf Course, Maynard “Red” Aurand
Memorial Park, Festival Park, and Walter and Mary Burke Park. The City’s remaining parks and
recreation parcels are classified under the Institutional land use category. Institutional land uses
include City owned properties, schools, places of worship, cemeteries, and undeveloped parks.
Currently 206.0 acres, 6.96% of total land, are classified as Institutional.
15Section 1.0
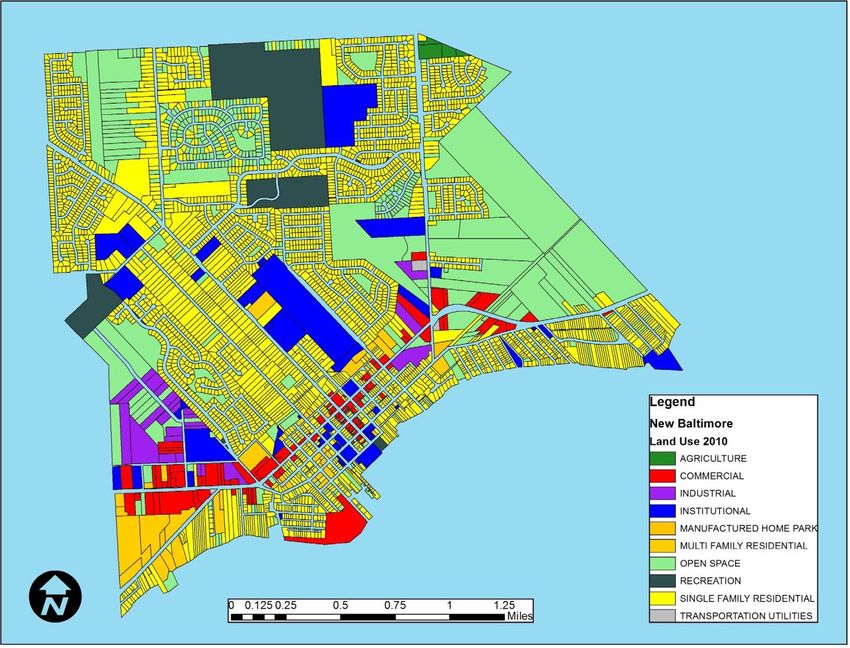
Map 3: Land Use
Ruedisale Pointe Park, Reginald-Brady Park, Anchor Bay Schools Complex, Lillian Lucas Trail System,
both cemeteries in town, City Hall, and other city-owned properties are designated in the Institutional
land use category. The City also has large tracts of Open Space accounting for 683.3 acres, 23.09%
of total land. The greatest concentrations of open space in New Baltimore are located east of County
Line Road and in the upper northwest corner of the community near 25 Mile Road and Ridge Road.
At present, land classified for Agricultural purposes includes 8.5 acres, less than .3% of total land.
The agricultural enclave in New Baltimore is located in the northeastern corner of the community
along County Line Road. Leveraging these four land use categories, New Baltimore has been able to
preserve its natural features and plan for adequate parks and recreation amenities.
16Community Analysis
Natural Features
The City’s most evident and influential natural feature is water. The physical geography of the
community is formed by the shores of Lake St. Clair, and a number of water courses that meander
throughout the community adding natural beauty. The City’s strategic location along the Lake
provides it with an abundance of community, economic, and physical development opportunities.
With over four miles of shoreline, New Baltimore has a distinctive landscape that is home to unrivaled
residential, commercial, and recreational uses. These water elements have defined the City of New
Baltimore. They have evolved from being a hub of commerce and industry to the staging ground of
some of the most remarkable quality of life experiences around. New Baltimore also enjoys a number
of unique conservation areas inland. These areas catalogued by the Michigan Natural Features
Inventory (MNFI) identify “Potential Conservation Areas” that are dominated by native vegetation,
water features, and unique natural features.
The City of New Baltimore possesses four of these MNFI sites, two of which have been integrated
into existing developments and two of which are in predominately open space areas. These MNFI
sites are prime areas of natural beauty and environmental stewardship. Six Rivers Land Conservancy
owns several other tracks of land that are also MNFI sites, and are adjacent to the City-owned
properties. The plan is for the City to eventually purchase these parcels from Six Rivers Land
Conservancy and create one large nature preserve.
Map 4: Natural Features
17Section 2.0
Section 2.0
Administrative Structure
City of New Baltimore
Parks and Recreation Master Plan
18Administrative Structure
Administrative Structure – Introduction
The planning, development, and maintenance of a comprehensive parks and recreation system
cannot be accomplished without a unified administrative structure. A web of elected officials, boards,
commissions, administrators, staffers, and volunteers is needed to ensure that investments are made
soundly and services are delivered efficiently. From developing annual budgets to staff administration,
the administrative structure surrounding parks and recreation is vital to current operations and future
accomplishments.
The following section will detail the City of New Baltimore’s Parks and Recreation Administrative
Structure. Currently the City of New Baltimore Parks and Recreation services are managed and
administered by the following entities: New Baltimore City Council (elected), New Baltimore Parks
and Recreation Commission (appointed), and the City of New Baltimore Recreation Department.
Table 13: New Baltimore Parks and Recreation Organization Chart
City Council
The New Baltimore City Council is the governing body of the City. The six-member council oversees
the general administration of the City including the City’s general operating budget and capital
improvement funds for parks and recreation facilities. By having control over the City’s finances the
City Council is the definitive authority on how parks and recreation services and facilities will be
delivered to the community.
19Section 2.0
Commission of Parks and Recreation
The City of New Baltimore Parks and Recreation Commission was created on March 12th 1990 by City
Ordinance No. 34. The Ordinance established a seven-member commission appointed by the Mayor
with the consent of the City Council. The Ordinance directs the Commission to perform the following
duties and responsibilities:
1. Review, consider, discuss and make recommendations to the City Council relative to present
and future needs and requirements of the city and its residents for parks and recreation
facilities.
2. Review, consider, discuss and make recommendations to the city council and to the mayor
relative to rules and regulations for public parks and recreation facilities and activities within the city.
3. Review, consider and discuss with the director of parks and recreation and make
recommendations to the director of parks and recreation regarding the programs and activities
of the city with respect to parks and recreation and the policies, rules and procedures governing
such programs and activities.
4. Review, consider, discuss and make recommendations on such issues, matters, topics,
questions, and city projects and programs related to parks and recreation as shall be requested
by either the mayor or the city council.
The duties and responsibilities of the commission of parks and recreation shall be supplemental to
and shall not overlap or interfere with the powers and duties of the director of parks and recreation.
City of New Baltimore Recreation Department
The New Baltimore Recreation Department was established by City Council in 1970. Under the
leadership of the Parks and Recreation Director, the Department utilizes an integrated staff of
full-time employees, part-time employees, contractual workers, and volunteers to administer the wide
variety of programs, activities, and services. Beyond programs and activities, the Recreation
Department works closely with the Mayor, City Council, Public Works Department, and Parks and
Recreation Commission to maintain, develop, and acquire parks and recreation land,
spaces, and facilities.
Recreation Programming
The City of New Baltimore Recreation Department offers a diverse range of recreation programs and
activities, which include instructional classes, athletics, senior programs, camps, and special events.
Programs are geared towards a seasonal schedule with activities administered in the Spring/Summer
sessions and the Fall/Winter sessions. These programs change from time-to-time to reflect the needs
and preferences of City residents. Residents from adjoining communities are permitted to participate
in these programs.
20Administrative Structure Recreation Budget On an annual cycle, the City of New Baltimore prepares a budget to execute parks and recreation services, programs, and facilities. This process sets aside annual expenditures for the department, building and grounds, seasonal expenditures, and activities funds. The 2020/2021 Parks and Recreation Budget totaled $824,930 with the largest line item being Department expenditures, including salaries and fringe benefits, accounting for $361,260. Currently the 2021/2022 Parks and Recreation Budget is set at $1,153,290 with the largest line item being Department expenditures again totaling $432,595. Maintenance for the City parks is the responsibility of a combination of the Parks & Recreation Department and the City’s Department of Public Service (DPS). The cost of maintaining the City’s parks and pavilions is $235,790. Maintenance of the City’s athletic fields is separate from the parks, and is budgeted for $72,560 in the 2021/2022 fiscal year. The primary source of revenue for the Recreation Department is user fees which are charged for programs and leagues. Sponsorships and donations are a secondary source of revenue for the department. Revenues for the department are budgeted at $205,075 for the 2021/2022 fiscal year. The total of the remaining expenditures that are not offset by the revenues generated are subsidized by the City’s general fund. 21
Section 3.0

Section 3.0
Parks & Recreation Inventory

City of New Baltimore
Parks and Recreation Master Plan

                                            22
Parks
Section&6.0
Recreation Inventory
Parks & Recreation Inventory – Introduction
When a community seeks to develop a comprehensive parks and recreation master plan it is
imperative to catalogue existing parks and recreation facilities. An extensive inventory of parks and
recreation facilities will allow a community to highlight its assets, develop linkages, build off of
innovative trends, and point out any gaps in services. Beginning with a community’s existing
recreational framework all stakeholders involved can begin to develop modern strategies that will
propel parks and recreation to new levels. The following section will provide a complete inventory of
parks and recreation facilities within the City of New Baltimore, and highlight major facilities in
surrounding areas. The section will begin with an overview of the regional parks and recreation
environment, highlighting state and regional parks and recreation destinations surrounding the City
of New Baltimore. The inventory will then focus on the parks and recreation facilities owned and
operated by the City of New Baltimore. An analysis of facilities owned by other agencies within the
City of New Baltimore will also be included in this section.
State and Regional Inventory
While Parks & Recreation is its own department, it is essential to view it as part of a larger system of
spaces, facilities, and services. A singular approach to parks and recreation planning will result in
insufficient knowledge and wasted resources. The City of New Baltimore is nestled in a region that
has considerable parks and recreation destinations. As a region, Southeast Michigan has a
long-standing commitment to parks and recreation. From major park systems to wildlife preservation
areas, the State of Michigan and the Huron-Clinton Metroparks Authority have established a network
of services and facilities that provide users of all abilities and interests with plentiful parks and
recreation destinations.
Sixteen (16) State parks and recreation areas are located in the five-county region surrounding New
Baltimore. In total these state recreation facilities encompass over 50,000 acres of land. These state
facilities offer a wide range of parks and recreation services including trails, swimming, fishing,
boating, picnicking, camping, nature preserves, cross-country skiing, and many others. The only State
Park located in Macomb County is the undeveloped Wetzel State Recreation Area. This 900+ acre
park provides areas for hiking, hunting, snowmobiling and cross-country skiing.
The Huron-Clinton Metropolitan Authority (HCMA) is a regional park system created by the Citizens
of Southeast Michigan in the 1940’s. This regional parks authority provides recreational and
educational opportunities while serving as stewards of the natural environment. HCMA believes that
the use of parks and exposure to natural environments enhance society’s health and quality of life.
23Section 3.0
Macomb County is home to three HCMA Map 5: State and Regional Parks & Recreation Facilities
parks: Stony Creek Metropark located in
Washington Township; Wolcott Mill
Metropark located in Ray Township; and
Lake St. Clair Metro Park located in
Harrison Township. Each of these
facilities offers a wide array of parks and
recreation opportunities at a grand
scale. From the public beach at Lake St.
Clair Metropark, to the Farm Center at
Wolcott Mill, to the golf course at Stony
Creek each park attracts large amounts
of visitors from around the region. Each
of the noted facilities has a profound
impact on recreation in New Baltimore.
Residents of the City are users of these
facilities and it is important for New
Baltimore to understand how it can
leverage and learn from the success of
these parks and recreation destinations.
Macomb County Inventory
Macomb County operates a system of
parks and recreation opportunities
through a network of elected officials,
administrators, and commissions. The
County works in chorus through the
Macomb County Board of
Commissioners, the Macomb County
Parks and Recreation Commission, the Macomb Orchard Trail Commission, and a network of County
Departments in developing strategies and programs for parks and recreation. Currently, Macomb
County oversees only one active parks and recreation amenity, the Macomb Orchard Trail. This 27
mile non-motorized trail is the anchor of Macomb County’s regional trail network, and is managed by
the Macomb Orchard Trail Commission. The County is also an active partner in the operations
surrounding the Freedom Trail, which is a non-motorized trail traversing Sterling Heights, Clinton
Township, Harrison Township, and ending at Lake St. Clair Metropark. Macomb County also owns
Freedom Hill County Park, a 100+ acre park facility located in Sterling Heights. Even though Macomb
County is not currently involved in the active operation of large-scale parks and recreation facilities,
the County remains an active participant in the planning and development of regional and local parks
and recreation programs.
24Parks
Section&6.0
Recreation Inventory
At the local level Macomb County Map 6: Macomb County Parks & Recreation Facilities
has had a longstanding
commitment to providing local
units of government with
assistance in developing local parks
and recreation plans and grant
administration/assistance.
Macomb County has leveraged
partnerships and administrative
resources to fortify local parks and
recreation programs. At the
regional level, Macomb County has
taken a more active approach to
promoting the potential
surrounding Lake St. Clair.
Focusing on public access,
recreational opportunities, and
environmental stewardship,
Macomb County is a leading force
behind the revitalization of Lake St.
Clair. As Macomb County continues
to evolve under its newly
established Executive form of
government, elected officials, staff,
and volunteers will ensure that
parks and recreation facilities and
services will continue to be an
important public priority.
25Section 3.0
City of New Baltimore Inventory
The City of New Baltimore has a desirable foundation of parks and recreation facilities that service
the community. In total there are 11 parks and recreation facilities in the City of New Baltimore. Of
these 13 facilities, there are 8 owned and operated by the City of New Baltimore, 1 leased by the
City, 1 facility managed under the authority of Anchor Bay Public Schools, and 3 operated by private
entities. Collectively, these facilities account for 320 acres of land scattered throughout the community
incorporating unique landscapes and settings. From large tracts of open space to the core of the
City’s downtown, these parks and recreation facilities are ingrained in the community fabric.
Map 7: New Baltimore Parks & Recreation Facilities
To adequately inventory these facilities for the community, and meet the requirements set forth by
the State of Michigan Department of Natural Resources “Guidelines for the Development of
Community Parks, Recreation, Open Space, and Greenway Plans”, the following section will
extensively review each facility. For each facility the following information will be catalogued: name,
size, description, accessibility assessments, map, and photographs. As the City of New Baltimore
embarks on this comprehensive parks and recreation planning process, this inventory of existing
facilities will be the groundwork for future parks and recreation aspirations.
26Parks
Section&6.0
Recreation Inventory
New Baltimore Public Parks and Recreation Facilities
Name: County Line Park
Size: 10.1 acres
Description: County Line Park is currently an undeveloped 10-acre site. The park is located on the
east side of County Line Road, south of Crapeau Creek. As a large track of undeveloped greenspace
the City of New Baltimore is considering a number of parks and recreation improvements to this site.
Accessibility Assessments: Undeveloped land.
Map 8: County Line Park
27Section 3.0
Name: County Line Pathway
Size: 2.2 Miles
Description: The County Line Pathway was a collaboration between the City of New Baltimore, the
Anchor Bay School District, Ira Township, St. Clair County, and Macomb County. The initial 1.25 Mile
trail was constructed in 2011 and connected Anchor Bay High School to residential neighborhoods as
far south as St. Clair Drive in New Baltimore. The additional 0.95 miles of pathway was added with a
grant from the DNR Trust Fund in 2015 and extended the trail further south past M-29.
Accessibility Assessments: (4) County Line Pathway meets accessibility guidelines.
Map 9: County Line Pathway
County Line Pathway Sign
28Parks
Section&6.0
Recreation Inventory
Name: Lillian Lucas Trail System
Size: 34.6 acres
Description: The Lillian Lucas Trail System was added to the New Baltimore Parks system in 2016
as a result of the property being acquired by the City in a settlement. The City has taken steps to
return the site to its natural habitat. The Lillian Lucas Trail System is located next to Cedar Glen Golf
Club and is north of St. Clair Drive next to Maple Creek Subdivision. There is currently a soft pathway
system meandering through the park conducive to bird watching, running, and cross-country skiing
in the winter. In 2019, a gravel parking lot was added at the trail head located at the end of Crimson
Lane. Future development will include restrooms, trail enhancements, and seating on the trails.
Accessibility Assessments: (3) The park is in the development stage.
Map 10: Lillian Lucas Trail System
29Section 3.0
Name: Festival Park
Size: 31.1 acres
Festival Park Entrance
Description: In 2016, a local non-
profit, Bay-Rama, donated the 31 acre
site to the City to be used as a sports
and family park. The site is located off
of St. Clair Drive in the center of the City.
The site has been transformed into 2
full-size soccer fields, 4 baseball
diamonds and a 100 car parking lot. A
one-mile walking path has been
developed around the perimeter of the
park with several access points. A picnic
area has also been developed. In 2018,
Bay-Rama donated a playscape that was
added to the park amenities. Future
developments will include field lighting,
permanent bathrooms, a concession
stand, and paved parking. The City also plans to plant additional trees and shrubs at the park to
improve aesthetics and greenspace.
Accessibility Assessments: (4) Festival Park meets accessibility guidelines.
Festival Park Greenspace Festival Park Storage
30Parks
Section&6.0
Recreation Inventory
Map 11: Festival Park
Festival Park Soccer Fields
31Section 3.0
Name: Maynard “Red” Aurand Memorial Park
Size: 48.3 acres (including protected
Maynard “Red” Aurand Memorial Park
greenspace and Oakwood Cemetery)
Description: Maynard “Red” Aurand
Memorial Park is the largest active parks and
recreation facility in the City of New
Baltimore. This community park is located at
the corner of Huntley Street and 24 Mile
Road, and is a major parks and recreation
destination. Maynard “Red” Aurand Memorial
Park houses many parks and recreation
services including: two baseball diamonds,
basketball/pickle ball court, soccer fields, a
covered pavilion, a skate park, a sledding hill,
a children’s playscape, and permanent bathroom facilities. The site also contains an exercise pathway
that is utilized year-round. The park is also connected to a protected greenspace, just south of the
major park site, and Oakwood Cemetery, just east of the major park site. Maynard “Red” Aurand
Memorial Park is a preeminent parks and recreation facility within the City of New Baltimore. With
thousands of visitors each year, this facility is a prime example of the positive impact that parks and
recreation can have on a community. Future site developments include the leveling of green space
to allow for additional soccer fields, athletic field lighting, and a universally accessible playscape.
Accessibility Assessments: (4) Maynard “Red” Aurand Memorial Park meets accessibility
guidelines.
Maynard “Red” Aurand Playground Maynard “Red” Aurand Pavilion
32Parks
Section&6.0
Recreation Inventory
Map 12: Maynard “Red” Aurand Memorial Park
Maynard “Red” Aurand Sledding Hill Maynard “Red” Aurand Ball Fields
33Section 3.0
Name: Reginald Brady Park
Size: 1.8 acres
Reginald Brady Park Vista
Park Description:
Reginald Brady Park is a
neighborhood park located in
between Reginald Street and Brady
Street on the shores of Lake St.
Clair. This 1.8 acre boulevard park
is nestled in a residential
neighborhood and provides
residents with a passive
recreational area. Reginald Brady
Park offers areas for picnics, scenic
views of Lake St. Clair, and a small
garden area. This park is an
identified access location for the
Anchor Bay Water Trail and the
City may pursue opportunities to
better connect this site to the
water trail system. Tucked away,
this secluded recreational enclave surround by mature trees is a community treasure that allows
residents to interact with the beauty of Lake St. Clair in a calm and inviting area. Future developments
may include additional seating, a small playscape, and shoreline restoration.
Accessibility Assessments: (4) Reginald Brady Park meets accessibility guidelines.
Reginald Brady Park Greenspace
34You can also read


