Patients with triple-negative, JAK2V617F- and CALR-mutated essential thrombocythemia share a unique gene expression signature

Page created by Annette Walsh
 
CONTINUE READING
Patients with triple-negative, JAK2V617F- and CALR-mutated essential thrombocythemia share a unique gene expression signature
Patients with triple-negative, JAK2V617F- and CALR-mutated
essential thrombocythemia share a unique gene expression signature
Alimam, S., Villiers, W., Dillon, R., Simpson, M., Runglall, M., Smith, A., Chatzikyriakou, P., Lavender, P., Kanda,
A., Mills, K., Bellosillo Paricio, B., Kaufman-Cook, J., Ord, S., Kordasti, S., Radia, D., Woodley, C., Francis, Y.,
Mufti, G., McLornan, D. P., & Harrison, C. N. (2021). Patients with triple-negative, JAK2V617F- and CALR-
mutated essential thrombocythemia share a unique gene expression signature. Blood Advances, 5(4), 1059-
1068. https://doi.org/10.1182/bloodadvances.2020003172
Published in:
Blood Advances

Document Version:
Publisher's PDF, also known as Version of record

Queen's University Belfast - Research Portal:
Link to publication record in Queen's University Belfast Research Portal

Publisher rights
© 2021 by The American Society of Hematology
This work is made available online in accordance with the publisher’s policies. Please refer to any applicable terms of use of the publisher.

General rights
Copyright for the publications made accessible via the Queen's University Belfast Research Portal is retained by the author(s) and / or other
copyright owners and it is a condition of accessing these publications that users recognise and abide by the legal requirements associated
with these rights.

Take down policy
The Research Portal is Queen's institutional repository that provides access to Queen's research output. Every effort has been made to
ensure that content in the Research Portal does not infringe any person's rights, or applicable UK laws. If you discover content in the
Research Portal that you believe breaches copyright or violates any law, please contact openaccess@qub.ac.uk.

Download date:20. Dec. 2021
REGULAR ARTICLE

Patients with triple-negative, JAK2V617F- and CALR-mutated essential
thrombocythemia share a unique gene expression signature

                                                                                                                                                                                           Downloaded from http://ashpublications.org/bloodadvances/article-pdf/5/4/1059/1800642/advancesadv2020003172.pdf by QUEEN'S UNIVERSITY MEDICAL LIBRARY user on 23 February 2021
Samah Alimam,1,2,* William Villiers,2,* Richard Dillon,1,2 Michael Simpson,2 Manohursingh Runglall,3 Alexander Smith,4
Prodromos Chatzikyriakou,5 Paul Lavender,6 Anju Kanda,2 Ken Mills,7 Beatriz Bellosillo Paricio,8 James Kaufman-Cook,2 Sophie Ord,2
Shahram Kordasti,1,9 Deepti Radia,1 Claire Woodley,1 Yvonne Francis,1 Ghulam Mufti,4 Donal P. McLornan,1,† and Claire N. Harrison1,†
1
  Department of Haematology, Guy’s and St. Thomas’ NHS Foundation Trust, London, United Kingdom; 2Department of Medical and Molecular Genetics, King’s College London, London,
United Kingdom; 3NIHR Comprehensive Biomedical Research Centre at Guy’s and St. Thomas’ NHS Foundation Trust in partnership with King’s College London and King’s College
Hospital, London, United Kingdom; 4Department of Haematology, King’s College NHS Trust, London, United Kingdom; 5Genetics and Molecular Medicine Research Division, King’s
College London, London, United Kingdom; 6School of Immunology & Microbial Sciences, MRC and Asthma UK Centre in Allergic Mechanisms of Asthma, King’s College London, London,
United Kingdom; 7Centre for Cancer Research and Cell Biology, Queen’s University, Belfast, United Kingdom; 8Laboratori de Diagnòstic Molecular, Servei de Patologia, Hospital del Mar,
Barcelona, Spain; and 9Systems Cancer Immunology, Comprehensive Cancer Centre, School of Cancer and Pharmaceutical Sciences, King’s College London, London, United Kingdom

                                                Approximately 10% to 15% of patients with essential thrombocythemia (ET) lack the common
            Key Points
                                                driver mutations, so-called “triple-negative” (TN) disease. We undertook a systematic
  • According to next-                          approach to investigate for somatic mutations and delineate gene expression signatures in
    generation deep se-                         46 TN patients and compared the results to those with known driver mutations and healthy
    quencing, TN patients
                                                volunteers. Deep, error-corrected, next-generation sequencing of peripheral blood
    with ET may have “low-
                                                mononuclear cells using the HaloPlexHS platform and whole-exome sequencing was
    level” driver mutations
                                                performed. Using this platform, 10 (22%) of 46 patients had detectable mutations (MPL, n 5
    affecting JAK2 or MPL.
                                                6; JAK2V617F, n 5 4) with 3 of 10 cases harboring germline MPL mutations. RNA-sequencing
  • Gene expression analy-                      and DNA methylation analysis were also performed by using peripheral blood mononuclear
    sis suggests that in ET,
                                                cells. Pathway analysis comparing healthy volunteers and ET patients (regardless of
    including “true” TN,
                                                mutational status) identified significant enrichment for genes in the tumor necrosis factor,
    transcriptional misregu-
                                                NFkB, and MAPK pathways and upregulation of platelet proliferative drivers such as ITGA2B
    lation occurs with
                                                and ITGB3. Correlation with DNA methylation showed a consistent pattern of
    resultant JAK-STAT
    pathway activation.                         hypomethylation at upregulated gene promoters. Interrogation of these promoter regions
                                                highlighted enrichment of transcriptional regulators, which were significantly upregulated
                                                in patients with ET regardless of mutation status, including CEBPb and NFkB. For “true” TN
                                                ET, patterns of gene expression and DNA methylation were similar to those in ET patients
                                                with known driver mutations. These observations suggest that the resultant ET phenotype
                                                may, at least in part and regardless of mutation type, be driven by transcriptional
                                                misregulation and may propagate downstream via the MAPK, tumor necrosis factor, and
                                                NFkB pathways with resultant JAK-STAT activation. These findings identify potential novel
                                                mechanisms of disease initiation that require further evaluation.

                                                Introduction

                                                Classical Philadelphia-negative myeloproliferative neoplasms (MPNs) are multipotent, clonal hemato-
                                                poietic stem cell neoplasms encompassing essential thrombocythemia (ET), polycythemia vera (PV), and
                                                primary myelofibrosis. These disorders have an overlapping yet heterogeneous clinical spectrum, with

Submitted 11 August 2020; accepted 10 December 2020; published online 18                        The data reported in this article have been deposited in the Gene Expression Omnibus
February 2021. DOI 10.1182/bloodadvances.2020003172.                                            database (accession number GSE156547).
*S.A. and W.V. are joint first authors.                                                         The full-text version of this article contains a data supplement.
†D.P.M. and C.N.H. are joint senior authors.                                                    © 2021 by The American Society of Hematology

23 FEBRUARY 2021 x VOLUME 5, NUMBER 4                                                                                                                                               1059
both ET and PV having the potential to transform to myelofibrosis.1,2   protocols. Details of the bioinformatics analysis pipeline are
Furthermore, MPNs predispose to an increased risk of thrombo-           provided in the supplemental Methods. Briefly, genomic DNA
embolic events and have an inherent risk of transformation to acute     libraries prepared by using SureSelectXT Human All Exon V4 were
myeloid leukemia (AML; 1% to 2% for ET/PV and up to 10% to              sequenced on the Illumina HiSeq 2000 platform (Illumina) with
20% in primary myelofibrosis at 10 years).2,3                           100 bp paired-end reads. Reads were aligned to the reference
                                                                        human genome (hg19, b37) using NovoAlign (Novocraft Technol-
ET is specifically characterized by increased numbers of abnormal,
                                                                        ogies). Alignments underwent quality control and filtering. In each

                                                                                                                                               Downloaded from http://ashpublications.org/bloodadvances/article-pdf/5/4/1059/1800642/advancesadv2020003172.pdf by QUEEN'S UNIVERSITY MEDICAL LIBRARY user on 23 February 2021
clonal megakaryocytes and a clinical phenotype of thrombocy-
                                                                        sample, .87% of the GENCODE-defined coding bases of the
tosis. Although rare cases of hereditary ET have been observed,
                                                                        exome was represented by at least 20 reads. Pairwise variant calling
the majority of ET cases occur sporadically, most commonly
                                                                        was performed by using SAM tools and filtered by using VarScan2.
associated with somatic mutations in either JAK2 exon 14, CALR
exon 9, or MPL exon 10, all of which lead to upregulated JAK-
STAT signaling.4 Mutations in JAK2, CALR, and MPL are usually           Targeted next-generation sequencing
mutually exclusive, with an incidence of 55%, 25%, and 3%,              Targeted deep sequencing of genes known to be mutated in
respectively.5 However, 10% to 15% of patients with ET do not           myeloid malignancies was performed by using the HaloPlexHS
harbor detectable “driver” mutations, at least according to con-        platform (Agilent Technologies) on peripheral blood PBMCs. The
ventional diagnostic assays, and are termed “triple negative” (TN).     mean sequencing coverage was 95%, and 90% of target
Previous research using whole-exome sequencing (WES) has                sequences could be analyzed with a coverage .90%. A list of
reported novel MPL and JAK2 mutations in TN MPN, highlighting           the genes covered and details of the analysis pipeline are provided
disease heterogeneity.4                                                 in supplemental Table 1.
Limited data exist concerning both extended gene expression
analyses and detailed methylation profiles of ET progenitor cells,      Gene expression profiles
particularly regarding the TN ET population. Using genome-wide          RNA-sequencing was performed on a selected subset of individuals
methylation arrays, Pérez et al6 evaluated the epigenetic landscape    based on sample availability, which included 12 “true” TN patients,
of 71 patients with chronic MPN and 13 with transformed MPN             3 known JAK2V617F and 3 CALR mutated patients, and 4 HVs.
compared with healthy volunteers (HVs). Although a distinct MPN-        RNA was extracted from PBMCs by using TRIzol reagent (Life
associated methylation signature was evident compared with HVs,         Technologies). Libraries were prepared by using the Illumina
no differential pattern existed between the chronic disease             TruSeq Stranded RNA kit following the manufacturer’s instructions
categories (primary myelofibrosis vs PV/ET). The differentially         and sequenced by using an Illumina HiSeq 2500 instrument.
methylated regions appear enriched in a gene network centered           Differentially expressed genes were identified by using limma.9 Full
on inflammation and the NFkB pathway. In a cohort of patients with      details of the bioinformatics analysis are provided in the supple-
MPN, Rice et al7 described aberrations affecting components of          mental Methods.
a noncanonical polycomb repressive complex 2 (EZH1, SUZ12,
and JARID2) and, interestingly, upregulation of the transcription       Epigenetic signatures
factor (TF) NFIB, resulting in cellular protection from apoptosis.
                                                                        Methylation profiles were performed in a selected cohort of enrolled
More recently, Wong et al8 reported significant pro-inflammatory
                                                                        individuals based on sample availability: 21 TN patients (12 of 21
gene upregulation in an MPN cohort.
                                                                        had gene expression performed as described earlier) and
We hypothesized that patients with ET have a unique gene                4 JAK2V617F mutated, 2 MPL mutated, and 3 CALR mutated
expression and methylation signature that may serve as a diagnostic     (one JAK2V617F and 2 MPL patients were identified in retrospect
tool in those who lack classical driver mutations. We therefore         from the WES data) patients. Genomic DNA extracted from
evaluated 46 TN ET patients, aiming to delineate if there are           PBMCs was bisulfite converted by using the EZ DNA Methylation kit
differential epigenetic and gene expression profiles compared with      (Zymo Research), as per the manufacturer’s protocol and
ET patients with known driver mutations.                                processed on an Infinium Human-Methylation 850K BeadChip
                                                                        platform. Further details are provided in the supplemental Methods.
Methods
Patient samples                                                         Reverse-transcriptase quantitative polymerase
A total of 56 patients with ET, 2 patients with post-ET myelofibrosis   chain reaction
as defined by the 2008 World Health Organization criteria, and 4        To investigate the abundance of the gene-specific transcript of 20
healthy HVs were enrolled into the study. Baseline mutation status      candidate genes identified with altered expression, we prepared
to exclude the presence of JAK2V617F, CALR, or MPL mutations            complementary DNA from total RNA in an additional 20 peripheral
was determined per local clinical laboratory protocols. Written         blood samples of ET patients (9 JAK2V617F positive, 7 CALR
informed consent was obtained in accordance with the Declaration        positive, and 4 TN) and 6 HVs10 (supplemental Table 2). Gene
of Helsinki and with approval from the local ethical review             expression was assessed with reverse-transcriptase quantitative
committee.                                                              polymerase chain reaction (RT-qPCR) using gene-specific probes
                                                                        for the following 20 candidate genes: CEBPb, ELK1, FAXDC2,
Whole-exome sequencing                                                  FOSL2, GP1BB, GTPBP1, ITGA2B, ITGA7, ITGB3, JUN, JUND,
Using peripheral blood mononuclear cells (PBMCs), WES libraries         KLF1, MAPKAPK2, MARCKS, NFkB2, PFKFB3, RELA, SPI1,
were prepared using the SureSelectXT Human All Exon V4 (Agilent         TAL1, and TGFB1 (supplemental Table 3). Assays were run in
Technologies) target enrichment system as per manufacturer’s            triplicate on the ABI7900 platform (Applied Biosystems).

1060   ALIMAM et al                                                      23 FEBRUARY 2021 x VOLUME 5, NUMBER 4
Table 1. Clinical and hematologic parameters of patients enrolled in                      that were not detected by conventional testing. However, most
the study                                                                                 patients displaying a clinical ET phenotype still had no detectable
 Parameter                                           TN          JAK2          CALR       driver mutations via next-generation sequencing, and hence we
 No. of patients
                                                                                          proceeded to investigate the gene expression profiles of these so-
                                                                                          called “true” TN patients.
   ET                                                 46           6             6
   Post–ET MF                                         2            0             0        RNA-sequencing was performed on 12 true TN patients (ie, no

                                                                                                                                                                   Downloaded from http://ashpublications.org/bloodadvances/article-pdf/5/4/1059/1800642/advancesadv2020003172.pdf by QUEEN'S UNIVERSITY MEDICAL LIBRARY user on 23 February 2021
 Sex
                                                                                          driver mutations identified by next-generation sequencing), three
                                                                                          JAK2V617F-mutated patients, three CALR-mutated patients, and
   Female                                             35           4             3
                                                                                          four HVs. First, the data were interrogated to identify if any gene
   Male                                               11           2             3
                                                                                          expression differences existed between the TN cohort and patients
 Platelet count at study entry (range), 310 /L
                                           9
                                                     443          374          772        with known CALR and JAK2V617F mutations. Notably, gene
                                                  (236-1053)   (308-457)    (262-1709)
                                                                                          expression profiles correlated strongly with each other across all ET
 Hemoglobin at study entry (range), g/L              131         133.5         132.5      patients regardless of mutational status (supplemental Figure 1A).
                                                   (99-161)    (129-159)     (118-162)
                                                                                          Moreover, direct comparisons between the 12 TN patients and 6
 White blood cell count at study entry (range),    6.7 (2.7-    5.7 (3.5-     5.3 (3.6-
  3109/L                                             14.5)        8.2)          10.2)
                                                                                          patients with known mutations yielded limited significant differences
                                                                                          (supplemental Figure 1B). In contrast, compared with that of HVs,
 Drug treatment at study entry
                                                                                          the gene expression profiles of each ET subset showed consistent
   No treatment                                       23           1             1        significant differences, regardless of disease subtype, platelet
   HU                                                 11           0             0        counts, treatment, and age (Figure 1A). Because there seemed to
   IFN                                                8            5             4        be a set of unique genes in the TN comparison, we further analyzed
   ANA                                                3            0             0
                                                                                          these genes; however, no significant differences in expression were
                                                                                          determined comparing TN samples vs the rest of the ET cohort.
   HU and ANA                                         0            0             1
                                                                                          Moreover, these genes followed a similar expression pattern in the
   HU, IFN, and ANA                                   1            0             0
                                                                                          JAK2V617F and CALR samples compared with the HV samples
  ANA, anagrelide; CALR, calreticulin; HU, hydroxycarbamide; IFN, interferon; JAK2,       (supplemental Figure 1C-D).
JAK2V617F; MF, myelofibrosis.
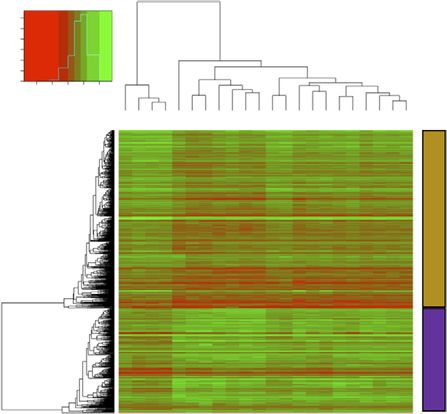
                                                                                          From our adjusted analysis comparing all ET patients vs HVs, a total
                                                                                          of 838 differentially expressed genes (DEGs; adjusted P ,.05)
                                                                                          (Figure 1B) were identified. Clearly, these genes define a gene set
Assays were performed as previously described11; ABL1 cycle
                                                                                          that could distinguish ET from HV in this cohort (Figure 1C). We
threshold values #30 were used for quality assessment. We
                                                                                          also recognized that the disease-modifying nature of interferon
quantified differences in the expression level (fold change) of the 20
                                                                                          treatment may affect gene expression patterns; however, sample
candidate genes between the ET cohort and HVs by using
                                                                                          clustering highlighted no anomalies (supplemental Figure 1A,H).
a comparative cycle threshold values platform (Applied Biosys-
                                                                                          We performed an additional differential analysis comparing patients
tems), and gene expression in the ET samples was compared with
                                                                                          with and without interferon and could not show any significant
HVs, with ABL1 as a reference gene. No-template and no-reverse-
                                                                                          differences in gene expression profiles (supplemental Figure 1I-J).
transcriptase controls were used to ensure specific amplification of
target transcripts.                                                                       Ingenuity pathway analysis (IPA) of the 838 DEGs highlighted
                                                                                          upregulated genes were enriched for genes critical for myeloid cell
Results                                                                                   differentiation and proliferation, specifically activation of megakar-
The clinical and hematologic parameters and treatment regimens                            yopoiesis and oncogenic signatures (Figure 1D; supplemental
for the TN patients enrolled in this study are shown in Table 1.                          Figure 2A). The converse was also true (ie, enrichment for
                                                                                          thrombocytopenia among downregulated genes). Notable upregu-
Identification of somatic and germline mutations                                          lated DEGs included ITGB3, ITGA2B, ITGA7, GP1BB, FAXDC2,
Targeted, error-corrected sequencing and WES identified somatic                           SPI1 (PU.1), TAL1, TGFB1, and CSF2RB; their mean expression
or germline mutations in 10 patients (Table 2). Six patients were                         levels are displayed in Figure 1E.
identified as having mutations in MPL: 4 patients with mutations in
                                                                                          To understand the potential molecular pathways that may be driving
exon 10 (W515R, W5151G/S, and S505N), 1 patient with
                                                                                          the expression of these proliferative genes critical for megakar-
a mutation in exon 11 (R537W), and 1 patient with a mutation in
                                                                                          yopoiesis, functional enrichment was performed using the KEGG
exon 9 (MPL P453R). Four patients had the JAK2V617F mutation.
                                                                                          database. This analysis revealed that upregulated DEGs were
Among the 6 patients identified as having an MPL mutation, this
                                                                                          enriched for several proliferative and inflammatory pathways,
was a germline mutation in 3 patients, including an MPL P435R
                                                                                          including JAK-STAT, tumor necrosis factor (TNF), NFkB, and
mutation in a female patient with post-ET myelofibrosis, and an MPL
                                                                                          MAPK pathways (P , .001) (supplemental Figure 2B-C). Re-
S505N mutation shared by a father and son pair. In the latter cases,
                                                                                          garding proliferative pathways, key downstream targets of these
the MPL S505N mutation was confirmed to be a germline mutation
                                                                                          pathways, including the TFs JUN, JUND, and CCAAT enhancer
as it was detected by WES in both PBMCs and skin.
                                                                                          binding protein b (CEBPb), were also upregulated.
Gene expression profiling                                                                 These data suggest that regardless of disease subtype, ET
In total, 22% of clinically diagnosed TN ET patients in our cohort                        converges onto similar gene expression profiles, which potentially
harbored driver mutations detected by next-generation sequencing                          drive the disease phenotype. To test this theory in an independent

                                   23 FEBRUARY 2021 x VOLUME 5, NUMBER 4                            GENOMIC CHARACTERIZATION OF “TRIPLE-NEGATIVE” ET       1061
Table 2. Mutation profile of TN patients identified as having somatic or germline mutations
 Sex                       Age at diagnosis, y                            Gene                  VAF, %               Treatment              Platelet count, 3109/L

 Male                                45                               MPL W515R                    5                    HC                           457

 Male                                14                               MPL R537W                    2                    Nil                          521
 Female                              19                               MPL P453R*                  52                    IFN                          471

 Male                                26                               MPL S505N*                  52                    Nil                         1024

                                                                                                                                                                     Downloaded from http://ashpublications.org/bloodadvances/article-pdf/5/4/1059/1800642/advancesadv2020003172.pdf by QUEEN'S UNIVERSITY MEDICAL LIBRARY user on 23 February 2021
 Male                                55                               MPL S505N*                  52                    HC                           466

 Female                              38                               MPL                                               Nil                         1053
                                                                      W5151G                      10

                                                                      and W515S                   10
 Female                              45                               JAK2V617F                    2                    HC                           325
 Female                              52                               JAK2V617F                    4                    Nil                          437

 Female                              36                               JAK2V617F                    8                    HC                           310
 Female                              69                               JAK2V617F                    2                    HC                           416

 HC, hydroxycarbamide; IFN, interferon; Nil, no treatment; VAF, variant allele frequency.
 *Germline mutations.

cohort, we processed previously published gene expression array                             For each patient sample, we aggregated promoter- or gene
data (described in the supplemental Methods) from a mixed ET                                body–associated CpGs for each gene and explored regions that
cohort (n 5 20) with HVs (n 5 20).12 Directly comparing the ET                              had consistently hypomethylated/hypermethylated CpGs across all
samples vs the HV samples, we identified that 32 of the upregulated                         ET patient samples for that gene. We found that 9611 genes had
genes delineated in our analysis were also significantly upregulated                        hypomethylated promoters and 71 genes had hypermethylated
in this cohort. Among the overlapping genes were key inflammatory                           promoters; 33 genes had hypomethylated gene bodies and 159
genes: FAXDC2, ITGA2B, ITGA7, FOSL2, and ITGA2B (supple-                                    genes had hypermethylated gene bodies (Figure 2A). As expected,
mental Figure 2D).13                                                                        correlation with gene expression profiling showed that genes with
                                                                                            hypermethylated promoters had significantly lower expression than
To gain further validation of the gene expression profile differences                       genes with either hypomethylated promotors or hypomethylated/
observed between the ET patients and HVs, RT-qPCR was                                       hypermethylated gene bodies (Figure 2B; supplemental Figure 3D).
performed on an additional 20 independent patients with ET                                  Interestingly, however, genes identified as having a consistent
(9 JAK2V617F positive, 7 CALR positive, and 4 TN) and six HVs                               hypomethylated/hypermethylated pattern at either their promoter of
(supplemental Table 1) on 20 candidate genes identified to have                             gene body had a significantly higher expression than genes without
altered expression. The cycle threshold values for the 20 candidate                         a clear hypomethylation/hypermethylation pattern. This was con-
genes (CEBPb, ELK1, FAXDC2, FOSL2, GP1BB, GTPBP1,                                           sistent for all patient samples in the RNA-sequencing cohort.
ITGA2B, ITGA7, ITGB3, JUN, JUND, KLF1, MAPKAPK2,                                            Although the exact significance of gene body methylation remains
MARCKS, NFkB2, PFKFB3, RELA, SPI1, TAL1, and TGFB1)                                         unclear, gene body hypermethylation has been reported to be
are listed in supplemental Table 3. As shown in Figure 1F, all of the                       associated with increased gene expression.15,16
candidate genes had significantly higher expression in the patients
with ET compared with the HVs, irrespective of mutation subtype.                            We next questioned if there were any methylation changes
                                                                                            compared with HV PBMCs (n 5 2). We identified 652 CpGs with
Methylation profiling                                                                       significantly different methylation (adjusted P # .01), of which 572
                                                                                            (80%) CpGs had increased methylation and 80 (20%) had
We next explored whether the epigenetic landscape at the level of
                                                                                            decreased methylation in the ET cohort (supplemental Figure 4A).
DNA methylation profiles differed among the patients with ET
                                                                                            There was no significant overlap between genes with differential
according to their mutation subtypes. The DNA methylation profiles
                                                                                            methylation and DEGs (x2 . 0.5), with only 15 overlapping genes.
of 25 TN ET patients, 4 JAK2V617F-mutated ET patients, and
                                                                                            This finding suggests that gene expression changes between ET
3 CALR-mutated ET patients were determined by using the human
                                                                                            and HV result primarily from DNA methylation–independent
methylation 850K array. Similar to their gene expression profiles, all
                                                                                            mechanisms.
ET samples, regardless of mutation subtype, shared highly
correlated methylation profiles, with a median Pearson correlation                          We subsequently investigated the promoter methylation patterns of
of 0.98 (supplemental Figure 3A). Methylation profiles did not                              DEGs. A significant difference was observed in the median
cluster on the basis of cytoreductive agent, age, sex, or white blood                       methylation between upregulated and downregulated gene pro-
cell composition (supplemental Figure 3B). On average, 43% of                               moters (Figure 2C). Interestingly, however, both upregulated and
cytosine guanine dinucleotides (CpGs) were hypermethylated and                              downregulated promoters were predominantly hypomethylated.
25% were hypomethylated. As expected, gene promoters were                                   Overall, 58% of the DEGs had consistently hypomethylated
predominantly hypomethylated, whereas gene bodies showed                                    promoters, and almost none were hypermethylated (Figure 2D).
a methylation distribution similar to that of total CpGs (supplemental                      Furthermore, the 58% of DEGs with hypomethylated promoters
Figure 3C).14                                                                               maintained enrichment for key genes involved in upregulated

1062    ALIMAM et al                                                                         23 FEBRUARY 2021 x VOLUME 5, NUMBER 4
A                                                                                                                                  B                                                                                                                    C
                                                                                                                                                                                                                                                                                               Key
                                                                                                                                                                                                                                                                                                                                                                                       TN
                                                                                                                                                                                                                                                                              6000

                                                                                                                                                                                                                                                                  Frequency
                                                                                                                                                                                                All ET vs Controls                                                                                                                                                                     JAK2
                                                                                                                                                                                                                                                                              4000                                                                                                     CALR
                                                                                                                                                   Decreased Expression Increased Expression
                                                                                                                                                                                                                                                                              2000                                                                                                     Control
                                                      2         e-42
                                                   *X =1.3                                                                                                                                                                                                                       0
                                                                                                                                                                                       4                                                                                              -10 -5    0     5    10
            *X =7.7
                     2                 e-15           CALR                           ADJ                      2
                                                                                                          *X =6.5
                                                                                                                        e-56                                                                                                    310
                                                                                                                                                                                                                                                                                          Log2(CPM+0.5)
                         JAK2                                                                                     TN                                                                                                        528
                                                          124                        122

                                                                                                                                                                                                                                                                                                                                                                                                                                      Downloaded from http://ashpublications.org/bloodadvances/article-pdf/5/4/1059/1800642/advancesadv2020003172.pdf by QUEEN'S UNIVERSITY MEDICAL LIBRARY user on 23 February 2021
                                                                                                                                                            -log10(adjusted p-value)
                                                                                                                                                                                       3
                                                    456                    1                 61

                                                                                                                                                                                                                                                                                                                                                                                                 Decreased in ET
                                      1603                    129                   3                    114
                                                                                                                                                                                       2
                                                                          211
                                                    150                                     14
                                                                161             48                                                                                                     1

                                                                          96

                                                                                                                                                                                                                                                                                                                                                                                                 Increased in ET
                                                                                                                                                                                       0
                                               JAK2 = JAK2 (n = 3) vs Controls (n = 4)
                                              CALR = CALR (n = 3) vs Controls (n = 4)
                                                TN = TN (n = 12) vs Controls (n = 4)                                                                                                            -5           0             5
                                              ADJ = (CALR,JAK2,TN) vs Controls (n = 4)
                                                                                                                                                                                                 Log2 fold change

        D                                                                                                                                                         E
                                                                                                                                                                                       10
                                                                                                                                                                                                  JUNB
                                                                                                                                                                                                                                                                                                                                                                           ET
                                                                                                                                                                                                                                                                                                                                                                           HV
                                     15
                                                    Hyperplasia of lymphoid organ                                                                                                          8                 THBS1        ITGA2B
                                                   Quantity of CD4+ T-lymphocytes                        Activated                                                                             XRCC5
                                                                                                                                                                                                           GRB2
                                                                                                                                                                                                                     RAC1
                                                          Osteopetrosis                                                                                                                                                                               TIMP1
                                                                                                                                                                   Log2(CPM +0.5)

                                                                                                                                                                                                                                            TGFB1                                                  FAXDC2 CEBPB
                                                                                                                                                                                                                                                                                     CEBPD
               Enriched annotation

                                                    Thrombocytopenia                                                                                                                                                               CSF2RB                                                TAL1    MAFB CDKN1A                       JUN
                                              Hemorrhagic disease
                                                                                                                                                                                           6           APC
                                                                                                                                                                                                                                       RXRA    UBE2I           SPI1
                                                                                                                                                                                                                                                                                  SIRPA
                                                                                                                                                                                                                  PRKCQ                                    RBM47
                                                                                                                                                                                                                                                                              LILRB3                                                               MYLB
                                                                                                                                                                                                                                                                                                                                RARA
                                                                                                     Differentiation of bone marrow cells                                                                                                                                                                       SIGLEC10
                                     10                                                                             Cancer
                                                                                                                                                                                                                                                                                               SRF                           GNA15
                                                                                                                                                                                                                                                                                                                           SSBP3           MAFG
                                                                                                                                                                                                                               PRMT1
                                                                                                           Megakaryocytopoiesis                                                                                                                                     RBBP5
                                                                                                                                                                                           4                                                                                                                                           HHEX
                                                                                        Myelopoiessis of hematopoietic progenitor cells                                                                                                                                                                                                                     CD40
                                                                   Deactivated                                                                                                                                                                                                                                                                                              ID1
                                                                                            Differentiation of hematopoietic progenitor cells                                                                                                                                                                                                                        EMP1
                                                                                                                                                                                                                                                                                                                                                                       RFRSF12A
                                                                                                                                                                                                                                                                                                                                              C12orf29
                                                                                                      Growth of connective tissue                                                                                                                                                                                    CCR6
                                      5                                                             Cell movement of neutrophils                                                           2                                                                                                                                                             CIAO3
                                                                                                                                                                                                                                                                                                                                                                 ZNF616        FOSL1
                                                                                              Proliferation of connective tissue cells
                                                                                             Differentiation of hematopoietic cells

                                                                                                                                                                                           0

                                              -4                   -2                   0                     2                       4
                                                                                                                                                                                                                                                                Gene expression rank in controls
                                                                              Annotation Z-score

        F                                      ELK1                             GTPBP1                              ITGA2B                              MAPKAPK2                                             MARCKS                                              GP1BB                                          ITGA7                         ITGB3                               KLF1                                 SPI1
                                                                        4.5                                 9                                                                                          4                                                   7                                     -2.5                                                                                                              9
                                     1.0                                                                                                          5.0                                                                                                                                                                                                                     2
                                                                        4.0                                 8                                                                                                                                              6                                     -3.0                                  8
                                                                                                                                                                                                       3                                                                                                                                                                  0                                        8
                                     0.8
                                                                                                            7                                     4.5
            Mean -ΔCT

                                                                                                                                                                                                                                               Mean -ΔCT

                                                                        3.5                                                                                                                                                                                5                                     -3.5                                                                                                              7
                                     0.6                                                                    6                                                                                          2                                                                                                                               6                                  -2
                                     0.4                                3.0                                                                                                                                                                                4                                     -4.0
                                                                                                            5                                     4.0                                                                                                                                                                                                                     -4                                       6
                                     0.2                                2.5                                                                                                                            1                                                   3
                                                                                                            4                                                                                                                                                                                    -4.5                                  4                                  -6                                       5
                                     0.0                                2.0                                                                       3.5                                                                                                      2
                                                                                                            3                                                                                          0                                                                                         -5.0                                                                     -8                                       4
                               -0.2                                     1.5                                 2                                                                                                                                              1                                                                           2
                                                                                                                                                  3.0
                                              12345                              12345                               12345                                           12345                                    12345                                                12345                                        12345                         12345                               12345                                12345

                                              NFKB2                             PFKFB3                                 RELA                                  FAXDC2                                           FOSL2                                                       TAL1                                  TGFB1                      CEBPB*                                 JUN*                                 JUND*
                                                                          6                                                                                                                                                                                4
                                                                                                         4.5                                                                                                                                                                                         8.0                                                                  0
                                     4.5                                                                                                                                                                                                                                                                                               8                                                          6.0
                                                                          5                                                                        4                                                                                                       3                                         7.5
                                                                                                         4.0                                                                                           4                                                                                                                                                                                          5.5
                                     4.0                                                                                                                                                                                                                                                                                               7                                  -1
             Mean -ΔCT

                                                                                                                                                                                                                                              Mean -ΔCT

                                                                                                                                                   3                                                                                                       2                                         7.0
                                                                          4                              3.5                                                                                                                                                                                                                                                                                      5.0
                                     3.5                                                                                                                                                                                                                                                             6.5                               6
                                                                                                                                                   2                                                   3                                                                                                                                                                  -2                      4.5
                                                                          3                              3.0                                                                                                                                               1
                                     3.0                                                                                                                                                                                                                                                             6.0                               5                                                          4.0
                                                                                                                                                   1                                                                                                                                                                                                                      -3
                                     2.5                                  2                              2.5                                                                                           2                                                   0                                         5.5                               4                                                          3.5
                                                                                                                                                   0                                                                                                                                                 5.0                                                                                          3.0
                                     2.0                                  1                              2.0                                                                                                                                               -1                                                                          3                                  -4

                                              12345                              12345                               12345                                           12345                                    12345                                                12345                                        12345                         12345                               12345                                12345

                                                                                                                                                                                       12
                                                                                                                                                                                       10
                                                                                                                                         HV
                                                                                                                                                        -log10(p-value)

                                                                                                                                         AII ET                                         8
                                                                                                                                         CALR                                           6
                                                                                                                                         JAK2                                           4
                                                                                                                                         TN
                                                                                                                                                                                        2
                                                                                                                                                                                                                                                                                                                p-value
A                                            B                                                        C                                               D
                                                                                                                                                                                 1.0
                                                                       15                    ** = < 2.5e-5
                                                                                                                                                                                                      *pvalue< 0.0006
                                                                            *= 0.0002

                                                                                                                                                                                 0.8
                  G Hypo        G Hyper                                                 **      **
                                                                                                                         Up            Down
                                                                       10                             **
       P Hypo       9                46   P Hyper                                                            P Hypo      151               201   P Hyper

                                                                                                                                                           Normalised b -value

                                                                                                                                                                                                                                          Downloaded from http://ashpublications.org/bloodadvances/article-pdf/5/4/1059/1800642/advancesadv2020003172.pdf by QUEEN'S UNIVERSITY MEDICAL LIBRARY user on 23 February 2021
                                                       Log2(CPM+0.5)
                  22        0         0                                                                                 159        0         1                                   0.6
           9476         0        0        69                                                                     9126         0        0         70
                                                                        5
                            0                                                                                                      0                                             0.4
                  113                 2                                                                                 326                  0
                        0       0                                                                                              0       0

                            0                                           0                                                          0
                                                                                                                                                                                 0.2                                    Hypomethylation

                                                                       -5
                                                                om 15 Hy per rom on
                                                                                                                                                                                 0.0
                                                                    er y G om r
                                                                         H r G e er

                                                                               G B y
                                                                                  e dy
                                                                                        y

                                                                                                                                                                                                         s

                                                                                                                                                                                                         s

                                                                                                                                                                                                          s
                                                                  ot 9 H po Pr ote

                                                                             er ne od

                                                                                     od

                                                                                                                                                                                                      er

                                                                                                                                                                                                       er

                                                                                                                                                                                                       er
                                                                      & pe en ot

                                                                                en o
                                                                                     i
                                                                            H o P ess

                                                                                                                                                                                       ot

                                                                                                                                                                                                    ot

                                                                                                                                                                                                    ot
                                                                           yp e B

                                                                                   B

                                                                                                                                                                                     om

                                                                                                                                                                                                 om

                                                                                                                                                                                                  om
                                                                        71 Hyp xpr

                                                                                                                                                                                   Pr

                                                                                                                                                                                               Pr

                                                                                                                                                                                               Pr
                                                                               E

                                                                                                                                                                                   e

                                                                                                                                                                                          d

                                                                                                                                                                                             d
                                                                         18 ne

                                                                                                                                                                                 en

                                                                                                                                                                                        te

                                                                                                                                                                                           te
                                                                       3 y
                                                                     96 Ge

                                                                                                                                                                                        la

                                                                                                                                                                                        la
                                                                                                                                                                      lG

                                                                                                                                                                                       gu

                                                                                                                                                                                                 gu
                                                                         l

                                                                                                                                                               Al
                                                                      Al

                                                                                                                                                                                   Re

                                                                                                                                                                                             Re
                                                                      3

                                                                                                                                                                                 Up

                                                                                                                                                                                             n
                                                                                                                                                                                        ow
                                                                                                                                                                                       D
                                                             Pr
                                                           o
                                                        yp
                                                      H
                                                    3
                                                             11

Figure 2. Methylation profiling of genes with altered expression. (A) Venn diagram illustrating the overlap of genes with hypomethylated or hypermethylated promoters
and hypermethylated or hypomethylated gene bodies. (B) Boxplot showing the expression distributions of genes with different methylation patterns. From left to right, green
indicates all genes; light red, 9618 genes with hypomethylated promoters; light blue, 71 genes with hypermethylated promoters; dark red, 33 genes with hypomethylated gene
bodies; gray, 159 genes with hypermethylated gene bodies; and yellow, 133 genes with both hypomethylated promoters and hypomethylated gene bodies. *Indicates the
Student t test P value when comparing each set vs the set with hypermethylated promoters (light blue). (C) Venn diagram shows the overlap of genes with hypomethylated or
hypermethylated promoters and genes that were differentially expressed. (D) Boxplots of the b value distributions of all genes promoters (light blue), upregulated promoters
(green), and downregulated promoters (red). The hypomethylated (b $ 0.2) region is highlighted by red shading. *The Student t test P value, determining the significance of
the difference between up/downregulated promoter b values. Down, gene expression is downregulated in ET vs HVP; Up, gene expression is upregulated in ET vs HV; P
hyper, promoter hypermethylated; P hypo, promoter hypomethylated.

pathways uncovered in our RNA-sequencing analysis, including the                                                      pathways such as JUN, JUNB, FOSL2, RELA, and BCL6 were
TNF, MAPK, and platelet pathways. Overall, although promoter                                                          identified, all of which were upregulated in the ET cohort.
hypomethylation is consistently observed at upregulated DEGs, it                                                      Interestingly we also observed enrichment for RARA and its co-
does not appear that changes in DNA methylation alone can                                                             factor RXRA. Using this approach, several TFs were identified
account for these changes in gene expression.                                                                         that could be driving the expression of genes leading to the ET
                                                                                                                      phenotype.
Transcriptional regulation by TFs
A fundamental aspect of gene regulation is by TFs and repressors.                                                     To understand if these gene promoters are active and accessible to
Thus, to explore the regulatory influence of TFs on the DEGs, the                                                     allow TF binding in an ET context, we interrogated publicly available
promoters of all upregulated DEGs were assessed for TF-binding                                                        RNA-sequencing and H3k27ac (acetylation) data in the SET-2 cell
motifs. There was a significant enrichment for many TFs involved in                                                   line.17,18 We first explored expression of the upregulated genes
myeloid cell development, including RARA, PU.1, and several KLF                                                       previously uncovered. Most upregulated genes have a high
genes (Figure 3A). Twenty-five of the enriched TFs were highly                                                        expression in the SET-2 cell line, with 63% in the upper expression
expressed in the ET cohort, with expression levels in the top quartile.                                               quartile, which is significantly higher than average (Figure 3B). We
A significant enrichment for TFs key in the NFkB, MAPK, and TNF                                                       also found that 42% of gene promotors have significant H3K27ac

Figure 1. (continued) score; the higher the score, the greater the activation, with a negative score indicating deactivation. Circle size is based on the –log10 P value for the
enrichment of each annotated term. All terms have an enrichment P value ,3.4e-03. (E) Ranked plot of the gene expression values for all genes involved in activated terms
derived from IPA. The x-axis represents each gene. The y-axis is the mean log2(CPM 10.5) expression for each gene in the ET cohort (purple) and the HVs (gold). The plot
centers around the ranked expression of each gene in the HV (from highest to lowest expression). The size of each red point represents the –log10 adjusted P value for how
significantly differentially expressed the gene is in the ET cohort vs the HV cohort. The shaded background represents the gene expression quantiles (green 5 upper quantile
[Q3 1 Q4], yellow 5 mid/low quantile [Q2], red 5 lowest quantile [Q1]). (F) Boxplots illustrating the qPCR results, comparing the mean –delta cycle threshold (CT) vs
reference gene for the HV samples (gold), all ET samples (purple), CALR samples (pink), JAK2 samples (blue), and TN samples (red). The purple bar plot illustrates the
significance of the difference between the HV and the ET cohort as a whole as determined by a Student t test. The –log10 P value is used here; thus, the higher the bar, the
more significant the difference to HV. *Probes used for these 3 genes may detect genomic DNA.

1064    ALIMAM et al                                                                                                    23 FEBRUARY 2021 x VOLUME 5, NUMBER 4
A                                                                                                                                                                                                                                   B
                        10                                                                                                                                                                         Up Regulated vs Control
                             JUNB
                                                                                                                                                                                                   Down Regulated vs Control                                                SET2 Cell line analysis: RNA-seq
                                                                                                                                                                                                   Expression in ET
                                   FOSBACH1
                               FOXP1                                                                                                                                                               Expression in Control                                                    15
                                                           FOXO3
                                              NFKB1
                                                    NFE2L2                                                                        JUN
                                                                                       FOSL2
                                                  NF1               RXRAKLF4SPI1NFE2BCL6
                                                               BACH2                                                RARA
                                                                                                                 RELA
                                                                                                                                                                                                                                                                                              e-09             e-08
                         5                                                                                                                                                                                                                                                              * = 3.8      * = 1.1
       Log2(CPM+0.5)

                                                                                                                                                                                                                                                                                                                             Downloaded from http://ashpublications.org/bloodadvances/article-pdf/5/4/1059/1800642/advancesadv2020003172.pdf by QUEEN'S UNIVERSITY MEDICAL LIBRARY user on 23 February 2021
                                                                                                                                              MAFK    EGR1
                                                                                                      ZNF675
                                                                                                                                                          VDR
                                                                                                ZNF189 ZNF692                       PPARA          MYB
                                                                                             ZNF41
                                                                                                                           BATF
                                                                                                                                                                                                                                                                            10
                                                                                                                                         SPIB                               ATF3

                                                                                                                                                                  RFX1

                                                                                                                                                                                                                                           Log2 CPM in the SET2 cell line
                                                                                                                                                                      ZNF341

                                                                                                                                                                                GLIS3
                         0                                                                                                                                                         HOXA9

                                                                                                                                                                                                                                                                             5

                                                                                                                                                                                             NANOG
                                                                                                                                                                                                 NR5A2
                                                                                                                                                                                                           FOXA2 HNF4A
                                                                                                                                                                                                               EBF2         FOXA1
                                                                                                                                                                                           PGR       WT1ZIC2
                                                                                                                                                                                                                     ISL1FOXD3
                        -5
                        20                                                                              Gene Expression Rank in Controls                                                                                                                                     0

                                                                                                                                        18
                                                                                                                                                                                     39
                        15                                                                   24
                                                                    15                                                                                                                                                                                                      -5
                              35
       -log10(qvalue)

                        10                                                              74

                                         35                                                                      27               37                                                                          61

                                                                                                                                                                                                                                                                                                sio e

                                                                                                                                                                                                                                                                                               en d

                                                                                                                                                                                                                                                                                               27 es
                                                                                                                                                                                                                                                                                             es en

                                                                                                                                                                                                                                                                                             G ate

                                                                                                                                                                                                                                                                                           3k n
                                                                                                                                                                                                                                                                                                     n

                                                                                                                                                                                                                                                                                                   es

                                                                                                                                                                                                                                                                                                   ac
                                                           2                     42 4                                 47                                                                                 40                   37

                                                                                                                                                                                                                                                                                         H Ge
                                                                                                                                                                                                                                                                                          pr G

                                                                                                                                                                                                                                                                                                  ul
                                                                                                            10                               67                  69

                                                                                                                                                                                                                                                                                                g
                                                                                                                                                                                                                                                                                       Ex T2

                                                                                                                                                                                                                                                                                     T2 ed
                                                                                                                                                                                                                                                                                             re
                         5

                                                                                                                                                                                                                                                                                           E
                                    21                79       35                                 2                                               25        78             17                                      51 45 66

                                                                                                                                                                                                                                                                                         Up

                                                                                                                                                                                                                                                                                           t
                                                                                                                                                                                                                                                                                        lS

                                                                                                                                                                                                                                                                                   SE ula
                                              3 22                       72 44                         52                  90                          11             16        48        88 85 11 96                              75 38

                                                                                                                                                                                                                                                                                      ur
                                                                                                                                                                                                                                                                            Al

                                                                                                                                                                                                                                                                                ith g
                                                                                                                                                                                                                                                                              w re
                                                                                                                                                                                                                                                                                    O

                                                                                                                                                                                                                                                                                  Up
                                                                                                                                                                                                                                                                               ur
                                                                                                                                                                                                                                                                             O
                         0
                                JUNB
                               FOXP1
                                  FOS
                              BACH1
                               NFKB1
                                   NF1
                              NFE2L2
                               FOXO3
                              BACH2
                                RXRA
                                 KLF4
                                 SPI1
                                NFE2
                                BCL6
                               FOSL2
                               ZNF41
                              ZNF189
                              ZNF675
                              ZNF692
                                RELA
                                RARA
                                 BATF
                                   JUN
                               PPARA
                                 SPIB
                                MAFK
                                 MYB
                                EGR1
                                  VDR
                                 RFX1
                              ZNF341
                                 ATF3
                                GLIS3
                               HOXA9
                                 PGR
                              NANOG
                               NR5A2
                                 WT1
                                 ZIC2
                               FOXA2
                                EBF2
                               HNF4A
                                  ISL1
                               FOXD3
                                                                                                          Enriched motifs in promoters

Figure 3. Motif landscape at differentially expressed genes. (A) Plot describes the top 45 motifs enriched at the 310 upregulated gene promoters. The bottom bar plot
illustrates the relative enrichment of each motif (–log10 q value), and the number on top of each bar is the percentage of promoters enriched with the motif. The top line plot
illustrates the expression of each of the 45 motifs in the HV samples (control) (gold) and the ET population (red). Green dots indicate genes that are significantly upregulated
vs HV, and pink dots indicate genes that are significantly downregulated vs HV (control). The highlighted color segments correspond to the expression quantiles (green 5
highest, yellow 5 medium, orange 5 low). (B) Boxplots illustrating the expression levels of genes in the SET-2 cell line. The gold box is the distribution of all SET-2 genes; the
pink box is the SET-2 expression levels of the 310 upregulated genes in the ET cohort; and the purple box is the SET-2 expression levels of upregulated genes with high
H3k27ac deposition at their promoters. *The Student t test P value when comparing each box vs the expression of all genes (gold box).

deposition, including ITGA2B, ITGB3, FOSL2, TAL1, JUND, and                                                                                                                          been previously detailed in ET. The germline mutation in S505N,
MAPK3 (supplemental Figure 5). Those genes with this active mark                                                                                                                     a point mutation that leads to the loss of the inhibitory effect on the
had a considerably higher expression overall. This suggests these                                                                                                                    TPO genes, was identified in 2 patients in the study cohort and is
promoters are highly active in this cell line and could be regulated                                                                                                                 well recognized in several kindreds.21 Four of 10 patients harbored
through the TF-binding sites we identified.                                                                                                                                          the classic mutation JAK2V617F. No germline JAK2 mutations
                                                                                                                                                                                     were identified in our cohort.
Discussion                                                                                                                                                                           It is important to note that the absence of mutations does not
In keeping with the literature, WES and targeted sequencing                                                                                                                          exclude alternative disease drivers, as it is well established that
facilitated the identification of canonical and noncanonical muta-                                                                                                                   WES cannot detect fusion oncogenes, mutations in regulatory
tions in MPL and JAK2 in 22% (10 of 46) of our TN cohort. This                                                                                                                       sequences, or alterations in gene expression. To further character-
included 2 of 10 patients harboring a somatic MPL mutation in exon                                                                                                                   ize the remaining true TN cohort, we used RNA-sequencing to
10 at positions W515R/G/S, all previously reported in patients with                                                                                                                  directly compare them with ET patients with known driver mutations
MPN.19 One patient had a mutation on exon 11 position R537W.                                                                                                                         and HVs. Significant correlations in gene expression were noted
The MPLR537W mutation is not widely described in ET; this                                                                                                                            regardless of mutation status, and consistent differences were
missense mutation in MPL located within the cytoplasmic domain                                                                                                                       found between the ET patients and HVs. Consistent with the well-
results in failure of JAK binding and signal transduction, and has                                                                                                                   established “inflammatory” phenotype associated with MPN, we
been associated with congenital amegakaryocytic thrombocytope-                                                                                                                       found upregulation of several pathways involved in hematopoiesis,
nia.20 We found MPL germline mutations in 3 patients: MPL P453R                                                                                                                      inflammation, and immune regulation, specifically NFkB, MAPK,
(n 5 1) and MPL S505N (n 5 2). The mutation on exon 9, position                                                                                                                      and TNF signaling, in parallel with upregulation of genes that drive
P453R is associated with the cytokine receptor domain and has not                                                                                                                    megakaryopoesis.22

                                                       23 FEBRUARY 2021 x VOLUME 5, NUMBER 4                                                                                                              GENOMIC CHARACTERIZATION OF “TRIPLE-NEGATIVE” ET                                                            1065
We identified 838 genes in ET patients that are consistently            expression, and methylation profiles. We acknowledge that a
differentially expressed compared with HVs. Contrary to our             potential weakness of our work is the absence of comparison
expectation, however, ET gene expression profiles correlated highly     with reactive thrombocytosis patients; this topic could be assessed
with one another and did not cluster according to mutation              in future studies. However, we are able to show that a proportion of
subtypes. Indeed, this was also observed at an epigenetic level in      TN ET patients have low-level canonical and noncanonical
terms of DNA methylation profiles, with no clustering based on          mutations in MPL and JAK2 genes. ET gene expression and DNA
mutation subtypes. This was validated further with RT-qPCR in an        methylation profiles correlated highly with one another and did not

                                                                                                                                               Downloaded from http://ashpublications.org/bloodadvances/article-pdf/5/4/1059/1800642/advancesadv2020003172.pdf by QUEEN'S UNIVERSITY MEDICAL LIBRARY user on 23 February 2021
independent ET cohort, which exhibited significant upregulation of      cluster according to mutation subtypes. Thus, it is suggested that
20 key candidate genes in the ET population compared with HVs,          different driver mutations activate similar molecular pathways that
irrespective of mutation subtype. Taken together, our systematic        converge on a similar gene expression profile (that includes
genetic and epigenetic profiling indicates that different driver        upregulation of genes implicated in platelet proliferation such as
mutations may activate similar molecular pathways that converge on      ITGA2B and ITGB3), which ultimately results in the development of
a similar gene expression profile that ultimately results in the ET     ET. We speculate that this gene expression profile may be
phenotype.                                                              regulated by JUN family TFs, downstream of NFkB, MAPK, and
                                                                        TNF signaling. We hence provide an insight into the transcriptional
In our cohort, upregulation of genes associated with megakaryo-
poiesis, including ITGA2B and ITGB3, were identified. Such              and epigenetic regulation of ET and identify putative underlying
upregulation of ITGA2B and ITGB3 is in keeping with previous            molecular pathways that should be investigated further for the
findings by Müller et al,23 who also described altered expression in   potential for therapeutic targeting.
an MPN population. The ITGA2B gene encodes the aIIb subunit             Acknowledgments
(GPIIb) and is restricted to the megakaryocyte lineage, whereas the
ITGB3 gene encodes b3 (GPIIIa) and occurs in many cell types as         The authors thank all the patients and HVs who participated in this
a component of the vitronectin receptor (avb3).24,25 Together, they     study. The authors extend a special thanks to the Cangen group for
form the GPIIb/IIIa complex, which is a platelet–platelet contact       their support throughout the project.
receptor for the clotting factors von Willebrand factor and
fibrinogen in activated platelets, and initiates aggregation.25,26
                                                                        Authorship
The synthesis of GPIIb/IIIa occurs primarily in the megakaryocytes      Contribution: S.A. designed the study, collected and processed
and is detectable at an early stage of maturation.27                    samples, conducted experiments, analyzed data, and wrote the
                                                                        manuscript; W.V. analyzed data and contributed to writing of the
As highlighted, upregulated DEGs displayed consistent promoter
                                                                        manuscript; R.D. oversaw experimental design, processed samples,
hypomethylation. The DEG promoter sequences were enriched for
                                                                        and contributed to the manuscript; M.S., A.S., P.L., and K.M. per-
TF-binding motifs, including that of JUN family members. We
                                                                        formed data analysis; P.C. performed data analysis and contributed
identified that a large proportion of these gene promoters may be
                                                                        to the manuscript; M.R., A.K., J.K.-C., S.O., and B.B.P. processed
highly active and accessible to the TFs in an ET cell line (SET-2).
                                                                        samples; D.R. contributed patients to the study; C.W. and Y.F. per-
The activating protein-1 TF family is made up of multiple Jun
                                                                        formed sample collection; S.K. contributed to the manuscript; G.M.
(cJun, JunB, and JunD) and FOS members. Activating protein-1,
                                                                        supervised the project; D.P.M. and C.N.H. supervised the project and
as with NFkB, regulates many of the inflammatory and immune
                                                                        contributed to writing the manuscript; and all authors read and ap-
pathways, functioning downstream of the MAPK pathway and
                                                                        proved the submitted manuscript.
resulting in essential cellular processes that include proliferation
and differentiation.28                                                     Conflict-of-interest disclosure: C.N.H. reports funded research
                                                                        from Novartis; speaker fees from Novartis, Janssen, CTI, Celgene,
The JAK signal transducer, which has a central role in MPN
                                                                        and Medscape; and advisory board membership for Incyte, CTI,
pathogenesis, is critical for signaling of multiple cytokines and, in
                                                                        Sierra Oncology, Novartis, Celgene, Roche, AOP pharma, Geron,
addition to STAT, leads to MAPK pathway activation with resultant
                                                                        and AstraZeneca. D.P.M. reports speaker fees and advisory board
dysregulation of cellular proliferation.29 Across this ET cohort, we
                                                                        memberships with Novartis, Celgene, and Jazz Pharmaceuticals.
reported the upregulation of genes downstream of the MAPK
                                                                        S.K. reports research grants from Celgene and Novartis; and
pathway that included MAP3K11, ELK1, NFkB, JUND, and JUN
                                                                        speaker honorarium from Alexion. The remaining authors declare no
(supplemental Figure 2). We also observed an upregulation of
                                                                        competing financial interests.
the FAXDC2 gene, which has been recently implicated as
a driver critical for megakaryopoiesis, acting through the                ORCID profiles: S.A., 0000-0003-4784-7324; R.D., 0000-
activation of MAPK/extracellular signal-regulated kinase sig-           0001-9333-5296; P.C., 0000-0002-0048-4100; K.M., 0000-
naling. 30 Moreover, we identified upregulation of NFkB, in             0002-6362-4481; B.B.P., 0000-0002-5335-2726; S.K., 0000-
parallel with the subunit RELA, which is the primary driver for         0002-0347-4207.
inflammation and cell proliferation. 31 In many cells, NFkB                 Correspondence: Samah Alimam, Department of Haematology,
promotes a prosurvival state by enhancing the G1 phase to the           4th Floor, Southwark Wing, Guy’s and St. Thomas’ NHS Founda-
S phase cell cycle progression and upregulating antiapoptotic           tion Trust, Great Maze Pond, London SE1 9RT, United Kingdom;
proteins such as BCL2 and BCL-xl; however, in platelets, their          e-mail: samah.alimam@nhs.net; and Claire N. Harrison, Department
functional relevance remains unclear. 32-35                             of Haematology, 4th Floor, Southwark Wing, Guy’s and St. Thomas’
To our knowledge, this study is the first to use a systematic           NHS Foundation Trust, Great Maze Pond, London SE1 9RT, United
approach to TN ET patients in the evaluation of molecular, gene         Kingdom; e-mail: claire.harrison@gstt.nhs.uk.

1066   ALIMAM et al                                                      23 FEBRUARY 2021 x VOLUME 5, NUMBER 4
References

1.   Hasselbalch HC, Bjørn ME. MPNs as inflammatory diseases: the evidence, consequences, and perspectives. Mediators Inflamm. 2015;2015:102476.
2.   Cerquozzi S, Tefferi A. Blast transformation and fibrotic progression in polycythemia vera and essential thrombocythemia: a literature review of incidence
     and risk factors. Blood Cancer J. 2015;5(11):e366.

                                                                                                                                                                     Downloaded from http://ashpublications.org/bloodadvances/article-pdf/5/4/1059/1800642/advancesadv2020003172.pdf by QUEEN'S UNIVERSITY MEDICAL LIBRARY user on 23 February 2021
3.   Yogarajah M, Tefferi A. Leukemic transformation in myeloproliferative neoplasms: a literature review on risk, characteristics, and outcome. Mayo Clin
     Proc. 2017;92(7):1118-1128.
4.   Milosevic Feenstra JD, Nivarthi H, Gisslinger H, et al. Whole-exome sequencing identifies novel MPL and JAK2 mutations in triple-negative
     myeloproliferative neoplasms. Blood. 2016;127(3):325-332.
5.   Tefferi A, Barbui T. Polycythemia vera and essential thrombocythemia: 2017 update on diagnosis, risk-stratification, and management. Am J Hematol.
     2017;92(1):94-108.
6.   Pérez C, Pascual M, Martı́n-Subero JI, et al. Aberrant DNA methylation profile of chronic and transformed classic Philadelphia-negative myeloproliferative
     neoplasms. Haematologica. 2013;98(9):1414-1420.
7.   Rice KL, Lin X, Wolniak K, et al. Analysis of genomic aberrations and gene expression profiling identifies novel lesions and pathways in myeloproliferative
     neoplasms. Blood Cancer J. 2011;1(11):e40.
8.   Wong WJ, Baltay M, Getz A, et al. Gene expression profiling distinguishes prefibrotic from overtly fibrotic myeloproliferative neoplasms and identifies
     disease subsets with distinct inflammatory signatures. PLoS One. 2019;14(5):e0216810.
9.   Ritchie ME, Phipson B, Wu D, et al. limma powers differential expression analyses for RNA-sequencing and microarray studies. Nucleic Acids Res. 2015;
     43(7):e47.
10. Grimwade D, Jovanovic JV, Hills RK, et al. Prospective minimal residual disease monitoring to predict relapse of acute promyelocytic leukemia and to
    direct pre-emptive arsenic trioxide therapy. J Clin Oncol. 2009;27(22):3650-3658.
11. Gabert J, Beillard E, van der Velden VH, et al. Standardization and quality control studies of “real-time” quantitative reverse transcriptase polymerase chain
    reaction of fusion gene transcripts for residual disease detection in leukemia—a Europe Against Cancer program. Leukemia. 2003;17(12):2318-2357.
12. Skov V, Riley CH, Thomassen M, et al. The impact of interferon-alpha2 on HLA genes in patients with polycythemia vera and related neoplasms. Leuk
    Lymphoma. 2017;58(8):1914-1921.
13. Agarwal R, Blombery P, McBean M, et al. Clinicopathological differences exist between CALR- and JAK2-mutated myeloproliferative neoplasms despite
    a similar molecular landscape: data from targeted next-generation sequencing in the diagnostic laboratory. Ann Hematol. 2017;96(5):725-732.
14. Zuo Z, Li S, Xu J, You MJ, Khoury JD, Yin CC. Philadelphia-negative myeloproliferative neoplasms: laboratory workup in the era of next-generation
    sequencing. Curr Hematol Malig Rep. 2019;14(5):376-385.
15. Yang X, Han H, De Carvalho DD, Lay FD, Jones PA, Liang G. Gene body methylation can alter gene expression and is a therapeutic target in cancer.
    Cancer Cell. 2014;26(4):577-590.
16. Arechederra M, Daian F, Yim A, et al. Hypermethylation of gene body CpG islands predicts high dosage of functional oncogenes in liver cancer
    [published correction appears in Nat Commun. 2018;9(1):3976]. Nat Commun. 2018;9(1):3164.
17. Pelish HE, Liau BB, Nitulescu II, et al. Mediator kinase inhibition further activates super-enhancer-associated genes in AML. Nature. 2015;526(7572):
    273-276.
18. Kleppe M, Koche R, Zou L, et al. Dual targeting of oncogenic activation and inflammatory signaling increases therapeutic efficacy in myeloproliferative
    neoplasms. Cancer Cell. 2018;33(4):785-787.
19. Elsayed AG, Ranavaya A, Jamil MO. MPL Y252H anMd PL F126fs mutations in essential thrombocythemia: case series and review of literature. Hematol
    Rep. 2019;11(1):7868.
20. Newman LA, Luter MA, Davis DB, Abdul-Rahman OA, Johnson JM, Megason GC. Congenital amegakaryocytic thrombocytopenia: a case series
    indicating 2 founder variants in the Mississippi Band of Choctaw Indians. J Pediatr Hematol Oncol. 2017;39(7):573-575.
21. Ding J, Komatsu H, Wakita A, et al. Familial essential thrombocythemia associated with a dominant-positive activating mutation of the c-MPL gene, which
    encodes for the receptor for thrombopoietin. Blood. 2004;103(11):4198-4200.
22. Tefferi A. Pathogenesis of myelofibrosis with myeloid metaplasia. J Clin Oncol. 2005;23(33):8520-8530.
23. Müller CI, Luong QT, Shih LY, et al. Identification of marker genes including RUNX3 (AML2) that discriminate between different myeloproliferative
    neoplasms and normal individuals. Leukemia. 2008;22(9):1773-1778.
24. Xiang Q, Ji SD, Zhang Z, Zhao X, Cui YM. Identification of ITGA2B and ITGB3 single-nucleotide polymorphisms and their influences on the platelet
    function. BioMed Res Int. 2016;2016:5675084.
25. Fiore M, Nurden AT, Nurden P, Seligsohn U. Clinical utility gene card for: Glanzmann thrombasthenia. Eur J Hum Genet. 2012;20(10):
26. Calvete JJ. Clues for understanding the structure and function of a prototypic human integrin: the platelet glycoprotein IIb/IIIa complex. Thromb Haemost.
    1994;72(1):1-15.
27. Mitchell WB, Li J, Murcia M, Valentin N, Newman PJ, Coller BS. Mapping early conformational changes in alphaIIb and beta3 during biogenesis reveals
    a potential mechanism for alphaIIbbeta3 adopting its bent conformation. Blood. 2007;109(9):3725-3732.
28. Séverin S, Ghevaert C, Mazharian A. The mitogen-activated protein kinase signaling pathways: role in megakaryocyte differentiation. J Thromb Haemost.
    2010;8(1):17-26.

                              23 FEBRUARY 2021 x VOLUME 5, NUMBER 4                            GENOMIC CHARACTERIZATION OF “TRIPLE-NEGATIVE” ET              1067
29. Wolf A, Eulenfeld R, Gäbler K, et al. JAK2-V617F-induced MAPK activity is regulated by PI3K and acts synergistically with PI3K on the proliferation of
    JAK2-V617F-positive cells. JAK-STAT. 2013;2(3):e24574.
30. Jin Q, Ren Y, Wang M, et al. Novel function of FAXDC2 in megakaryopoiesis. Blood Cancer J. 2016;6(9):e478.
31. Lawrence T. The nuclear factor NF-kappaB pathway in inflammation. Cold Spring Harb Perspect Biol. 2009;1(6):a001651.
32. Spinelli SL, Casey AE, Pollock SJ, et al. Platelets and megakaryocytes contain functional nuclear factor-kappaB. Arterioscler Thromb Vasc Biol. 2010;
    30(3):591-598.

                                                                                                                                                              Downloaded from http://ashpublications.org/bloodadvances/article-pdf/5/4/1059/1800642/advancesadv2020003172.pdf by QUEEN'S UNIVERSITY MEDICAL LIBRARY user on 23 February 2021
33. Paul M, Kemparaju K, Girish KS. Inhibition of constitutive NF-kB activity induces platelet apoptosis via ER stress. Biochem Biophys Res Commun. 2017;
    493(4):1471-1477.
34. Piva R, Belardo G, Santoro MG. NF-kappaB: a stress-regulated switch for cell survival. Antioxid Redox Signal. 2006;8(3-4):478-486.
35. Ghosh S, Hayden MS. New regulators of NF-kappaB in inflammation. Nat Rev Immunol. 2008;8(11):837-848.

1068   ALIMAM et al                                                              23 FEBRUARY 2021 x VOLUME 5, NUMBER 4
You can also read