PERPETUA PERSPECTIVES - WINTER EDITION 2019 - Perpetua Investment Managers
←
→
Page content transcription
If your browser does not render page correctly, please read the page content below

PERPETUA
PERSPECTIVES
WINTER EDITION 2019

CONTENT
1    Opening perspectives
     Logan Govender

3    The comeback kids
     Delphine Govender

5    South African listed property: is it time to invest?
     Lonwabo Maqubela and Museja Makhaga

9
     Group 5: How a single project sank one of South
     Africa’s largest construction companies
     Glen Heinrich

12   Digital advertising prospects vs privacy regulations:
     how to balance an investment in Facebook
     Mark Butler

16   Q&A Perpetua’s alternative investment offering
     Mike Brooks

18   Explained: Share buybacks
     Phomolo Rabana

21   Invest with us
     Perpetua fund offerings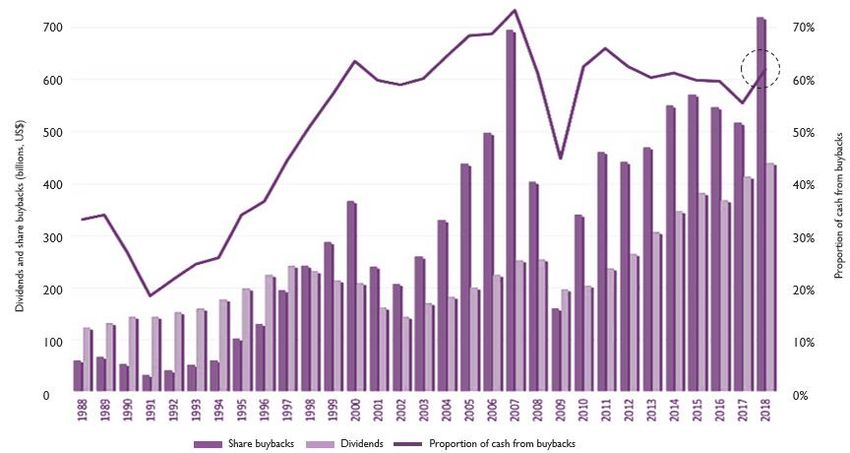
PERPETUA PERSPECTIVES
WINTER EDITION 2019
While it is impossible for us to “call the bottom” or low
point in our performance, as we focus on the individual
stocks we have invested capital in and what we expect
from their fundamentally driven returns, we are
confident that this current portfolio offers potential for
meaningful returns from this point.
We would summarise our underperformance as having
Logan Govender
been attributed to the following broad reasons:
Executive Director
A deeply out-of-favour cycle for our investment
Opening perspectives approach and style: specifically, true value
It has been an eventful but weak second investing. This has now persisted as the longest
quarter time that the investment style has
underperformed, both globally and locally.
The second quarter was eventful in terms of markets and
An unconstrained investment approach, which
politics. In South Africa we saw a peaceful election which
builds portfolios without initial reference to the
emphasised our democracy. While President Cyril
benchmark, and therefore has the potential to
Ramaphosa appears to have been given a clear mandate deliver returns very different to the benchmark.
to implement a “new dawn” post a lost decade for the This has specifically hurt the relative performance
economy and country, we witnessed already that the of the fund given the concentration of the
internal factions within the ANC seem to be conspiring benchmark, specifically Naspers.
against the effective implementation of this mandate. Stock-specific detractors, which we could broadly
summarise into the following groupings:
The conflicting messages on the independence of the
o larger fund holdings experiencing poor cyclical
Reserve Bank; the questionable appointment of certain
operational performance and low earnings
politicians in the new Cabinet; and internal party discord visibility causing the market to de-rate these
seems to be weighing heavily on market confidence. stocks e.g. Tiger Brands, Pioneer Foods, Life
These factors together with the weakest economic cycle Healthcare, Woolworths Holdings
in over 40 years; further potential corporate accounting o larger fund holdings which have experienced
irregularities as appear to be the case at industrial regulatory hits creating a vacuum of uncertainty
company, Tongaat Limited; and continued fall-out from causing the market to price these stocks in a
potential global trade wars have further weighed down discounted range-bound manner e.g. British
on investor confidence. American Tobacco, MTN
o smaller fund holdings with higher levels of
leverage but which have subsequently suffered
Our performance has lagged this past tough operational performance and these
quarter but we remain optimistic about the combined factors having caused the market
portfolio (and other capital providers) to become
exceedingly anxious about the business’
Following a particularly difficult May for both markets
stability and resulting in severe sell-down in the
as well as our portfolio, our investment performance
respective shares e.g. Aspen, Blue Label
has meaningfully lagged all relevant benchmarks this
Telecoms, Omnia and Brait.
quarter. While this outcome is naturally very
disappointing, we also believe this underperformance is We are deeply mindful and aware that poor returns can
temporary especially in so far as it relates to some of at times engender anxiety about poor returns
the larger holdings in the fund. continuing. This is a function of market momentum
combined with investor psyche. This can be further
exacerbated when poor domestic macro-economic
1
PERPETUA PERSPECTIVES
                                                                                              WINTER EDITION 2019

factors; global geo-political challenges; and a volatile        In this edition of Perpetua Perspectives
domestic political backdrop make for a hugely uncertain         We start this edition with Perpetua’s CIO, Delphine
investing environment. As custodians over our clients’          Govender sharing an opinion piece on the potential for
capital we accept that our obligation is to be                  “comebacks” across the market; economy and South
transparent, open and clear about our investment                Africa as a whole.
actions. At the same time our responsibility is also to
remain steady for our clients as we look through the            Following a protracted period of underperformance in
negative sentiment and noise from the market; and               the property sector, portfolio manager, Lonwabo
remain focused on the longer-term investing                     Maqubela and analyst, Museja Makhaga discuss why the
fundamentals for the benefit of our clients.                    sector has underperformed and whether or not this is
                                                                now an opportune time to consider investing.
Benjamin Graham is long regarded as the father of
fundamental, long-term, value-oriented investing and            In our stock-specific section this quarter, we opted for
his words below, we believe, hold relevance and                 an angle not regularly taken by investors – explaining
applicability as much now as at similar times of                the mistake with the investment in construction group,
considerable pessimism:                                         Group 5. Portfolio manager, Glen Heinrich details an
                                                                explanatory case study on Group 5 Limited and how
  “How your investments behave is much less                     the company’s excessive risk-taking ended in failure.
    important than how you behave….the                          On the global front, Mark Butler examines the quandary
                                                                Facebook faces in balancing its dominance in the ever-
 investor’s chief problem – and even his worst                  growing digital marketing arena with the ongoing and
        enemy – is likely to be himself”                        heightened risk it faces in privacy regulations.
We believe what Graham meant is that our own                    To provide more insight into Perpetua’s alternative
behaviour is, indeed, our greatest threat as investors          investment offering, we include a ‘Q&A’ with the
(both as investment managers and in terms of our                capability leader, Mike Brooks. We conclude the
clients). Investment markets do not determine our               edition once again with the second article in our
success, but it is how we react to them that does.              “Explained” series, a ‘teach-in’ series that we launched
                                                                last quarter. This time analyst, Phomolo Rabana
Successful long-term investing therefore requires us to
                                                                explains Share buybacks in more detail.
have courage to embrace, not avoid, the most difficult
and uncomfortable times in investment markets, for this         We hope you will enjoy this edition of Perpetua
is when the long-term rewards on offer and                      Perspectives and as always value any feedback you
opportunities are greater. The reality is though that, at       might have.
these times of consensus fear, concern and pessimism
is exactly when a non-consensus approach creates
discomfort, moreover still when investment outcomes
have been poor.
At Perpetua we strive to digest the reality of the
present time, while ensuring we make rational decisions
and not emotional ones. We believe that those who
exercise some patience and take a long-term view on
the South African path to recovery might stand a
chance to benefit immensely amidst broad pessimism.
As investors, we do this by investing in defensible, real
businesses that continue to generate cash flow and offer
considerable value at current prices; equally committed
to attaining the same objective as ourselves.

                                                            2
PERPETUA PERSPECTIVES
                                                                                              WINTER EDITION 2019

                                                               Value investing (and investors) has really
                                                               fallen but looks ready to stage a comeback
                                                               After experiencing its most protracted period of
                                                               underperformance ever as an investment style (similar
                                                               in length to Tiger Wood’s major win drought), value
                                                               investing has been largely “left for dead” by market
                                                               participants and clients. As managers who pursue this
                           Delphine Govender
                                                               style, while we have achieved periods of
                           Chief Investment Officer
                                                               outperformance, since inception of our firm six years
The comeback kids                                              ago Perpetua too has experienced the associated
                                                               underperformance of value investing. While this may
Tiger Woods’ win at the US Masters was the                     leave many questioning whether value investing (and
sporting comeback story of the decade                          indeed our own performance) could ever make a
The second quarter of the year is generally filled with        comeback, the environment is certainly starting to look
many sporting highlights from the UEFA Champions               more promising for this as a likelihood.
League final in soccer to the US Masters in golf. On 14
                                                               We see this in a few ways: purely from a valuation
April 2019, Tiger Woods won his 5th US Masters title.
                                                               perspective both globally and in South Africa there are
I might normally take the time to explain the meaning
                                                               more cheap shares today than we have seen over the
of the Masters and Tiger Woods, but this is Tiger
                                                               past 8-10 years; the disparity between expensive and
Woods and there are relatively few people who, over
                                                               cheap shares is also very wide; the fundamental quality
the past 22 years, will not have heard of him or what
                                                               of the undervalued businesses is better on the whole;
the Masters represents. The win was poignant because
                                                               and the extent of the undervaluation of cheap shares is
Tiger first won the US Masters 22 years ago, in 1997
                                                               now also wider now than we have seen over this
and last won it 14 years, in 2005. In fact the last time
                                                               period. These factors set the stage for value-oriented
Tiger won a major golf tournament was over 11 years
                                                               stocks to perform better now and looking forward over
ago in 2008.
                                                               the next 3-5 years.
Imagine that, 11 years without a major win and then
                                                               But one of the most important ingredients to the
winning in such a manner. Imagine being on top for so
                                                               resurgence of value investing, are value investors. Value
many years as Tiger had been until 2008, then crashing
                                                               investors require the emotional resilience to persist in
down, remaining down, only to climb back to the top
                                                               a long-term oriented, fundamentally-driven approach
after a long and difficult decade. Tiger’s story is the
                                                               even when and especially when the outcomes from this
comeback story of the year not just in sport but also in
                                                               approach lag. They also require the humility and
life it seems. Possibly even the comeback story of the
                                                               honesty to separate forced vs unforced errors and
decade.
                                                               finally the courage and skill to apply current capital only
The win showed the power of the human                          to those investments where they have a high confidence
spirit remains constant                                        of positive prospective returns irrespective of history;
At a time where so many of our vocations seem to be            sunk capital; career risk or consensus views.
threatened by, co-mingled with or even already partially       There are many companies that                         are
replaced by technological or artificially intelligent          currently “down and out”
equivalents, there is something uniquely affirming about
                                                               Over the past year the South African stockmarket has
being reminded of the triumph of the human spirit. It
                                                               also witnessed several previous ‘market darlings’ falling
is a triumph that is not achieved simply through luck,
                                                               hard. Fallen angels we call them in market speak.
timing or rising tides, but through reassessing game
                                                               Admired companies that we recently remember riding
plans, hard work, practice, resilience, grit and
                                                               the crest of a wave both in terms of business and share
determination. So Woods’ achievement is an important
                                                               price performance only to come crashing down. This
and timely reminder: to rise in such a manner you must
                                                               list of fallen angels on the South African stockmarket is
first fall.
                                                               growing. These are the favourite shares of two, three

                                                           3
PERPETUA PERSPECTIVES
                                                                                                       WINTER EDITION 2019

or four years ago like Aspen, British American Tobacco,           Ultimately, the biggest recovery we need to
Tiger Brands, Pioneer, Mediclinic, Life Healthcare and            see is in the South African economy
Woolies. We could even add other former leader                    While stock investors understandably focus on the
board shares in there like Coronation, Wilson Bayley              idiosyncratic possibilities of each stock which might be
Holmes, Massmart, Truworths, Capital & Counties and               missed by the broader market from time to time, the
Blue Label Telecoms.                                              biggest comeback kid of all we would all contend that
                                                                  we are really rooting for has to be the South African
Recovery and getting back on top is a
                                                                  economy. But even as Tiger demonstrated when he
process that requires deliberate action                           expressed to his caddy and manager after his
The essential question in each of these companies’                inspirational Masters win on Sunday, “WE did it!” all
respective pathways to recovery and maybe even                    real success stories are achieved through teamwork
reinstatement of their champion status would have to              even if a single individual is the face of the ultimate
centre on the elements within the control of these                success.
companies to restore their performance, and not
simply being passive beneficiaries of the recovery in the         The comeback of the South African economy doesn’t
environment around then. To accurately read their                 depend solely on the economic policies enacted by
customers’ changing consumption patterns and adapt                newly elected President Cyril Ramaphosa; or the state
their product mix accordingly; to allocate capital more           of our politics or even the level of US interest rates.
astutely as they invest to maintain relevance; to allocate        We know what it will take. It will take a combined
management time and energy wisely in favour of high               focus of all players (government, business, investors,
probability outcomes and not blind commitment to                  citizens and society) on the end goal; clear, honest and
poor decisions of the past; to have the right board               realistic strategies for how to get there; rehabilitation
members asking the right questions and to right-size              of damaged confidence; regaining of broken trust;
cost bases to pro-actively manage their businesses                tireless work and practice; reading the terrain
through all seasons. And even when it takes time for all          accurately and then just a little help from the wind.
these big things to fall into place, to do what Tiger said            A version of this article appeared in the FM on 24 April 2019
he did to help him win this time: keep doing all the little
things correctly…just keep plodding along.

                                                              4
PERPETUA PERSPECTIVES
WINTER EDITION 2019
The main reason is that we would expect the sector’s
dividends to grow, whereas government bond
distributions do not grow. The higher yield relative to
the South African 10-year bond becomes more
pronounced when you consider that the property
sector today is more geographically diversified into
regions with lower cost of capital, as reflected by the
blended yield (geographically weighted average bond
yield) shown in Graph 2.
Lonwabo Maqubela Museja Makhaga
Analyst
At these attractive valuations, is it time to
Portfolio Manager
invest?
South African listed property: is it The question in a contrarian’s mind is whether, despite
the known risks, valuations have corrected sufficiently
time to invest?
to justify investing. To answer this question, we believe
The local listed property sector has it is important to first consider the reasons why the
underperformed in recent years sector has de-rated:
The South African listed property sector has de-rated 1. Aggressive investment by property companies has
over the last few years. Due to risks relating to resulted in an oversupply of space
vacancies, lower rentals, potentially high debt levels, 2. Stocks trading at the highest yields have balance
and weak corporate governance abound. Graph 1 sheet pressure
shows the sector’s underperformance relative to other 3. Notoriously complex corporate structures and
asset classes. However, the longer-term relative opaque cross-holdings among many property
outperformance remains intact. The sector (SAPY) has companies has contributed to poor governance
a R400 billion market capitalisation consisting of 21
shares and has grown six-fold since 2005 (at a We will now discuss each of these reasons in more
compound annual growth rate of 17%). detail.
However, the sector is currently trading at 1. Aggressive investment by property
an attractive yield relative to the South companies has resulted in an oversupply of
African 10-year government bond space
Over the long term, we would expect the listed This is most evident in the office space sector in
property sector to trade at a premium (lower yield) Gauteng. Since 2011, we estimate that total space
relative to government bonds. increased by nearly a third, particularly in key
nodes such as Sandton (shown in Graph 3).
Graph 1: Listed property has significantly underperformed other asset classes in recent years
17.0%
15.5%
20%
Total return (annualised for 5 yrs and 15
12.5%
15%
9.7%
9.0%
8.4%
7.4%
7.4%
7.3%
7.0%
6.8%
6.6%
10%
5.8%
5.0%
4.7%
4.6%
4.2%
3.9%
3.2%
2.4%
5%
0.8%
0.6%
yrs)
0%
-5%
-3.5%
-10%
-9.6%
-15%
15yrs 5yrs 3yrs 1yrs Month-to-date Year-to-date
Listed property (J253T) Bonds (ALBI) Equities (J203T) Cash (STFIND)
Source: Anchor Capital, I-Net
5
PERPETUA PERSPECTIVES
WINTER EDITION 2019
Graph 2: The property sector is currently offering a higher yield Graph 4: Office vacancies are currently at 11.1%
than local bonds
SAPY DY vs BY for the period ending April 2019 14% 12.1%
11.3% 11.5% 11.2% 11.1%
12% 10.2% 9.7%
12% 9.0% 9.5%
10% 8.1% 8.2%
7.5%
10% 8% 6.1%
7.0%
8% 6%
6% 4%
4% 2%
2% 0%
Dec-05
Dec-06
Dec-07
Dec-08
Dec-09
Dec-10
Dec-11
Dec-12
Dec-13
Dec-14
Dec-15
Dec-16
Dec-17
Dec-18
0%
Dec-04
Dec-05
Dec-06
Dec-07
Dec-08
Dec-09
Dec-10
Dec-11
Dec-12
Dec-13
Dec-14
Dec-15
Dec-16
Dec-17
Dec-18
Source: SAPOA
Blended bond yield SA bond yield SAPY yield Excessive space growth is also evident in the retail
Sources: Avior capital markets, Bloomberg segment. Over the past five years, growth in South
African retail space was amongst the highest in the
Graph 3: Aggressive investment has led to an oversupply of office world! (See Graph 5)
space, especially in Gauteng
Graph 5: Retail space growth versus real GDP growth
in South Africa has been the highest in the world over
Development activity by Node; March 2019
the past 5 years
Sandton 0.9%
Waterfall 1.0%
Rosebank 1.0%
Menlyn/Faergie Glen/Ashlea Gardens 1.2%
Umhlanga/La lucia 1.5%
Midrand 1.5%
Cape Town CBD 1.7%
Bellville 1.7%
Bedfordview 2.0%
Fourways 2.0%
Claremont 3.1%
Centurion CBD 3.3%
Ballito 5.0%
Illovo 5.1%
Sources: Euromonitor, Stats SA
Houghton/Killarney 6.3%
Woodmead 6.8%
Despite this high level of growth, retail vacancies
Cresta/Blackheath/Randpark 13.8%
remain relatively low when compared to global
Westville 15.8%
Melrose/Waverley 26.4%
peers (as shown in Graph 6). In the UK, online retail
penetration is the highest in the world.
0% 10% 20% 30%
Notwithstanding this, vacancies have not risen as
% of total development gross lettable area (GLA) much as one would have thought. This supports our
Source: MSCI Real Estate, SAPOA view that physical retail will remain relatively
defensive, particularly when considering South
Vacancies are rising (as can be seen from Graph 4) Africa’s demographics. Some properties will also
and there is still further supply being added. More outperform each other for idiosyncratic factors.
than half of current developments are speculative,
i.e. not pre-let. We are of the view that office rentals
could remain depressed for some time.
6
PERPETUA PERSPECTIVES
WINTER EDITION 2019
Graph 6: Retail vacancies in South Africa are low Graph 7: Super-regionals (big malls) have the highest
compared to our global peers rent-to-sales ratios and vacancies
Rent-to-sales (%)
Retail vacancies (%)
16% 15%
14%
12%
10%
10%
8%
6% 5%
4%
2%
0%
0%
Jun-04
Jun-05
Jun-06
Jun-07
Jun-08
Jun-09
Jun-10
Jun-11
Jun-12
Jun-13
Jun-14
Jun-15
Jun-16
Jun-17
Jun-18
Dec-06
Dec-07
Dec-08
Dec-09
Dec-10
Dec-11
Dec-12
Dec-13
Dec-14
Dec-15
Dec-16
Dec-17
Dec-18
Super regional shopping centre
Regional shopping centre
UK SA CEE USA
Small regional shopping centre
Source: SAPOA Community shopping centre
Neighbourhood shopping centre
As with office space, our analysis shows that most of
the retail space growth happened in Gauteng. Nearly
half of South Africa’s retail property is in Gauteng. Vacancies per sub-sector (%)
12%
However, the ‘excess’ space is less significant when
10%
we adjust for higher population density and incomes
(spending power) in that province. We are of the 8%
view that 'catch up' growth from decades of under- 6%
investment in densely populated nodes such as 4%
townships also contributed to the high space
2%
growth.
0%
Nonetheless, the increased space growth coupled
Dec-02
Dec-03
Dec-04
Dec-05
Dec-06
Dec-07
Dec-08
Dec-09
Dec-10
Dec-11
Dec-12
Dec-13
Dec-14
Dec-15
Dec-16
Dec-17
Dec-18
with a weak retail environment has resulted in rising
rental costs and vacancies. Super-regionals (malls Super regional shopping centre
Regional shopping centre
larger than 100 000 m2) are under the most Small regional shopping centre
pressure. They have the highest vacancies and rent- Community shopping centre
to-sales ratios, as can been seen from Graphs 7 & 8. Source: SAPOA
However, super-regionals make up only 9% of the
listed property sector’s GLA. Over the longer term one would expect online
retail to gain market share relative to physical
Explanation of industry terms: retail. One of the risks implied in current
Gross Lettable Area (GLA) measures the valuations is that there will be negative reversions
amount of space that is available for letting in soon. The recent rental concessions for Edcon are
square meters. an example. Nevertheless, there are some
Rent to sales: Indicates the percentage of a mitigating factors, such as an improving economic
retailer’s sales that go towards paying the rent.
outlook and trading densities, and slowing future
The higher the ratio, the more unaffordable the
supply of retail space.
rental is.
Loan to value (LTV): The percentage of a
fund’s assets (at market value) that are funded by
2. Stocks trading at the highest yields have
debt. The higher the ratio, the less the financial balance sheet pressure
flexibility. Most of the companies trading at higher yields also
Cap rates: The implied rate used to value the have the highest balance sheet risk (high debt
present value of expected future cash flows. levels). Some of the counters have off-balance
7
PERPETUA PERSPECTIVES
WINTER EDITION 2019
sheet obligations that increase the level of To lessen the impact of these industry
disclosed debt. issues, we look for the ‘cleanest dirty shirt’
We estimate that if cap rates (the implied discount At Perpetua, we are stock pickers. We often look for
rate used to value the underlying properties) what we would call the ‘cleanest dirty shirt’ – the share
increase by 2%, the sector would breach debt that is less affected by industry issues than others but is
covenant requirements. This is the equivalent of a being priced by the market as though it is similar (poor)
30% decline in the value of properties. This is not quality to the pack. While we concede few companies
an inconceivable scenario for example if vacancies can completely avoid the current structural headwinds,
increased materially. This would most likely result we prefer listed property shares with the following
in the need to raise capital in the form of rights characteristics:
issuances. Issuing shares at these high yields would Strong management teams and shareholder friendly
be value destructive. To put it differently, the boards
current optically high forward yields have to be Either dominant in the respective sector, or well
adjusted down for the risk that investors will diversified across sub-sectors
receive a dividend and then will immediately have Low exposure to the oversupplied Gauteng office
to re-invest it in an equity raise. Therefore, an even sector
higher dividend yield is required in order to Assets of above-average quality that could
account for the risk of additional capital calls. withstand industry shifts and rising vacancies
Below-average levels of debt
3. Complexity and opacity resulting in
poor governance Once we screen for these factors, our investable
Following successive incidents and adverse universe becomes a lot smaller. Whilst we are able to
disclosures, governance across the sector (with uncover shares that meet these criteria, risks do
some few exceptions) has revealed itself to be remain. Consequently, we have been very measured in
evidently poor. Conflicts of interest are common the investments we have made in the South African
among management teams and/or board members. property sector to date.
Until recently, there were complex, opaque cross-
holding structures. Accounting policies are too
liberal and, in some cases, misleading.
8PERPETUA PERSPECTIVES
WINTER EDITION 2019
Figure 1: Group 5 is a diversified construction company operating
across three clusters
Glen Heinrich
Portfolio Manager
Group 5: How a single project sank
one of South Africa’s largest
construction companies
Increasing risk increases the range of
possible outcomes, including negative
outcomes
As investors, we are very aware of the concepts of risk
and return. Unfortunately, we often equate higher risk
Source: Group 5 website
to higher potential returns, without appreciating what
else higher risk can sometimes mean. In his book “The
1. The E&C business has been involved in
Most Important Thing”, Howard Marks shows that
building landmark projects in South
increasing risk increases the range of possible
Africa as well as other projects across
outcomes. This means that taking on more risk
the African continent
increases the chances of a negative outcome. Put
These include Menlyn Mall, the Medupi and Kusile
differently, taking on excessive risk in the pursuit of
power stations, the Gauteng Freeway
reward can result in losing much more than the Improvement Project (GFIP), the Moses Mabhida
foregone profits of not taking on the risk in the first Soccer Stadium, and the King Shaka International
place. Airport. This business also has a history of working
The story of Group 5, a diversified group of businesses in Africa, including building power plants and doing
with a conservatively run balance sheet that ended up other engineering projects across the continent.
in business rescue, is a good case study of this principle.
2. The I&C business houses the Group’s
Group 5 built one of South Africa’s largest investments in infrastructure
construction companies over its 45-year concessions
history This includes toll roads in Eastern Europe, as well
Group 5 got its name from its beginnings as an as an operations and maintenance services
amalgamation of five companies when it listed on the business. This business predominantly operates
JSE in 1974. Over the next 45 years, it became one of outside South Africa and its profits are of an
South Africa’s largest construction companies, annuity nature, offering more stability compared to
employing over 14 000 people and operating in 28 the more cyclical E&C business.
countries. 3. The Manufacturing business comprises
Group 5 grew into a diversified business operating of a fibre cement business (Everite) and
across three main clusters:
a steel business (BRI and Group 5 pipe)
1. Engineering and Construction (E&C) While this business is more asset intensive, it has
2. Investments and Concessions (I&C) managed to produce more stable profits over the
3. Manufacturing years, again offering more stability than the cyclical
E&C business.
9PERPETUA PERSPECTIVES
WINTER EDITION 2019
The Group benefited from the rapid growth To get back on track, Group 5 looked for
in construction before the World Cup, but new revenue sources but, in the process,
then the tide changed took on significant risk
Between 2000 and 2009, investment into infrastructure In this situation, a company has two choices to maintain
and the commodity super-cycle resulted in rapid profitability: apply aggressive cost cuts (which in this
growth of South Africa’s entire construction industry, case means jobs) or find new sources of revenue.
including Group 5. The Group’s annual revenue Group 5 initially opted for the latter, which resulted in
increased by more than four times, from R2.8 billion in growth in their revenue and earnings between 2012 and
2000 to over R12 billion in 2009. 2016.
To facilitate the increase in work, Group 5 grew its
The problem is they did this by taking on contracts that
workforce, bought equipment, and expanded its
carried higher risk in the form of Engineer, Procure and
physical presence.
Contract (EPC) work. With this type of contract, the
And then the super-cycle ended. The World Cup and EPC company is responsible for the overall
GFIP projects were completed, and there was too little performance and timing of the delivered product. That
work for too many players in the construction industry. means they are responsible for the work of all the
Revenue declined from R12 billion in 2009 to under R9 subcontractors as well as the performance of the
billion in 2012. In addition, Group 5’s profitability equipment. While some of this risk is mitigated through
plummeted, with earnings per share falling from almost back-to-back contracts with subcontractors and
R6 in 2009 to below R2 in 2012. equipment providers, these contracts ultimately placed
Group 5 in the firing line.
Graph 1: Group 5’s revenue increased rapidly between 2000 and 2009, but then fell in 2012
16
14
12
Revenue (R billions)
10
8
6
4
2
0
1999
2000
2001
2002
2003
2004
2005
2006
2007
2008
2009
2010
2011
2012
2013
2014
2015
2016
2017
2018
Source: FactSet
10PERPETUA PERSPECTIVES
WINTER EDITION 2019
A challenging environment made Group 5 a The share price rapidly declined to R0.60 per share as
seemingly attractive investment in 2014, but concerns about liquidity were raised. The company had
the risks were high to seek a bridge loan facility from the banks to fund
In 2014, Group 5 took on a R4 billion EPC project to completion of the project. It also used some of the cash
build a gas-fired power station in Ghana, called the in the I&C business to fund the Kpone cash
Kpone contract. For the next two years, the business requirements.
recorded revenue and profits on this project, and On 12 March 2019, Group 5 Construction and Group
everything appeared to be going relatively smoothly. 5 Limited went into business rescue and the share was
Delays caused by subcontractors and changing laws in suspended from trading. The I&C business was not
the country were expected to be mitigated by the legal subject to this process since the banks had secured the
contracts. assets against the bridge loan. While the outcome for
Over the same period, the environment in South Africa shareholders is currently unknown, it looks unlikely
continued to be very challenging, resulting in loss- that any value will be recovered after creditors have
making contracts and the need to restructure the E&C been paid. Many jobs will be lost, and a 45-year-old
business to reduce the cost base. As a result of these company that has helped build some of South Africa’s
losses, earnings declined and the share price fell from key infrastructure will cease to exist.
R40 in 2014 to R20 in 2016. Group 5’s story holds important lessons for
At this point the share started to look attractive from both business management and us as
an investment perspective, as the value in the I&C investors
business and the Manufacturing business exceeded the 1. Taking on excessive risk in the pursuit of
share price. Any eventual recovery in the construction reward can result in losing much more than
industry would result in upside that investors were not the foregone profits of not taking on the risk
paying for at the time. Unfortunately, the degree of risk in the first place.
associated with the Kpone project was not fully We especially need to guard against the typical
appreciated. human reaction of being willing to take on more
risk when we are down and trying to recover. In
In 2017, the resignation of certain the case of Group 5, management put the entire
management and board members put company at risk by taking on risky projects to
further pressure on the share price maintain or recover profitability.
When four senior managers (including the CEO) as well 2. As investors, we need to guard against taking
as two non-executive board members unexpectedly on excessive risk in our portfolios in the
resigned in 2017, Group 5 faced new challenges. The pursuit of outsized returns.
resignations led to significant shareholder engagement. At Perpetua, our first defence against this is buying
Activist shareholders demanded the removal and shares at a significant discount to what we calculate
replacement of the board to protect and realise the them to be worth. However, as investing is
remaining shareholder value. The share price continued probabilistic and there are several factors out of
to weaken, trading below R10 at one point, and then our control as investors, we can only minimise but
ending the year close to R14. not avoid mistakes. This is why our second line of
defence is allocating appropriate position sizes, i.e.
Soon after, the scope of the Group’s losses spreading our risk across different investments.
became evident and the company went into
business rescue This should ensure that, when investment mistakes
In March 2018, Group 5 released delayed financial inevitably occur, our portfolios can recover and our
results, declaring a R650 million loss on the Kpone clients can ultimately continue to grow their hard-
project (as well as other losses) and provisions resulting earned savings over the long term.
in a R7.80 loss per share.
11PERPETUA PERSPECTIVES
WINTER EDITION 2019
it is also the first thing they look at when they wake up
in the morning. In the US, the average time that adults
spend on digital media each day has more than doubled
since 2008. Graph 2 shows that more than one-third of
US adults’ waking hours are spent on a digital device.
This can include playing games, streaming content, or
engaging on social media platforms.
Mark Butler Graph 2: US adults spend more than one-third of their day on a
Co-portfolio manager digital device
6
Digital advertising prospects vs 0.4
0.6
0.4
privacy regulations: how to balance 5
0.3
0.3
an investment in Facebook 4
0.3
4.
Hours spent per day, USA
2.8 3.1 3.3
0.3 2.3 2.6
1.6
Digital advertising has become the largest 3
0.3
0.4 0.8
0.2 0.4
segment of global advertising spend 2
0.3 0.3
Digital advertising has enabled marketers to better
2.4 2.6 2.5
segment their market, engage with their customers, and 1 2.2 2.3 2.3 2.2 2.2 2.2 2.1
track their return on advertising spend. During 2017,
0
digital advertising spend surpassed the amount spent on 2008 2009 2010 2011 2012 2013 2014 2015 2016 2017
television advertising for the first time ever. MAGNA
Desktop/Laptop Mobile Other connected devices
GLOBAL’s forecasts in Graph 1 highlight the decline of
Source: Kleiner Perkins 2018 – Internet trends
spend on traditional print advertising, with newspapers’
share having declined from 8% to 3%, and magazines In South Africa, TV advertising continues to
from 4% to 1%. dominate because of structural challenges
Graph 1: Digital advertising as a percentage of global ad spend has South Africa’s ad spend per category highlights the
increased steadily structural challenges we face in the country. These
Global adspend per category include high levels of inequality, poor infrastructure and
100% the high cost of mobile data. TV advertising is forecast
80% to remain the largest segment until 2023. Digital
60% 42% advertising is only forecast to exceed radio in 2021, as
40%
shown in Graph 3.
20% 35% Graph 3: Ad spend on digital advertising in South Africa lags the
global trend
0%
South African adspend per category
2012
2013
2014
2015
2016
2017
2018
2019F
2020F
2021F
2022F
2023F
100%
Television Newspapers Internet/Digital 16% 17% 17% 17% 17% 17% 17% 18% 18% 18% 17% 17%
Magazines Radio Out of home 80%
8%
Source: Magna Global and Bloomberg 60% 25% 25%
13% 20%
40%
The amount of time consumers is spending 48% 48% 48% 47% 46% 45% 44% 43%
20% 40% 41% 42% 45%
on digital media is one of the key reasons for
the rise in digital ads 0%
2012
2013
2014
2015
2016
2017
2018
2020 F
2021 F
2022 F
2023 F
2019F
One of the reasons that digital advertising is on the rise
is because people are spending more and more time on Television Internet/Digital Newspaper
digital devices. A mobile phone is often the last item a Magazine Radio Out of home
person looks at before going to bed at night. Many
Source: Magna Global and Bloomberg
people also use their phone as their alarm, which means
12PERPETUA PERSPECTIVES
WINTER EDITION 2019
The fastest growing segment of digital On a revenue basis, Google and Facebook are the
advertising is social media, which Facebook dominant players in the digital advertising market. Over
currently dominates the last five years, Facebook has been catching up with
Within the digital advertising market, search results’ Google. During 2015, its advertising revenue as a
market share remains relatively constant, while percentage of Google’s revenue was 27%, and by 2018
display/banner loses share to online video and ever- it had increased to 47%. Graph 6 shows global digital
growing social media, as seen in Graph 4. advertising revenue for the top ten players for 2019 and
highlights how platforms are shifting roles and blurring
Facebook currently dominates social media advertising. the landscape. Google will move from an ad platform to
Unlike its competitors who have to pay for content, it an e-commerce platform and Amazon from an e-
benefits from a large network of users supplying the commerce platform to an ad platform.
content. This results in higher margins than traditional Graph 6: Google and Facebook dominate in terms of digital
media participants. advertising revenue
2019 forecast net digital advertising revenue (US$ billions)
Graph 4: Social media is the fastest-growing category of digital
advertising 120
Digital advertising per category 100
100% 80
60
80%
40
60%
20
40% 0
Baidu
Sina
Facebook
Alibaba
Amazon
Verizon
Tencent
Google
Twitter
Microsoft
20%
0%
2012
2013
2014
2015
2016
2017
2018
2019F
2020F
2021F
2022F
2023F
Source: eMarketer
Search Display Social Online video Other Digital advertisers track our digital
Source: Magna Global and Bloomberg
‘footprint’ for customised advertising, and
Facebook has mastered this art
In fact, Facebook is fast catching up with
Facebook’s Pixel is the name of a piece of software that
Google in terms of digital advertising
a website owner uses to share information with
revenue
Facebook. This is the ‘magic’ that runs in the
Facebook owns four of the top six social network
background and the reason why an advert will appear
platforms by number of users, as shown in Graph 5.
for an item that the user has recently browsed.
YouTube is owned by Alphabet (Google’s parent
company), and WeChat is owned by Tencent. Facebook maintains around 200 data points for each
user. Once a user provides an identifiable data point
Graph 5: Facebook owns four of the top six social network such as a phone number or email address, Facebook
platforms by number of users
will add it to their enormous database to enhance the
Social network users (millions, as at April 2019) profile they maintain for each user.
Facebook 2320 Marketers maintain their own ‘custom audience’ from
YouTube 1900
information provided by customers or from website
WhatsApp
Facebook Messenger traffic. Using this data, Facebook enables these markets
WeChat 1098 to create ‘look-alike audiences’, which allows them to
Instagram be more specific in targeting new customers. The
QQ benefit for marketers is that they are better able to
Qzone
calculate a return on their investment in advertising. If
Doyin/Tik Tok
they advertised using traditional print media, they
0 500 1000 1500 2000 2500
would not be able to track this. Online they are able to
Source: Statistica
track the success of the advert by monitoring how many
13PERPETUA PERSPECTIVES
WINTER EDITION 2019
users clicked on an advert and then responded to the The ongoing risk is not if additional
‘call to action’, which can include subscribing to a regulation will be added, but when and in
newsletter, adding a product to a shopping cart, or what form
completing a transaction. Self-regulation has not been effective and legislatures
Social media is also being used for product have been uncertain about what to legislate and how in
discovery this new digital world. The House of Representatives
judiciary committee announced their investigation into
According to a survey of 18- to 34-year-olds in the US,
competition in digital markets in June. In a worst-case
78% of respondents have found new products on
scenario, social media networks may be required to
Facebook. Instagram (owned by Facebook) and
break up the business and be held responsible for
Pinterest were the next best platforms, with 59%. In a
verifying the accuracy of content posted on their
survey of 18- to 65-year-olds, 55% of respondents had
platform, which will require additional resources and
purchased a product online after discovering it on social
result in lower profit margins.
media.
Online video is a leading discovery tool but is not the Facebook’s security scandal led to the
only source. As early as 2016, fashion group Burberry largest loss of value in one day in US stock
livestreamed their September London fashion show market history and created an opportunity
using Facebook Live. This included live interaction with to invest at an attractive valuation
Facebook messenger, where customers were able to Facebook’s results for the second quarter 2018 were
‘See now. Buy now’. lower than expected, and US$120 billion was wiped off
Facebook’s market value in one day. To put this into a
Concerns about privacy however prompted
South African perspective, Naspers’ value on that day
a rise in distrust of the industry and in was US$110 billion. The share price declined by 43%,
regulation as shown in Graph 7, from a peak of US$216.82 on 25
The EU introduced the General Data Protection July 2018, to a low of US$123.02 on 24 December
Regulation (GDPR) in May 2016, with enforcement 2018. The share featured in our screening analysis and
from 25 May 2018. This however did not have much of we began researching it. This included debating
an impact on the number of European users, which assumptions and preparing a valuation range. There is a
declined by 0.3% over the quarter when the legislation clear distinction between the value of a share and the
was enforced. price of share. The value of a share is what the business
is worth the price of a share is based on what the
After Facebook’s privacy breach scandals in 2018, CEO
market is willing to pay for that share at a particular
Mark Zuckerberg acknowledged what a challenge it is
time. The price of a share is more volatile than the value
to ‘fix’ Facebook following these. The scandals included
of a share and overtime the price may be above the
granting Cambridge Analytica access to personal data of
value /overpriced or below the value of the share. The
87 million users without their consent, Facebook being
decline in the price of Facebook’s share presented an
used in meddling in various elections, and hiring a PR
opportunity to invest in the business at a price
firm to discredit opponents. The security breach on
significantly below our estimation of fair value.
Facebook’s messaging app, WhatsApp, in May is the
most recent case.
Legislatures around the world criticised Zuckerberg for
not attending − and refusing to be questioned by − a
committee on fake news and disinformation late in
2018.
14Share price (US$)
100
150
200
250
50
0
29/12/2017
Source: Bloomberg
19/01/2018
09/02/2018
02/03/2018
23/03/2018
13/04/2018
04/05/2018
25/05/2018
15/06/2018
06/07/2018
27/07/2018
17/08/2018
15
07/09/2018
28/09/2018
Facebook share price
19/10/2018
09/11/2018
30/11/2018
21/12/2018
11/01/2019
01/02/2019
22/02/2019
Graph 7: Facebook’s share price plummeted in July 2018 following the network’s privacy breach scandals
15/03/2019
05/04/2019
26/04/2019
17/05/2019
WINTER EDITION 2019
PERPETUA PERSPECTIVESPERPETUA PERSPECTIVES
WINTER EDITION 2019
(8%+), according to JP Morgan. This means the asset
class provides an ideal return to investors who seek
predictable, inflation-hedged, long-term cashflows with
low default rates. From a risk/return perspective,
infrastructure asset yields sit right in the middle of the
spectrum of yields offered by typical portfolio assets.
Empirical evidence shows that an already diversified
Mike Brooks investment portfolio can improve its Sharpe ratio from
Director: Perpetua Infrastructure
0.75 to 0.80 by allocating only 5% to infrastructure
assets.
Q&A: Perpetua’s alternative
investment offering How long has Perpetua been building its
alternative investment offering?
What is the investment case for alternative The relationships and pipeline opportunities we can
investments, especially for institutional offer clients today are the result of several years of the
investors? current individuals in the team having gained relevant
Alternative investments, particularly infrastructure investment experience and knowledge; having built
assets, offer investors stable, predictable, inflation- relationships; and more recently developing and fine-
linked, long-term cashflows. Pricing is determined tuning the offering.
primarily by the asset’s performance risk and the credit- Given the rapid rise in opportunities in both South
worthiness of the revenue stream. Alternative Africa and Africa, often as a result of government-led
investments offer returns with a low correlation to initiatives, we are now able to offer investors a well-
other asset classes, which makes the asset class a diversified pipeline of primarily operational
powerful tool for diversification. opportunities. These opportunities all have best-of-
The positive impact of infrastructure investment on breed technical and operational partners, performing at
GDP growth, social upliftment and the delivery of basic specified output levels, with offtake contracts (an
services is well documented. From an African agreement stipulating the buying/selling of the
perspective, the continent is poised for a substantial rise producer's future production) from credit worthy
in growth and investment. The natural resources that organisations or governments.
are being unlocked offer exceptional opportunities for
Alternatives is quite a broad asset class; do
considered investment. An example is the development
and commercialisation of the offshore gas discovery in you specialise in certain areas?
Northern Mozambique. According to Standard Bank, Yes. We focus on infrastructure assets. But within
this commercialisation will lead to an injection of $125 infrastructure, there is a wide variety of different
billion by way of capital expenditure over the course of opportunities. We therefore also consider clean and
the next 10 years – and this into a country with an renewable energy assets, as well as post-construction
annual GDP of $12 billion! Even the spinoff investment assets.
opportunities around servicing this construction Geographically, South Africa presents an opportunity to
project are immense. acquire post-construction assets, particularly in the
The United Nations estimates that Africa’s power renewable energy market. The rest of Africa also offers
sector is experiencing an annual investment shortfall of many opportunities. Our primary requirement when
$40-45 billion, based on the fact that achieving universal deciding where to invest is to only invest in countries:
access to electricity in Africa would require investment that offer credible, government-backed offtake
of about $55 billion per year until 2030. There are also agreements, or where the offtake is underwritten
substantial opportunities in utilities, communication, by an accessible international corporate balance
transport and social infrastructure (such as health sheet;
services). Globally, infrastructure investment earnings
where insurance and financial markets are
reflect a very low standard deviation of just over 2%
sufficiently developed;
when compared to real estate (4%+) and the S&P 500
where currency risk can be hedged; and
16PERPETUA PERSPECTIVES
WINTER EDITION 2019
where legal recourse is an option. influenced by a traditional, limited life fund structure.
The investment manager of Perpetua Infrastructure is
It is very encouraging to see how many African
Perpetua Investment Managers (PIM), resulting in the
investment destinations have developed and have
Manager being majority black-owned.
integrated robust, internationally accepted commercial
terms and enforceable legal protection. Perpetua Infrastructure intends to offer a series of
debenture issuances via listing these debentures on the
Do you have a dedicated team covering
JSE to facilitate raising debt and quasi-debt funding onto
alternatives? Can you tell us more about the its balance sheet. These debentures will be targeted at
experience of the team? institutional and liability-driven investors who are
Yes, we do have a specialist team. Some members of seeking quality, predictable, inflation-linked, long-term
the Perpetua Alternative Investment Committee (which cashflows to plug into their portfolios.
governs investment process and approvals within the
alternative investment offering) are however also To create an acceptable equity base upon which this
actively involved in the work of the listed markets funding can be achieved, redeemable participating
investment team. While the various research clusters preference shares in Perpetua Infrastructure will be
are focused on their respective areas of expertise offered/issued to select investment partners.
(domestic, global, equity, income, alternatives), we
think it is important that the discipline of Perpetua’s Where do you see the funds being invested
investment process pervades across all asset classes we over the next five years?
invest in. We have high expectations for this initiative, given our
individual track records, strategic partnerships and
I am championing the specialist alternative investment
relationships, rigorous investment process, advanced
team. Since 2008, I have been involved in founding and
pipeline of transactions, and management capacity.
managing a number of infrastructure investment
entities, including Inspired Evolution Investment We anticipate a spread of investments that would be
Managers, Africa Infrastructure Securities and Infrasec primarily in South Africa and neighbouring countries,
Fund Managers. My experience in private equity, with additional select holdings in appropriate regions
structured finance, treasury portfolio management, and elsewhere in Africa.
the full ambit of investment banking all help in evaluating
and structuring these complex, diverse and long-dated We feel it is important to also focus investments on
asset ownership relationships to the optimal benefit of areas within our expertise where there is a need to
investors. have a positive impact. As a result, the investments will
be weighted towards energy production, with an
Do you follow a similar research process as emphasis on clean and renewable energy. Strategic
you do for listed investments? focus will also be placed on the gas imperative and
Yes. The research process is similar in that it associated opportunities that we have in our pipeline of
incorporates fundamental research, environmental, early transactions. In addition, we have proprietary
social and governance (ESG) considerations, and risk opportunities in airports, water purification, harbours,
management. Given the specific characteristics of the technology and other key strategic infrastructure
asset class, the extent of the technical, legal and financial initiatives.
due diligence would however be different. When
required, we consult with external specialists.
In what form is alternative investments
available for investment?
Perpetua Infrastructure is as an open-ended, rand-
denominated company, domiciled in South Africa. We
believe the open-ended structure is fundamental to the
investment thesis. This is because the asset and
concomitant contracted cashflows are long dated, and
their overall yield predictability would be negatively
17PERPETUA PERSPECTIVES
WINTER EDITION 2019
“The Outsiders”, CEOs essentially have five reasons for
deploying capital:
1. Investing in existing operations
2. Acquiring other businesses
3. Issuing dividends
4. Paying down debt
5. Repurchasing stock
Phomolo Rabana
Equity Analyst An interesting point made in the book is that many
management teams are not very skilful at allocating
Explained: Share buybacks capital. The reason for this is that their rise through the
corporate ranks is usually due to their operational
In this issue of “Explained”, we discuss share buybacks. acumen, while one of the most important
What are they? Why do they matter? What are their responsibilities of a CEO involves capital allocation.
unintended consequences? When should they be done? This requires CEOs to shift from a purely operationally
focused mindset to thinking more as an investor.
A share buyback is when a company buys However, the transition can be challenging, since many
back some of its issued shares CEOs lack experience in capital allocation.
Share buybacks (or share repurchases) occur when
companies re-acquire a portion of their issued shares. Share buybacks are typically more flexible
Most companies can buy back a portion of their shares than dividend payments
every year, for example 5%. If a company wishes to Although share buybacks and dividends are similar as
repurchase a significantly greater portion of their shares they both result in a distribution of cash to
within a given year, they usually require shareholder shareholders, share buybacks can provide greater
approval. flexibility to management and shareholders:
Management can use share buybacks over the
Share buybacks are essentially a capital
short term to return cash to shareholders. As a
allocation decision that affects a company’s result, share buybacks are more unpredictable
earnings growth and valuation than dividend payments. In contrast, the market
In the first edition of “Explained”, included in the first has an inherent expectation that companies that
quarter 2019 edition of “Perpetua Perspectives”, we pay a dividend will continue to do so. Management
discussed the fundamental basis for determining a price- is therefore usually reluctant to reduce dividend
earnings (PE) multiple. We highlighted that dividends payments or stop paying dividends, since this could
and earnings growth tend to be steady contributors to be viewed negatively by the market.
equity returns over long periods of time, but that the For shareholders, share buybacks allow them to
price the market is willing to pay for future earnings control when they pay taxes, since only taxable
tends to vary considerably in the shorter term. investors who decide to sell their shares would be
The first part of this statement implies that in the long liable to pay tax. With dividends, taxable investors
term, a company’s management team plays a key role in have no choice but to pay tax when the dividend is
determining the company’s value and, indirectly, its PE distributed.
ratio. This is because management’s capital allocation Since share buybacks can be viewed as
decisions have a significant long-term impact on how market manipulation, they are governed by
fast earnings grow, the sustainability of those earnings,
legislation
and how much of those earnings can be paid out in the
form of dividends. Since share buybacks influence a company’s share price
and are carried out by insiders (i.e. company
To this end, share buybacks represent a management management), this practice can be viewed as a form of
capital allocation decision that can either enhance or market manipulation. (The CFA Institute defines
diminish a company’s value, and, in turn, shareholder market manipulation as practices that distort prices or
value. That is why share buybacks must be considered artificially inflate trading volume with the intent to
and evaluated within the broader capital allocation mislead market participants.) Explicit provisions have
framework. As mentioned in William Thorndike’s book therefore been made in legislation to allow companies
18You can also read