Petrophysical Texture Heterogeneity of Vesicles in Andesite Reservoir on Micro-Scales
←
→
Page content transcription
If your browser does not render page correctly, please read the page content below
Journal of Earth Science, Vol. 32, No. 4, p. 799–808, August 2021                                                        ISSN 1674-487X
Printed in China
https://doi.org/10.1007/s12583-021-1409-z

    Petrophysical Texture Heterogeneity of Vesicles in Andesite
                    Reservoir on Micro-Scales
                         1
       Mutian Qin            , Shuyun Xie *1, Jianbo Zhang2, Tianfu Zhang3, Emmanuel John M. Carranza4,
                                                  Hongjun Li5, Jiayi Ma1
            1. State Key Laboratory of Geological Processes and Mineral Resources (GPMR), School of Earth Sciences,
                                       China University of Geosciences, Wuhan 430078, China
           2. School of Geography and Information Engineering, China University of Geosciences, Wuhan 430074, China
                         3. PetroChina Hangzhou Institute of Petroleum Geology, Hangzhou 310023, China
                         4. Geological Sciences, School of Agricultural, Earth and Environmental Sciences,
                                      University of KwaZulu-Natal, Westville 3629, South Africa
                    5. Dagang Oilfield Company, China National Petroleum Corporation, Tianjin 300280, China
             Mutian Qin: https://orcid.org/0000-0002-8649-0658; Shunyun Xie: https://orcid.org/0000-0002-7443-6486

            ABSTRACT: It is of great significance to study the spatial distribution patterns and petrophysical com-
            plexity of volcanic vesicles which determine whether the reservoir spaces of the volcanic rocks can accu-
            mulate oil and gas and enrich high yields or not. In this paper, the digital images of three different textures
            of vesicular andesite samples, including spherical vesicular andesite, shear deformation vesicular ande-
            site, and secondary filling vesicular andesite, are obtained by microscopic morphology X-CT imaging
            technology. The spatial micro-vesicle heterogeneity of vesicular andesite samples with different textures
            is quantitatively analyzed by fractal and multifractal methods such as box-counting dimension and the
            moment method. It is found that the shear stress weakens the spatial homogeneity since vesicles rupture
            are accelerated, elongated directionally, and connected with one another under the strain; the secondary
            filling breaks the vesicles, which significantly enhances the spatial heterogeneity. In addition, shear stress
            and secondary filling increase the complexity of vesicle microstructures characterized by different fractal
            and multifractal parameters. These conclusions will provide important theoretical and practical insights
            into understanding the degassing of volcanic rocks and prediction of high-quality volcanic reservoirs.
            KEY WORDS: volcanic vesicles, fractal and multifractal, microscopic morphology, heterogeneity, X-CT
            imaging.

0    INTRODUCTION                                                     in magma degassing process through 2D images analysis
      The decompression during volcanic eruption caused mas-          (Giachetti et al., 2010; Blower et al., 2003, 2001; Klug et al., 2002).
sive degassing of magma and the formation of vesicles during                X-ray computed microtomography (CT) is a non-destructive
the process of diagenesis (Davydov, 2012). With the release of        method for imaging textures, which has been demonstrated to be
gas, vesicles in magma nucleated and grew. The density, size          of great potential in the study of quantifying spatial distribution
distribution and morphology of vesicles may be further modified       patterns and size frequency distribution of 3D vesicles (Rahner
by coalescence, growth or deformation (Boichu et al., 2008;           et al., 2018). Papale et al. (1998) first used XRCMT to study the
Papale et al., 1998; Cashman and Mangan, 1994). These vesicles        vesicular structure of Hawaiian basalts, and then 3D imaging
in frozen volcanic rocks record the degassing processes in mag-       technology was widely used to study the vesicular space of vol-
mas. Therefore, it is valuable to study the characteristics of ves-   canic rocks (Pistone et al., 2015; Shields et al., 2014; Baker et
icles by characterizing the conditions of magma storage, rise and     al., 2012; Degruyter et al., 2009).
eruption (Spina et al., 2019; Le Gall and Pichavant, 2016). Quan-           Fractal and multifractal are considered as effective means
titative analysis and interpretation of volcanic vesicles have been   to describe irregular objects, which can quantitatively describe
regarded as an important topic of volcanology, and a lot of work      the spatial distribution, heterogeneity and structural complexity
has been focused on density and distribution of volcanic vesicles     of the target objects, which can be either a tiny pore body (Wang
                                                                      et al., 2019; Xia et al., 2019; García-Gutiérrez et al., 2017) or a
*Corresponding author: tinaxie@cug.edu.cn                             large geological activity (Yin et al., 2019; Lyu et al., 2017; Yang
© China University of Geosciences (Wuhan) and Springer-Verlag         et al., 2016; Turcotte, 1989). For oil and gas reservoirs, in recent
GmbH Germany, Part of Springer Nature 2021                            years, fractal and multifractal methods have been regarded to be
                                                                      of obvious advantages in the quantitative characterization of the
Manuscript received August 23, 2020.                                  complex microstructure and heterogeneity of pore spaces
Manuscript accepted December 27, 2020.                                which greatly affect the migration mechanism of reservoir (Cai

Qin, M. T., Xie, S. Y., Zhang, J. B., et al., 2021. Petrophysical Texture Heterogeneity of Vesicles in Andesite Reservoir on Micro-
Scales. Journal of Earth Science, 32(4): 799–808. https://doi.org/10.1007/s12583-021-1409-z. http://en.earth-science.net
800                     Mutian Qin, Shuyun Xie, Jianbo Zhang, Tianfu Zhang, Emmanuel John M. Carranza, Hongjun Li and Jiayi Ma

et al., 2018).
      Krohn (1988) discussed the feasibility of fractal method in
characterization of 2D microstructure of sandstone, carbonate
rock and shale. Xie et al. (2010) systematically characterize the
micro pore structure of carbonate reservoir through fractal and
multifractal methods, and considered that corresponding param-
eters can effectively describe the spatial distribution of mi-
cropores. Further combined with micro reservoir analysis meth-
ods, such as high-pressure mercury injection (Liu et al., 2020;
Wang et al., 2018; Li et al., 2017; Ferreiro et al., 2010), gas ad-
sorption (Yang et al., 2014; Clarkson et al., 2013), NMR (Ge et
al., 2015), fractal analysis has been widely utilized in the study
of reservoir microstructures (Zhou et al., 2021; Lai et al., 2018).
      In general, natural pores, vesicles in volcanic rocks tend to
have larger volume and wider throat than those in tight sand-
stones and shale. Therefore, the study on the density, size distri-
bution and textures of volcanic vesicles is of great significance
for the development and prediction of high-quality volcanic res-
ervoirs (Barreto et al., 2017; Colombier et al., 2017; Wright et
al., 2009). In this paper, fractal and multifractal methods are used
to quantitatively characterize the different textures of vesicular
andesite reservoir samples, to understand the development dy-
                                                                         Figure 1. Schematic diagram of sampling location of volcanic rocks in
namics of volcanic vesicles from a new perspective, which will
                                                                         Wangguantun area, Kongdong oil and gas sag, Huanghua depression (accord-
provide a basis for the degassing of volcanic lava and the predic-
                                                                         ing to Zheng and You, 2019).
tion of high-quality reservoirs.

1    SAMPLE COLLECTION AND PROCESSING                                         The same method was used to segment each group of im-
      Huanghua depression is located in the center of Bohai Bay          ages to obtain the binary image of pores and rock skeleton sepa-
Basin, with a total area of 1.7×10⁴ km2, which is a secondary            ration, and then the image set of 900×900×900 pixels was taken
negative structural unit in Bohai Bay Basin and is adjacent to           from each sample, and noise reduction was carried out at the
Yanshan fold belt in the north, Linqing depression in the south,         same time. We took a 1.44 cm×1.44 cm×1.44 cm cube column
Chengning uplift in the East and Cangxian uplift in the West.            for each sample to carry out 3D reconstruction and fractal and
Huanghua depression, which is also an important exploration              multifractal calculation for each sample.
area in the Bohai Bay Basin, is generally in NNE trending. Sev-
eral hundred tons of Mesozoic volcanic wells have been discov-           2   SAMPLE CHARACTERISTICS
ered and explored in this area. The reservoirs are mainly lava,                Figure 2 shows the mineralogical characteristics of three
pyroclastic rocks and pyroclastic sedimentary rocks, and ande-           samples by microscopical observation (Figs. 2a–2c). Three sam-
site is one of the most important lava reservoirs (Zheng and You,        ples are all vesicular andesites with the matrix composed of pla-
2019). The sampling area of the three volcanic rocks is located          gioclase microcrystalline and volcanic glass, which are interwo-
in Wangguantun area, Kongdong oil and gas sag, Huanghua de-              ven with each other. The phenocrysts are all amphibole with ob-
pression as shown in Fig. 1. As is indicated in previous studies,        vious darkening.
the three samples are located in different areas of the lava effu-             The micrograph of the casting thin sections and digitized
sion region, with different pore evolution forms. The round ves-         images of each 2D CT slice of three samples were taken from
icles, shear-deformed vesicles and secondary filled vesicles were        different fields of view, showing the microstructural characteris-
formed under stable degassing conditions in samples W41-1, W6            tics (Figs. 3a–3c) and planar distribution of vesicles (Figs. 3d–
and G177, respectively. The three samples are selected to ex-            3f). 3D models were reconstructed, as shown in Figs. 4a–4c,
plore the development processes and distribution characteristics         showing the distribution of 3D vesicles. Obviously, the pore
of high-quality igneous reservoirs in effusive andesites which           spaces of the three samples are mainly composed of vesicles
will facilitate the oil and gas assessment.                              (Figs. 3a–3c), but they show different pore evolution patterns
      In order to extract the 3D images of samples, the computer         due to their location in different parts of the lava area (Farquhar-
tomography scanner was used to carry out X-ray radiation imaging         son et al., 2015).
on the rock pillars. In this experiment, a rock pillar with a diameter         Huge vesicles of nearly elliptical shape are developed in
of 2.5 cm and a length of 3.0 cm for each sample was cut and used.       Sample W41-1 (Fig. 3a), which indicates that the degassing pro-
The scanner was perpendicular to the long axis of the pillar and         cess of magma remained relatively stable during the formation
the image of 16 μm resolution was read according to a certain layer      of vesicles (Namiki and Manga, 2006). The sizes of the vesicles
thickness (distance). The images were composed of various gray           are highly differentiated, and vesicles dispersed only some small
levels representing different X-ray density units. Light color rep-      vesicles gathered (Figs. 3d and 4a). Some large vesicles in Sam-
resents rock skeleton and black represents pore spaces.                  ple W6 are sheared and elongated, some of which are merged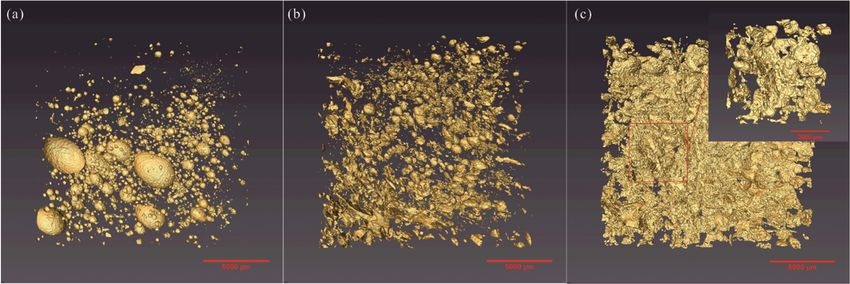
Petrophysical Texture Heterogeneity of Vesicles in Andesite Reservoir on Micro-Scales                                                                            801

(Fig. 3b), which means that the andesite lavas in the region are                      3 FRACTAL AND MULTIFRACTAL ANALYSIS
subjected to shear stress, which may be located in a stress trans-                    3.1 Box-Counting Fractal Model
formation zone (Kushnir et al., 2017). Some small pores were                               The gray-scale image is binarized into separate vesicle and
formed due to the rupture of the vesicles (Figs. 3b and 3e). Ves-                     matrix pixels, and the number of lattices containing vesicle pix-
icles of G177 also underwent shear deformation and connection,                        els (N) is counted by changing the scale (ε). Under the double
and extensive secondary filling was developed (Fig. 3c). The                          logarithmic coordinate axis, the scale size (ε) and the number (N)
vesicles were filled and broken with more micropores (Figs. 3f                        scatter diagram are plotted (Xie et al., 2010; Mandelbrot, 1977).
and 4c).
      The quantitative analysis of images and the establishment                                       lim                                                         (1)
                                                                                                        →
of the 3D pore model was completed by ImageJ and Avizo soft-
                                                                                           For calculation, the box can be square or round, cubic or
ware (Houston et al., 2017; Prodanović et al., 2007). The poros-
                                                                                      spherical. In this paper, we can cover the space with a square of
ity of Sample W41-1, W6 and G177 is 1.94%, 1.96% and 6.27%,
                                                                                      ε and gradually reduce the size of it for 2-Dimensional analysis,
respectively, which were obtained by digital image calculation.
                                                                                      and cover the CT columns with a cubic of size (ε) and gradually
Through statistical analysis of pore parameters, the regularity of
                                                                                      reduce the size of it for 3-Dimensional pore analysis. The ad-
micro pore structure is explored to provide new information for
                                                                                      vantage of using the square lattice is that the calculation of the
reservoir evaluation.

Figure 2. Mineralogical characteristics shown in micrographs of rock thin sections. (a) W41-1, the matrix is of a vitreous interwoven structure, mainly composed
of plagioclase microcrystalline and volcanic glass, with a small amount of dark amphibole phenocrysts; (b) W6, the matrix is mainly composed of plagioclase
microcrystalline and volcanic glass, and amphibole phenocrysts show obvious alteration; (c) G177, the matrix is composed of plagioclase distributed in a disor-
dered semi-directional way, with a small amount of altered pyroxene distributed.

Figure 3. Micrographs of the casting thin sections ((a), (b), (c)) and digitized images ((d), (e), (f)) of the CT 2D slices. (a) W41-1, large vesicle; (b) W6, Shear
deformed vesicles; (c) G177, vesicles with partial filling; (d) W41-1, differentiation of vesicle size; (e) W6, vesicles with shear deformation and rupture; (f) G177,
complex vesicle structure.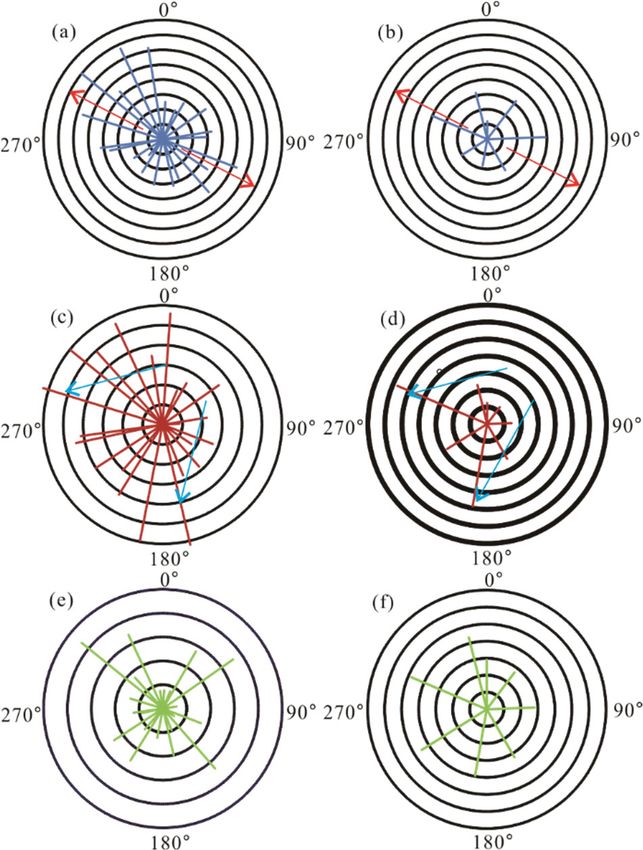
802                       Mutian Qin, Shuyun Xie, Jianbo Zhang, Tianfu Zhang, Emmanuel John M. Carranza, Hongjun Li and Jiayi Ma

Figure 4. 3D vesicle reconstruction of micro CT images for andesite reservoir rock. (a) W41-1, vesicles were different in size and distributed discretized; (b) W6,
vesicles present directional deformation; (c) G177, vesicles were partially filled and the structure became extremely complex.

square N(ε) is simpler, and the number of boxes is equal to its                      as shape factors and elongation parameters.
covering number.                                                                          2D shape factor is denoted as F and the 3D shape factor as
                                                                                     FF (Mongrain et al., 2008; Manga et al., 1998; Orsi et al., 1992).
3.2   The Method of Moments
                                                                                                                                                               (6)
     Since the dimension spectrum function had been put for-
ward (Halsey et al., 1987), there are many calculation methods
                                                                                                                                                               (7)
and the moment method is recommended widely (Zhou et al.,
2019; Xie et al., 2010). Firstly, the distribution function χ(q,δ) is                     In Eq. (6), P is the perimeter and S the area of the 2D pores.
defined as the quantity representing the degree of multifractal                      In Eq. (7), A, the surface area and V, the volume of the 3D pores.
heterogeneity (Tarquis et al., 2009).                                                Usually, the closer F is to 1, the rounder the pore shape is, and
                                                                                     the smaller the value is, the more complex the 2D pore structure
           ,                                                               (2)
                                                                                     is. FF is different from F. The closer FF is to 1, the closer the
where mi represents the number of pixels circled in the box and M                    pore is to the sphere. The more complex the pore is, the higher
represents the total number of pixels. When the moment q>0, χ(q,δ)                   the FF value is.
reflects the property of high μi region, highlighting the character-                      The 2D elongation is denoted as E.
istics of large pore spaces; otherwise, when q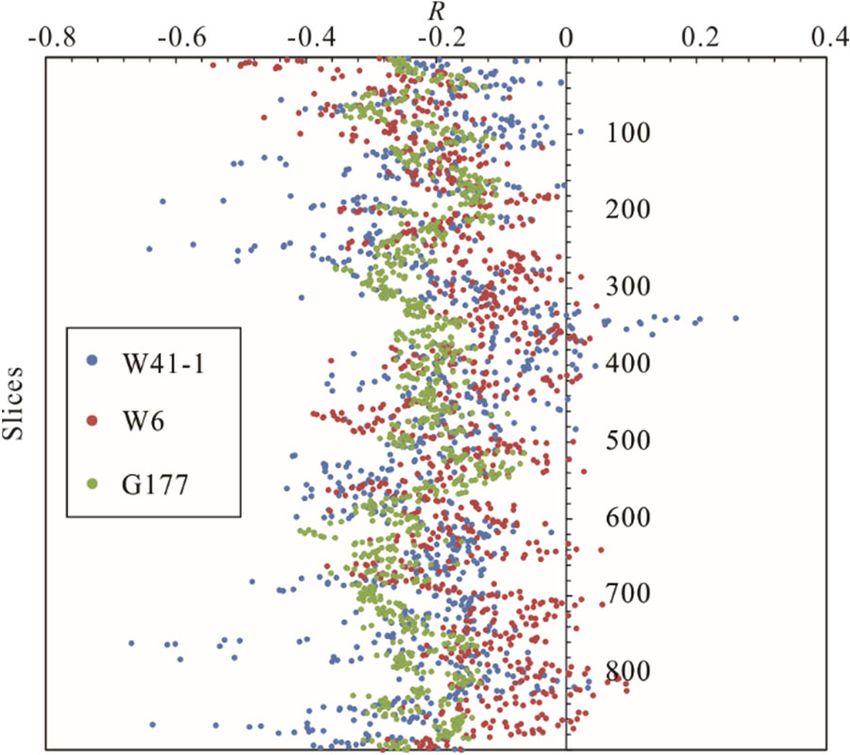
Petrophysical Texture Heterogeneity of Vesicles in Andesite Reservoir on Micro-Scales                                                                    803

                                      Table 1 Shape parameters of vesicle groups in 2D and 3D with different partitions

               Parameter                      Sample   Area/volume ≥0%       Area/volume ≥25%       Area/volume ≥50%       Area/volume ≥75%

                                                         2D         3D         2D          3D         2D         3D          2D         3D
               Area/volume fraction (%)       W41-1    100.00     100.00      99.61      99.97       97.43      99.87      89.89       98.83

                                               W6      100.00     100.00      99.34      99.96       96.60      99.74      87.07       98.60

                                              G177     100.00     100.00      99.29      99.96       95.87      99.82      83.70       98.98
               F/FF                           W41-1    0.901 5    1.162 2    0.875 3    1.365 2     0.857 3    1.532 9    0.835 9     1.492 2

                                               W6      0.814 1    1.938 5    0.762 2    2.394 6     0.693 1    2.987 4    0.643 8     4.098 4

                                              G177     0.709 4    3.643 4    0.633 3    4.544 8     0.516 5    6.084 7    0.399 7    10.171 0
               E/EE                           W41-1    0.142 5    0.565 4    0.137 2    0.607 3     0.117 2    0.633 1    0.108 3     0.758 4

                                               W6      0.239 0    0.447 6    0.252 8    0.462 2     0.284 4    0.436 1    0.266 9     0.442 8

                                              G177     0.292 6    0.491 5    0.322 0    0.473 7     0.369 0    0.433 3    0.370 5     0.400 3

Figure 5. Line charts of shape parameters of vesicle groups in 2D and 3D with different quantiles. (a) 3D shape factor FF; (b) 3D elongation factor EE; (c) 2D
shape factor F; (d) 2D elongation factor E.

significantly in different vesicle groups (Fig. 5).                               necessary to select appropriate vesicle group as the target. We se-
     Specifically, the average FF of the first 25% vesicles of W6                 lected the 2D vesicles with the first 50% of the area and the 3D
sample is higher than that of all the vesicles of G177, but lower                 vesicles with the first 25% of the volume as the research objectives.
than that of the first 75%, 50% and 25% vesicles of G177 sample                   These vesicles occupy more than 95% of the total volume (area)
(Fig. 5a). For 2D slices, the average F of all vesicles of G177 is                (Table 1), which can represent the main characteristics of vesicles.
higher than that of 50% and 25% of vesicles than W6 (Fig. 5c).                          Among them, Sample W41-1 vesicles have the smoothest
     The deformation of vesicles is also obvious. The variation                   edge and the simplest structure, indicating that the volcanic ves-
of 2D and 3D vesicle elongation of different vesicle groups is                    icles were formed under slow decompression (Namiki and
disordered. The EE of the first 50% vesicles and the first 25%                    Manga, 2006), and their shapes were nearly spherical. Vesicles
vesicles of W6 is higher than the first 50% and the first 25%                     in W6 has a more complex structure and higher elongation ratio
vesicles of G177, but the situation is different in the first 75%                 than vesicles in W41-1, which indicates that the vesicles under-
and the first 100% pores (Fig. 5b).                                               went shear deformation, coalescence and rupture (Okumura et
     In order to accurately characterize the texture of vesicles, it is           al., 2016, 2008; Degruyter et al., 2009). In addition, due to the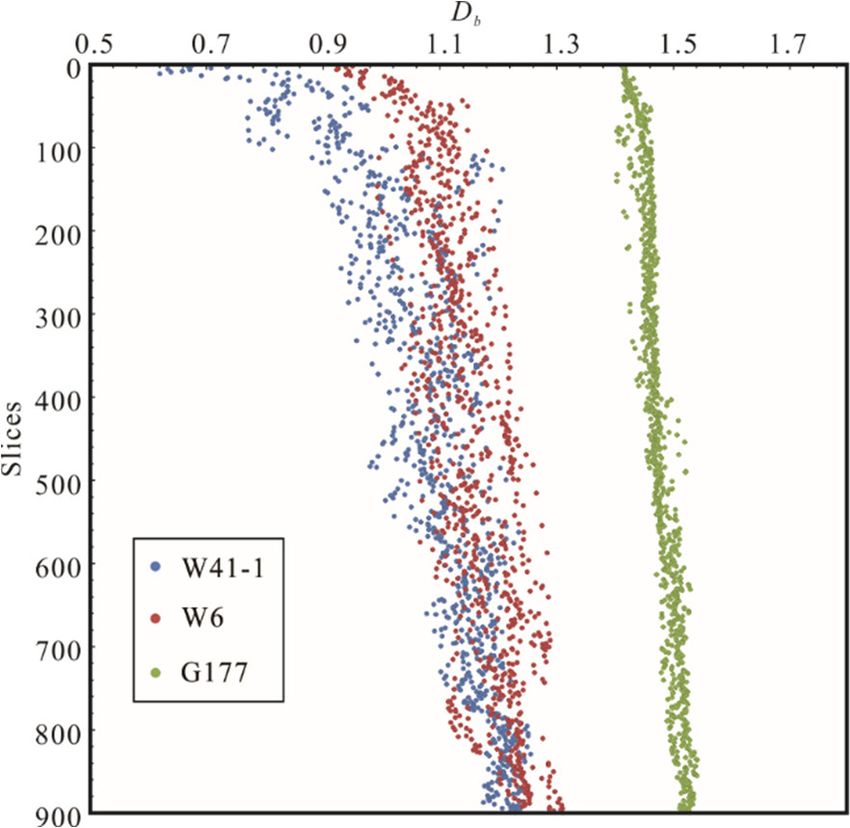
804                     Mutian Qin, Shuyun Xie, Jianbo Zhang, Tianfu Zhang, Emmanuel John M. Carranza, Hongjun Li and Jiayi Ma

influence of partial filling, FF of G177 was significantly higher
than that of others, indicating that the vesicles were broken and
the structure became extremely complex.
      We also found larger vesicles have lower FF and higher F
(Figs. 5a and 5c). It is worth mentioning that the shape factor of
W41-1 does not change much, but changes obviously in W6 and
G177. Since the larger vesicle bodies of W6 and G177 are
mainly of deformation and partial filling vesicles, the difference
of pore structure morphology between large and small pores is
huge, which leads to significant differences in shape parameters.
      In addition, the larger EE in W41-1 3D vesicles indicates
that the larger vesicles are closer to the sphere shape with lower
elongation ratios. However, the EE of W6 and G177 decreased
with the increase of the vesicle volumes, implying that the shear
deformation of the larger vesicles is more obvious than that of
the small vesicles. This tendency is also shown in the 2D aspect.
The first 50% and the first 25% vesicle groups show higher E
values (Figs. 5b and 5d).

4.2    3D-Vesicle Direction Patterns
      Figure 6 shows the rose diagram of the first 25% 3D vesi-
cles direction calculated by Avizo software (Table 1). These 25%
vesicles can reflect the overall characteristics of the vesicles and
avoid the influence of micro pores. The direction of vesicles is
determined by two parameters, elevation φ (0–90°) and azimuth
θ (0–360°). In this paper, elevation φ is divided into two groups,
                                                                         Figure 6. Rose diagrams of 3D vesicles orientation. (a) φ≥45°, the azimuth θ
φ≥45° and φ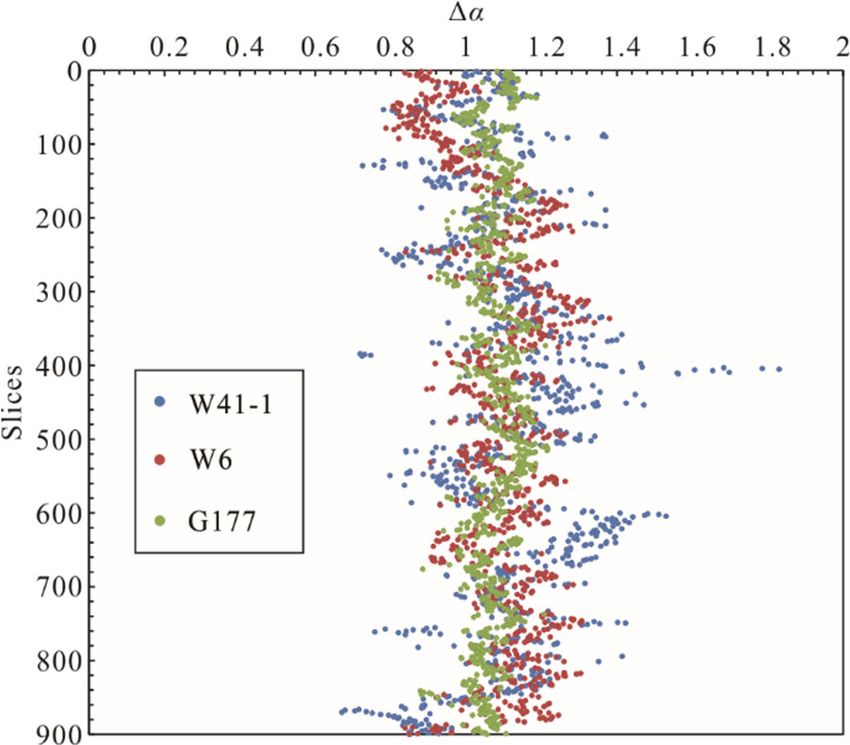
Petrophysical Texture Heterogeneity of Vesicles in Andesite Reservoir on Micro-Scales                                                                805

change in Dbs in 900 slices. In the two-dimensional scale, the            W41-1, W6 and G177 have higher Db, which is due to the defor-
vesicular structure of W6 has higher Db than that of W41-1 sam-           mation, fracture and coalescence of vesicles caused by shear
ple with the same porosity, but the difference is small, which in-        strain. Moreover, partial filling can break the original vesicle
dicates that shear deformation can complicate the vesicle struc-          space and make the microstructure extremely complex.
ture, although the effect is limited. The Db of G177 is obviously               Compared with 2D Db, 3D Db has a higher distinction be-
different from W41-1 and W6, which indicates that mineral fill-           tween W41-1 and W6 (Tables 2 and 3). 2D slices only contain
ing has a more obvious effect on the microstructure of vesicles           plane information of vesicles structure, while 3D data are the su-
than shear deformation in the two-dimensional space.                      perposition of 2D information, which can more accurately de-
                                                                          scribe the characteristics of vesicle microstructure and show the
4.3.2 Multifractal characteristics                                        differences of different vesicle structure.
      The heterogeneous properties of vesicle system reflect the
process of degassing and nucleation of vesicles to some extents,          4.4.2 Multifractal characteristics
and also affect the migration mechanism of vesicular volcanic                   According to the multifractal analysis method, the plot of
rock reservoir. To some extent, the heterogeneity of pore distri-         f(α) vs. α to represent the 3D multifractal spectrum characteris-
bution in porous media affects the connectivity and permeability          tics of the vesicle structure is obtained (Fig. 10). The multifractal
of pore structure (Chen et al., 2017). The multifractal method is
used to quantitatively characterize the multi-dimensional spatial
heterogeneity of volcanic vesicles with different textures, which
enhances the characterization of spatial distribution pattern of
volcanic vesicles. At the same time, the evolution process of ig-
neous rock vesicles is dynamic, so the study of vesicle heteroge-
neity can offer new ideas for the analysis of magma degassing
evolution and volcanic reservoir prediction.
      According to the calculation method of multifractal dimen-
sion, the statistical order q of multifractal moment method is se-
lected in the range of [5-5], and the 2D multifractal parameters
of the sample vesicle structure are obtained by covering the 2D
pore space with boxes of different scales.
      Table 2 shows the 2D multifractal parameters, where
Δα=ΔαL+ΔαR is the width of multifractal singular spectrum, re-
flecting the spatial differentiation degree of irregular aggregates
under different measures. The larger the Δα of vesicle system is,
the more inhomogeneity its distribution is, which often indicates                Figure 8. Distribution of Δα of 2-D vesicles on different slices.
lower permeability (Chen et al., 2017). Since ΔαL and ΔαR, the
width of the left and the right part of the multifractal singular spec-
trum, show the difference between relatively larger and smaller
vesicles. And thus R=(ΔαL–ΔαR)/Δα, is used to reflect the asym-
metry of multifractal spectrum curve and then to describe the dif-
ferentiation degree of large vesicles and small vesicles.
      It is found that the Δα values of W6 and G177 are lower
than that of W41-1, which indicates that the 2D vesicles of W6
and G177 have lower heterogeneity. The asymmetry index R is
negative, indicating that vesicles (pores) are differentiated in the
slices and micro vesicles (pores) are dominant.
      Figures 8 and 9 show the distribution of 2D fractal param-
eters on different slices. The multifractal spectrum width Δα and
the asymmetry index R have great changes on different slices,
indicating that there are obvious differences in the characteristics
of 2D slices at different positions of the same vesicle system. In
addition, the multifractal parameters of G177 have the smallest
difference among different slices, while those of W41-1 param-
                                                                                 Figure 9. Distribution of R of 2-D vesicles on different slices.
eters have the largest variation range and those of W6 are be-
tween the two samples.
                                                                            Table 3 Fractal and multifractal parameters describing the 3D vesicles

4.4 Fractal and Multifractal Distribution Patterns of 3D                    Sample          Db          Δα           ΔαL         ΔαR            R
Vesicles                                                                    W41-1         2.147 3     2.815 0      1.406 6      1.406 6      -0.000 6
4.4.1 Fractal characteristics                                               W6            2.427 2     2.265 2      1.039 9      1.216 5      -0.078 3
     Table 3 lists the 3D Db of the three samples. Compared with            G177          2.631 8     2.440 6      0.747 2      1.692 3      -0.387 4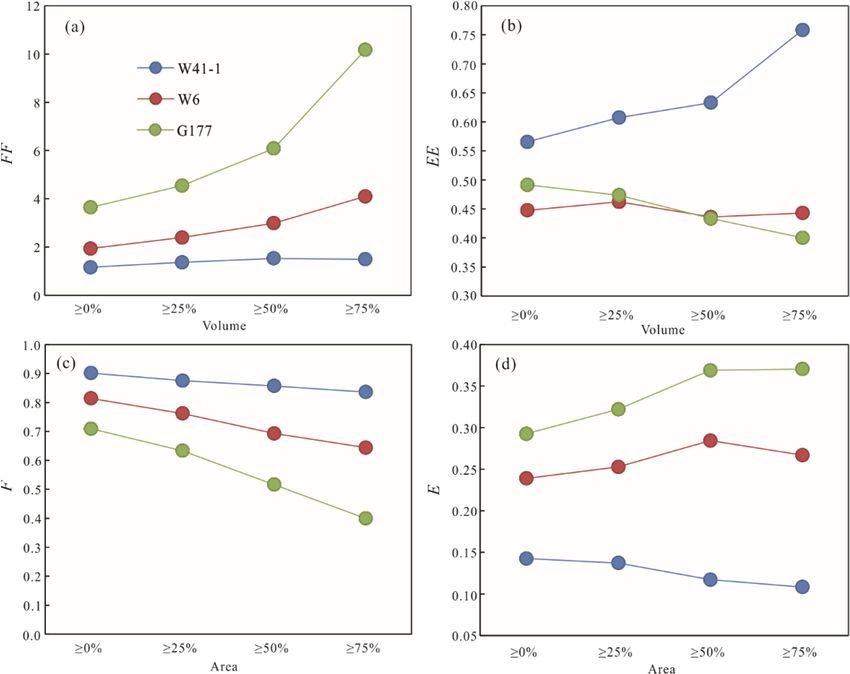
806                         Mutian Qin, Shuyun Xie, Jianbo Zhang, Tianfu Zhang, Emmanuel John M. Carranza, Hongjun Li and Jiayi Ma

spectrum of the three samples shows typical right partial contin-                   heterogeneity different (Tables 2 and 3).
uous spectrum distribution pattern, which further reflects the
spatial heterogeneity of the samples (Fig. 10). It is obvious that                  5    CONCLUSIONS
indeed all of the 3D vesicle networks analyzed of the three an-                           (1) Both 2D and 3D vesicles in andesite are of fractal and
desite samples have multifractal geometries.                                        multifractal characteristics. The fractal dimension and multifrac-
      The Δα value of 3D vesicles of W41-1 sample is higher than                    tal parameters of 3D vesicle structure extracted in this paper
that of W6 (Table 3), reflecting that the spatial distribution of                   quantitatively characterized the microstructure and spatial heter-
W41-1 vesicles is highly heterogeneous, because the process of                      ogeneity of spherical vesicles, shear deformation vesicles and
small vesicles gathering to form large vesicles makes the spatial                   partial filling vesicles with obvious differences in parameters.
distribution of vesicles more chaotic, which is consistent with                     The 2D fractal dimension is effective to characterize the micro-
the characteristics of 2D slices. The vesicles in Sample W6 are                     structure of partial filling vesicles and primary vesicles, but it is
deformed, elongated and connected due to shear strain, forming                      limited to differentiate the spherical vesicles and shear defor-
a directional arrangement similar to tubular pumice, and the het-                   mation vesicles. Moreover, 2D multifractal parameters are use-
erogeneity is reduced. Generally speaking, the connectivity and                     ful to characterize the spatial heterogeneity of spherical vesicles
permeability of volcanic vesicles after shear deformation are en-                   and shear deformation vesicles, although there are recognizable
hanced (Farquharson et al., 2016). On the other hand, the perme-                    differences between different slices.
ability of vesicles with similar extension direction is better than                       (2) The parameters can be recommended to analyze the dy-
that of the pore throat system with high structural complexity.                     namic evolution of andesite reservoir rocks. Noticeable differ-
(Lai et al., 2018; Kushnir et al., 2017; Pistone et al., 2017; Vona                 ences were found in microstructure and spatial heterogeneity of
et al., 2016; Degruyter et al., 2009).                                              different textures of vesicular andesite. W41-1 belongs to vesic-
      The 3D multifractal spectrum width Δα of G177 is between                      ular andesite formed under stable degassing. The size of the ves-
W41-1 and W6, which indicates that shear deformation reduces                        icles is obviously different and its distribution is disorderly with
the heterogeneity of the original vesicle space distribution, while                 higher 3D Δα values and the strongest heterogeneity. Vesicles in
the filling effect makes the vesicles broken, the spatial distribu-                 W41-1 own the simplest microstructure with the lowest 3D Db
tion becomes complex and the heterogeneity is enhanced.                             value. Once these smooth and huge vesicles are connected, high
      The asymmetry index R of the 3D multifractal spectrum of                      quality reservoir space will be established. Thus, the stable de-
W6 is slightly lower than that of W41-1, indicating that the smaller                gassing magma belt is of great potential for reservoir formation.
vesicles have a higher bulk density. This is due to the formation of                W6 belongs to vesicular andesite formed by shear stress during
micro pores due to the rupture of vesicles under shear strain, and                  the degassing process of magma. After shear deformation, frac-
the larger vesicles are easier to gather and connect under shear de-                ture and connection, the microstructure complexity of vesicles is
formation, which further decreases the density of large vesicles                    slightly improved (3D Db is 2.427 2), but it still has relatively
(Okumura et al., 2008). The multifractal spectrum of G177 is                        smooth and wide pore-throat structure. The vesicles are arranged
strongly right biased, and correspondingly the asymmetry index R                    orderly and the heterogeneity is weaker with 3D Δα of 2.265).
reaches -0.387 4, indicating well that the differentiation degree                   Compared with the stable degassing vesicular volcanic rocks,
of larger vesicles and small vesicles is relatively smaller.                        vesicular volcanic rocks subjected to shear deformation are of
      We found that the 2D and 3D Δα can effectively characterize                   higher potential connectivity and permeability. The vesicles of
the heterogeneity of W41-1 and W6. For the complexly recon-                         G177 have been broken by partial filling, and the 2D and 3D Db
structed vesicle space such as G177, due to the limited information                 are much higher than those of W41-1 and W6, indicating the mi-
contained in the 2D slices, the shape and spatial distribution of the               crostructure of G177 is extremely complex. Although the vesi-
vesicles are ignored, which makes the 2D heterogeneity and 3D                       cles have undergone directional deformation and the heteroge-
                                                                                    neity has been reduced, the heterogeneity is still stronger than
                                                                                    W6 due to the fragmentation of these broken vesicles. In this way,
                                                                                    partial filling can reduce the reservoir performance of vesicular
                                                                                    andesite reservoir. It is clear that classical measures with tradi-
                                                                                    tional porosity parameters alone were insufficient to distinguish
                                                                                    differences in micro-vesicle structures from images of different
                                                                                    heterogeneity. However, such differences could be detected from
                                                                                    comparisons of multifractal spectrum parameters. Finally, we
                                                                                    found Δα and Db values provided the most sensitive measure of
                                                                                    changes in micro-vesicle morphology.

                                                                                    ACKNOWLEDGMENTS
                                                                                         This study was jointly supported by the Natural Science
                                                                                    Foundation of China (No. 41872250). The project was also sup-
                                                                                    ported by PetroChina Dagang Oilfield Company “Study on Ig-
                                                                                    neous Rock Distribution and Reservoir Prediction in Dagang Ex-
Figure 10. Multifractal spectrum function f(α) curves of 3-D vesicle distribution   ploration Area” (No. DGTY-2018-JS-408) and China National
Patterns.                                                                           Petroleum Corporation Major Science and Technology Program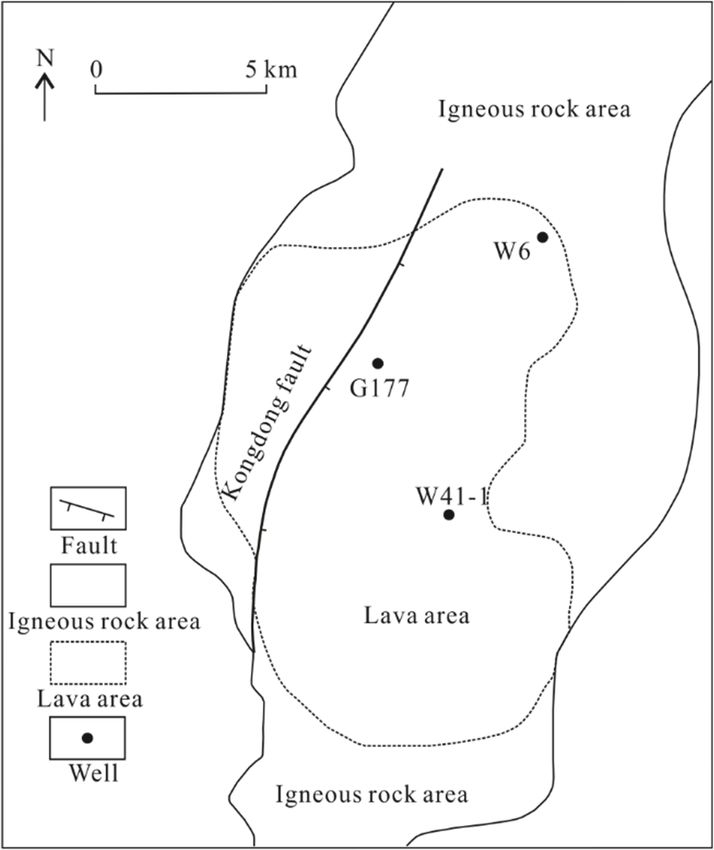
Petrophysical Texture Heterogeneity of Vesicles in Andesite Reservoir on Micro-Scales                                                                                    807

“Research and Application of Key Technologies for Increasing                              Farquharson, J. I., Heap, M. J., Baud, P., 2016. Strain-Induced Permeability
Efficiency, Storing and Stabilizing Production in Dagang Oil-                                  Increase in Volcanic Rock. Geophysical Research Letters, 43(22):
field” (No. 2018E-11). The final publication is available at                                   11603–11610. https://doi.org/10.1002/2016gl071540
Springer via https://doi.org/10.1007/s12583-021-1409-z.                                   Farquharson, J., Heap, M. J., Varley, N. R., et al., 2015. Permeability and
                                                                                               Porosity Relationships of Edifice-Forming Andesites: A Combined
REFERENCES CITED                                                                               Field and Laboratory Study. Journal of Volcanology and Geothermal
Agterberg, F. P., 2001. Multifractal Simulation of Geochemical Map Patterns.                   Research, 297: 52–68. https://doi.org/10.1016/j.jvolgeores.2015.03.016
     Geologic        Modeling       and       Simulation,       26(2):      142–151.      Ferreira, T. R., Pires, L. F., Wildenschild, D., et al., 2018. X-Ray Microtomography
     https://doi.org/10.1007/978-1-4615-1359-9_17                                              Analysis of Lime Application Effects on Soil Porous System. Geoderma, 324:
Baker, D. R., Mancini, L., Polacci, M., et al., 2012. An Introduction to the Appli-            119–130. https://doi.org/10.1016/j.geoderma.2018.03.015
     cation of X-Ray Microtomography to the Three-Dimensional Study of Igne-              Ferreiro, J. P., Miranda, J. G. V., Vidal Vázquez, E., 2010. Multifractal Analysis
     ous Rocks. Lithos, 148: 262–276. https://doi.org/10.1016/j.lithos.2012.06.008             of Soil Porosity Based on Mercury Injection and Nitrogen Adsorption. Va-
Barreto, C. J. S., de Lima, E. F., Goldberg, K., 2017. Primary Vesicles,                       dose Zone Journal, 9(2): 325–335. https://doi.org/10.2136/vzj2009.0090
     Vesicle-Rich Segregation Structures and Recognition of Primary and                   García-Gutiérrez, C., San José Martínez, F., Caniego, J., 2017. A Protocol for Frac-
     Secondary Porosities in Lava Flows from the Paraná Igneous Province,                      tal Studies on Porosity of Porous Media: High Quality Soil Porosity Images.
     Southern      Brazil.     Bulletin     of    Volcanology,       79(4):     1–17.          Journal of Earth Science, 28(5): 888–896. https://doi.org/10.1007/s12583-
     https://doi.org/10.1007/s00445-017-1116-x                                                 017-0777-x
Bird, N., Díaz, M. C., Saa, A., et al., 2006. Fractal and Multifractal Analysis           Ge, X. M., Fan, Y. R., Zhu, X. J., et al., 2015. Determination of Nuclear Mag-
     of Pore-Scale Images of Soil. Journal of Hydrology, 322(1/2/3/4): 211–                    netic Resonance T2 Cutoff Value Based on Multifractal Theory—An
     219. https://doi.org/10.1016/j.jhydrol.2005.02.039                                        Application in Sandstone with Complex Pore Structure. Geophysics,
Blower, J. D., Keating, J. P., Mader, H. M., et al., 2001. Inferring Volcanic                  80(1): D11–D21. https://doi.org/10.1190/geo2014-0140.1
     Degassing Processes from Vesicle Size Distributions. Geophysical Re-                 Giachetti, T., Druitt, T. H., Burgisser, A., et al., 2010. Bubble Nucleation,
     search Letters, 28(2): 347–350. https://doi.org/10.1029/2000gl012188                      Growth and Coalescence during the 1997 Vulcanian Explosions of Sou-
Blower, J. D., Keating, J. P., Mader, H. M., et al., 2003. The Evolution of Bubble Size        frière Hills Volcano, Montserrat. Journal of Volcanology and Geother-
     Distributions in Volcanic Eruptions. Journal of Volcanology and Geothermal                mal Research, 193(3/4): 215–231. https://doi.org/10.1016/j.jvolge-
     Research, 120(1/2): 1–23. https://doi.org/10.1016/s0377-0273(02)00404-3                   ores.2010.04.001
Boichu, M., Villemant, B., Boudon, G., 2008. A Model for Episodic Degas-                  Halsey, T. C., Jensen, M. H., Kadanoff, L. P., et al., 1987. Fractal Measures
     sing of an Andesitic Magma Intrusion. Journal of Geophysical Research                     and Their Singularities: The Characterization of Strange Sets. Nuclear
     Atmospheres, 113(B7): B07202. https://doi.org/10.1029/2007jb005130                        Physics B––Proceedings Supplements, 2: 501–511
Cai, J. C., Lin, D. L., Singh, H., et al., 2018. Shale Gas Transport Model in 3D          Houston, A. N., Otten, W., Falconer, R., et al., 2017. Quantification of the
     Fractal Porous Media with Variable Pore Sizes. Marine and Petroleum Geol-                 Pore Size Distribution of Soils: Assessment of Existing Software Using
     ogy, 98: 437–447. https://doi.org/10.1016/j.marpetgeo.2018.08.040                         Tomographic and Synthetic 3D Images. Geoderma, 299: 73–82.
Cashman, K. V., Mangan, M. T., 1994. Chapter 11b: Physical Aspects of                          https://doi.org/10.1016/j.geoderma.2017.03.025
     Magmatic Degassing II. Constraints on Vesiculation Processes from                    Klug, C., Cashman, K. V., Bacon, C. R., 2002. Structure and Physical Char-
     Textural Studies of Eruptive Products. In: Carroll, M. R., Holloway, J.                   acteristics of Pumice from the Climactic Eruption of Mount Mazama
     R., eds., Volatiles in Magmas. De Gruyter, Berlin, Boston. 447–478.                       (Crater Lake), Oregon. Bulletin of Volcanology, 64(7): 486–501.
     https://doi.org/10.1515/9781501509674-018                                                 https://doi.org/10.1007/s00445-002-0230-5
Chen, X. J., Yao, G. Q., Cai, J. C., et al., 2017. Fractal and Multifractal Anal-         Krohn, C. E., 1988. Fractal Measurements of Sandstones, Shales, and Car-
     ysis of Different Hydraulic Flow Units Based on Micro-CT Images.                          bonates. Journal of Geophysical Research Atmospheres, 93(B4): 3297–
     Journal of Natural Gas Science and Engineering, 48: 145–156.                              3305. https://doi.org/10.1029/jb093ib04p03297
     https://doi.org/10.1016/j.jngse.2016.11.048                                          Kushnir, A. R. L., Martel, C., Champallier, R., et al., 2017. In situ Confirma-
Clarkson, C. R., Solano, N., Bustin, R. M., et al., 2013. Pore Structure Char-                 tion of Permeability Development in Shearing Bubble-Bearing Melts
     acterization of North American Shale Gas Reservoirs Using USANS/                          and Implications for Volcanic Outgassing. Earth and Planetary Science
     SANS, Gas Adsorption, and Mercury Intrusion. Fuel, 103: 606–616.                          Letters, 458: 315–326. https://doi.org/10.1016/j.epsl.2016.10.053
     https://doi.org/10.1016/j.fuel.2012.06.119                                           Lai, J., Wang, G. W., Wang, Z. Y., et al., 2018. A Review on Pore Structure
Colombier, M., Wadsworth, F. B., Gurioli, L., et al., 2017. The Evolution of                   Characterization in Tight Sandstones. Earth-Science Reviews, 177: 436–
     Pore Connectivity in Volcanic Rocks. Earth and Planetary Science Let-                     457. https://doi.org/10.1016/j.earscirev.2017.12.003
     ters, 462: 99–109. https://doi.org/10.1016/j.epsl.2017.01.011                        Le Gall, N., Pichavant, M., 2016. Experimental Simulation of Bubble Nucle-
Davydov, M. N., 2012. Nucleation and Growth of a Gas Bubble in Magma.                          ation and Magma Ascent in Basaltic Systems: Implications for Strom-
     Journal of Applied Mechanics and Technical Physics, 53(3): 324–332.                       boli    Volcano.     American      Mineralogist,      101(9):    1967–1985.
     https://doi.org/10.1134/s0021894412030030                                                 https://doi.org/10.2138/am-2016-5639
Degruyter, W., Bachmann, O., Burgisser, A., 2009. Controls on Magma Per-                  Li, P., Zheng, M., Bi, H., et al., 2017. Pore Throat Structure and Fractal Char-
     meability in the Volcanic Conduit during the Climactic Phase of the Kos                   acteristics of Tight Oil Sandstone: A Case Study in the Ordos Basin,
     Plateau Tuff Eruption (Aegean Arc). Bulletin of Volcanology, 72(1): 63–                   China. Journal of Petroleum Science and Engineering, 149: 665–674.
     74. https://doi.org/10.1007/s00445-009-0302-x                                             https://doi.org/10.1016/j.petrol.2016.11.015
Evertsz, C. J. G., Mandelbrot, B. B., 1992. Multifractal Measures (Appendix               Liu, D. K., Gu, Z. L., Liang, R. X., et al., 2020. Impacts of Pore-Throat Sys-
     B). In: Peitgen, H.-O., Jurgens, H., Saupe, D., eds., Chaos and Fractals.                 tem on Fractal Characterization of Tight Sandstones. Geofluids, 2020:
     Springer Verlag, New York. 922–953                                                        1–17. https://doi.org/10.1155/2020/4941501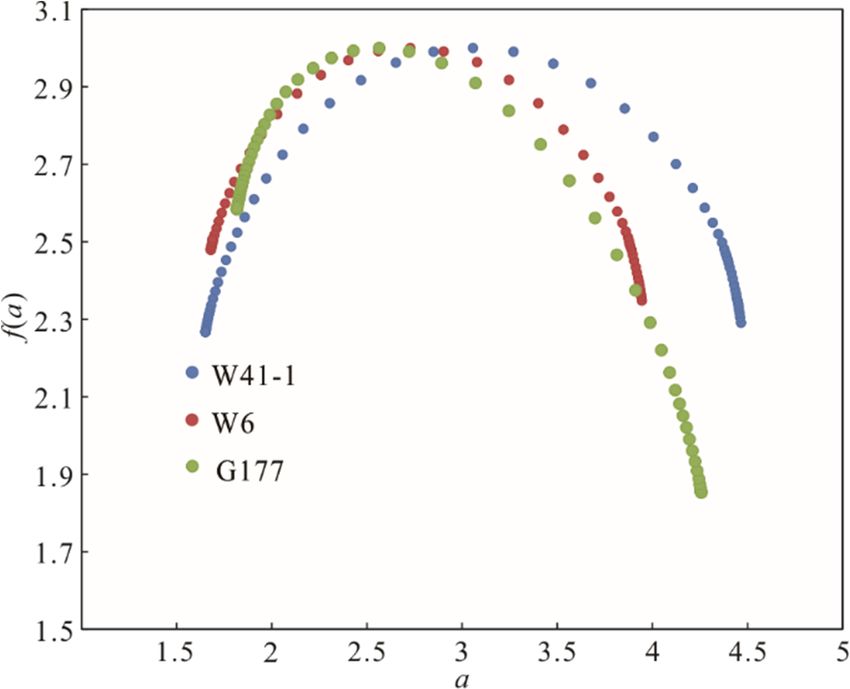
808                          Mutian Qin, Shuyun Xie, Jianbo Zhang, Tianfu Zhang, Emmanuel John M. Carranza, Hongjun Li and Jiayi Ma

Lyu, C., Cheng, Q. M., Zuo, R. G., et al., 2017. Mapping Spatial Distribution                Layered Volcanic Conduits: The Role of Decompression Rate and Crystal
      Characteristics of Lineaments Extracted from Remote Sensing Image                      Content on the Ascent Dynamics of Magmas. Earth and Planetary Science
      Using Fractal and Multifractal Models. Journal of Earth Science, 28(3):                Letters, 524: 115732. https://doi.org/10.1016/j.epsl.2019.115732
      507–515. https://doi.org/10.1007/s12583-016-0914-x                                Tarquis, A. M., Heck, R. J., Andina, D., et al., 2009. Pore Network Complex-
Mandelbrot, B. B., 1977. Fractals: Form, Chance and Dimension. Freeman,                      ity and Thresholding of 3D Soil Images. Ecological Complexity, 6(3):
      San Francisco. https://doi.org/10.1017/s0001924000090862                               230–239. https://doi.org/10.1016/j.ecocom.2009.05.010
Manga, M., Castro, J., Cashman, K. V., et al., 1998. Rheology of Bubble-                Toramaru, A., 1995. Numerical Study of Nucleation and Growth of Bubbles
      Bearing Magmas. Journal of Volcanology and Geothermal Research,                        in Viscous Magmas. Journal of Geophysical Research: Solid Earth,
      87(1/2/3/4): 15–28. https://doi.org/10.1016/s0377-0273(98)00091-2                      100(B2): 1913–1931. https://doi.org/10.1029/94jb02775
Mongrain, J., Larsen, J. F., King, P. L., 2008. Rapid Water Exsolution, De-             Turcotte, D. L., 1989. Fractals in Geology and Geophysics. Pure and Applied
      gassing, and Bubble Collapse Observed Experimentally in K-Phonolite                    Geophysics, 131(1/2): 171–196. https://doi.org/10.1007/BF00874486
      Melts. Journal of Volcanology and Geothermal Research, 173(3/4):                  Vona, A., Ryan, A. G., Russell, J. K., et al., 2016. Models for Viscosity and
      178–184. https://doi.org/10.1016/j.jvolgeores.2008.01.026                              Shear Localization in Bubble-Rich Magmas. Earth and Planetary Sci-
Namiki, A., Manga, M., 2006. Influence of Decompression Rate on the Expansion                ence Letters, 449: 26–38. https://doi.org/10.1016/j.epsl.2016.05.029
      Velocity and Expansion Style of Bubbly Fluids. Journal of Geophysical Re-         Wang, F. Y., Jiao, L., Lian, P. Q., et al., 2019. Apparent Gas Permeability,
      search: Solid Earth, 111(B11): 17. https://doi.org/10.1029/2005jb004132                Intrinsic Permeability and Liquid Permeability of Fractal Porous Media:
Okumura, S., Kushnir, A. R. L., Martel, C., et al., 2016. Rheology of Crystal-               Carbonate Rock Study with Experiments and Mathematical Modelling.
      Bearing Natural Magmas: Torsional Deformation Experiments at 800 ℃                     Journal of Petroleum Science and Engineering, 173: 1304–1315.
      and 100 MPa. Journal of Volcanology and Geothermal Research, 328:                      https://doi.org/10.1016/j.petrol.2018.10.095
      237–246. https://doi.org/10.1016/j.jvolgeores.2016.11.009                         Wang, F. Y., Lian, P. Q., Jiao, L., et al., 2018. Fractal Analysis of Microscale
Okumura, S., Nakamura, M., Tsuchiyama, A., et al., 2008. Evolution of Bub-                   and Nanoscale Pore Structures in Carbonates Using High-Pressure Mer-
      ble Microstructure in Sheared Rhyolite: Formation of a Channel-Like                    cury Intrusion. Geofluids, 1: 1–15. https://doi.org/10.1155/2018/4023150
      Bubble Network. Journal of Geophysical Research Atmospheres,                      Wright, H. M. N., Cashman, K. V., Gottesfeld, E. H., et al., 2009. Pore Struc-
      113(B7): B07208. https://doi.org/10.1029/2007jb005362                                  ture of Volcanic Clasts: Measurements of Permeability and Electrical
Orsi, G., Gallo, G., Heiken, G., et al., 1992. A Comprehensive Study of Pum-                 Conductivity. Earth and Planetary Science Letters, 280(1/2/3/4): 93–
      ice Formation and Dispersal: The Cretaio Tephra of Ischia (Italy). Jour-               104. https://doi.org/10.1016/j.epsl.2009.01.023
      nal of Volcanology and Geothermal Research, 53(1/2/3/4): 329–354.                 Xia, Y. X., Cai, J. C., Perfect, E., et al., 2019. Fractal Dimension, Lacunarity
      https://doi.org/10.1016/0377-0273(92)90090-Z                                           and Succolarity Analyses on CT Images of Reservoir Rocks for Perme-
Papale, P., Neri, A., Macedonio, G., 1998. The Role of Magma Composition                     ability   Prediction.     Journal    of   Hydrology,      579:     124198.
      and Water Content in Explosive Eruptions: 1. Conduit Ascent Dynamics.                  https://doi.org/10.1016/j.jhydrol.2019.124198
      Journal of Volcanology and Geothermal Research, 87(1/2/3/4): 75–93.               Xie, S. Y., Cheng, Q. M., Ling, Q. C., et al., 2010. Fractal and Multifractal
      https://doi.org/10.1016/s0377-0273(98)00101-2                                          Analysis of Carbonate Pore-Scale Digital Images of Petroleum Reser-
Parmigiani, A., Degruyter, W., Leclaire, S., et al., 2017. The Mechanics of                  voirs.    Marine    and     Petroleum     Geology,     27(2):    476–485.
      Shallow Magma Reservoir Outgassing. Geochemistry, Geophysics, Ge-                      https://doi.org/10.1016/j.marpetgeo.2009.10.010
      osystems, 18(8): 2887–2905. https://doi.org/10.1002/2017gc006912                  Yang, F., Ning, Z. F., Liu, H. Q., 2014. Fractal Characteristics of Shales from
Pioli, L., Azzopardi, B. J., Bonadonna, C., et al., 2017. Outgassing and Erup-               a Shale Gas Reservoir in the Sichuan Basin, China. Fuel, 115: 378–384.
      tion of Basaltic Magmas: The Effect of Conduit Geometry. Geology,                      https://doi.org/10.1016/j.fuel.2013.07.040
      45(8): 759–762. https://doi.org/10.1130/g38787.1                                  Yang, Z. Y., Pourghasemi, H. R., Lee, Y. H., 2016. Fractal Analysis of
Pistone, M., Caricchi, L., Fife, J. L., et al., 2015. In situ X-Ray Tomographic              Rainfall-Induced Landslide and Debris Flow Spread Distribution in the
      Microscopy Observations of Vesiculation of Bubble-Free and Bubble-                     Chenyulan Creek Basin, Taiwan. Journal of Earth Science, 27(1): 151–
      Bearing    Magmas.       Bulletin    of    Volcanology,      77(12):    1–15.          159. https://doi.org/10.1007/s12583-016-0633-4
      https://doi.org/10.1007/s00445-015-0992-1                                         Yin, L. R., Li, X. L., Zheng, W. F., et al., 2019. Fractal Dimension Analysis
Pistone, M., Whittington, A. G., Andrews, B. J., et al., 2017. Crystal-Rich                  for Seismicity Spatial and Temporal Distribution in the Circum-Pacific
      Lava Dome Extrusion during Vesiculation: An Experimental Study.                        Seismic Belt. Journal of Earth System Science, 128(1): 1–7.
      Journal of Volcanology and Geothermal Research, 347: 1–14.                             https://doi.org/10.1007/s12040-018-1040-2
      https://doi.org/10.1016/j.jvolgeores.2017.06.018                                  Yu, B. M., 2006. Fractal Dimensions for Multiphase Fractal Media. Fractals,
Prodanović, M., Lindquist, W. B., Seright, R. S., 2007. 3D Image-Based                       14(2): 111–118. https://doi.org/10.1142/s0218348x06003155
      Characterization of Fluid Displacement in a Berea Core. Advances in               Zheng, Q. H., You, J. Y., 2019. Hydrocarbon Accumulation Characteristics of Cre-
      Water Resources, 30(2): 214–226. https://doi.org/10.1016/j.advwa-                     taceous Volcanic Rocks in Wangguantun Tectonic Zone, Huanghua Depres-
      tres.2005.05.015                                                                      sion. Lithologic Reservoirs, 31(5): 44–51 (in Chinese with English Abstract)
Rahner, M. S., Halisch, M., Peres Fernandes, C., et al., 2018. Fractal Dimensions       Zhou, L. H., Qin, M. T., Xiao, D. Q., et al., 2021. Multi-Scaling Properties of
      of Pore Spaces in Unconventional Reservoir Rocks Using X-Ray Nano- and                 2D Reservoir Micro-Pore Heterogeneity Based on Digital Casting Thin-
      Micro-Computed Tomography. Journal of Natural Gas Science and Engi-                    Section Images. Natural Resources Research, 30(1): 359–370.
      neering, 55: 298–311. https://doi.org/10.1016/j.jngse.2018.05.011                      https://doi.org/10.1007/s11053-020-09747-8
Shields, J. K., Mader, H. M., Pistone, M., et al., 2014. Strain-Induced Outgassing of   Zhou, W. D., Xie, S. Y., Bao, Z. Y., et al., 2019. Chemical Compositions and
      Three-Phase Magmas during Simple Shear. Journal of Geophysical Research:               Distribution Characteristics of Cements in Longmaxi Formation Shales,
      Solid Earth, 119(9): 6936–6957. https://doi.org/10.1002/2014jb011111                   Southwest China. Journal of Earth Sciences, 30(5): 879–892.
Spina, L., Morgavi, D., Costa, A., et al., 2019. Gas Mobility in Rheologically-              https://doi.org/10.1007/s12583-019-1013-7
You can also read