Physicochemical Properties of Indoor and Outdoor Particulate Matter 2.5 in Selected Residential Areas near a Ferromanganese Smelter
←
→
Page content transcription
If your browser does not render page correctly, please read the page content below

International Journal of
               Environmental Research
               and Public Health

Article
Physicochemical Properties of Indoor and Outdoor
Particulate Matter 2.5 in Selected Residential Areas near a
Ferromanganese Smelter
Setlamorago Jackson Mbazima * , Masilu Daniel Masekameni                                 and Gill Nelson

                                          Occupational Health Division, School of Public Health, University of the Witwatersrand, Parktown,
                                          Johannesburg 2193, South Africa; daniel.masekameni@wits.ac.za (M.D.M.); gill.nelson@wits.ac.za (G.N.)
                                          * Correspondence: setlamoragojackson@gmail.com

                                          Abstract: Particulate matter (PM) of different sizes and elemental composition is a leading contrib-
                                          utor to indoor and outdoor air pollution in residential areas. We sought to investigate similarities
                                          between indoor and outdoor PM2.5 in three residential areas near a ferromanganese smelter in
                                          Meyerton to apportion the emission source(s). Indoor and outdoor PM2.5 samples were collected
                                          concurrently, using GilAir300 plus samplers, at a flow rate of 2.75 L/min. PM2.5 was collected on
                                          polycarbonate membrane filters housed in 37 mm cassettes coupled with PM2.5 cyclones. Scan-
                                          ning electron microscopy coupled with energy-dispersive spectroscopy was used to study the
                                          morphology, and inductively coupled plasma-mass spectroscopy was used to analyse the elemental
                                          composition of the PM2.5 . Mean indoor and outdoor PM2.5 mass concentrations were 10.99 and

                                   24.95 µg/m3 , respectively. Mean outdoor mass concentration was 2.27-fold higher than the indoor
                                          concentration. Indoor samples consisted of irregular and agglomerated particles, ranging from 0.09 to
Citation: Mbazima, S.J.;
Masekameni, M.D.; Nelson, G.
                                          1.06 µm, whereas outdoor samples consisted of irregular and spherical particles, ranging from 0.10 to
Physicochemical Properties of Indoor      0.70 µm. Indoor and outdoor PM2.5 were dominated by manganese, silicon, and iron, however,
and Outdoor Particulate Matter 2.5 in     outdoor PM2.5 had the highest concentration of all elements. The ferromanganese smelter was
Selected Residential Areas near a         identified as the potential main contributing source of PM2.5 of different physicochemical properties.
Ferromanganese Smelter. Int. J.
Environ. Res. Public Health 2021, 18,     Keywords: Meyerton; source apportionment; mass concentration; diameter; elemental composition;
8900. https://doi.org/10.3390/            SEM-EDS; ICP-MS
ijerph18178900

Academic Editor: Chunrong Jia

                                          1. Introduction
Received: 30 June 2021
                                               Particulate matter (PM) with an aerodynamic diameter of 2.5 µm or less (PM2.5 ) has
Accepted: 15 August 2021
                                          been identified as the leading contributor to indoor and outdoor air pollution [1,2]. Al-
Published: 24 August 2021
                                          though PM2.5 can be released from natural sources, anthropogenic sources such as mining
                                          activities, coal-fired power stations, motor vehicles, and smelters have been identified as
Publisher’s Note: MDPI stays neutral
with regard to jurisdictional claims in
                                          major sources of atmospheric PM2.5 in residential areas [3–5]. High-temperature combus-
published maps and institutional affil-
                                          tion sources, such as ferromanganese (FeMn) smelters, have been associated with high
iations.
                                          emissions of airborne manganese (Mn)-bearing PM2.5 with different physicochemical prop-
                                          erties [6,7]. Higher concentrations of airborne Mn-bearing PM2.5 have been reported in
                                          residential areas downwind of FeMn smelters relative to upwind areas [8,9].
                                               A study by Menezes-Filho et al. [10] measured atmospheric Mn-bearing PM2.5 in resi-
                                          dential areas 1.3 km from a FeMn smelter plant in Salvador, Brazil. The authors reported
Copyright: © 2021 by the authors.
                                          atmospheric Mn concentrations ranging from 0.011 to 0.439 µg/m3 . Total suspended
Licensee MDPI, Basel, Switzerland.
This article is an open access article
                                          particles atmospheric Mn sampled from 2003 to 2013 in two Ohio towns near a ferrosilico-
distributed under the terms and
                                          manganese smelter were between 0.11 and 0.39 µg/m3 , and 0.17 and 1.5 µg/m3 [11]. In
conditions of the Creative Commons
                                          another study, daily atmospheric Mn concentrations were found to be 1279 and 2062 ng/m3
Attribution (CC BY) license (https://     in two residential areas near a FeMn smelter in Spain, Cantabria [7]. Most studies have
creativecommons.org/licenses/by/          focused largely on PM2.5 because it is suggested to have a higher resident time in the
4.0/).                                    atmosphere relative to PM10 [8,12]. Furthermore, PM2.5 can be transported over longer

Int. J. Environ. Res. Public Health 2021, 18, 8900. https://doi.org/10.3390/ijerph18178900                    https://www.mdpi.com/journal/ijerph
Int. J. Environ. Res. Public Health 2021, 18, 8900                                                                              2 of 18

                                        distances from the source and enter indoor environments through infiltration and filtration
                                        mechanisms [13,14]. In modern society, people spend 80–90% of their time indoors where
                                        they are likely to be exposed. Specifically, pregnant women, sick people, toddlers, and the
                                        elderly have a weaker immune system and spend most of their time indoors, increasing
                                        the risk of exposure.
                                              Epidemiological studies have shown a correlation between exposure to airborne
                                        Mn-bearing PM2.5 and cognitive and motor impairments, in residential areas near FeMn
                                        smelters [15–19]. A recent study [20] conducted near a FeMn smelter in Meyerton, South
                                        Africa, the site of the present study, reported an association between mood and environmen-
                                        tal exposure to low Mn air concentrations. However, like other previous epidemiological
                                        studies [11,21–23], the study by Racette et al. [20] used data from ambient monitoring
                                        stations located farther from the receptors as a proxy for exposure for a specific population.
                                        Therefore, the studies lacked reliable exposure assessment data in the near field of the
                                        receptors [24,25]. The new era of exposure assessment argues that PM measured at or
                                        near the source may have different chemical signatures than that measured at far-field
                                        monitoring stations [26–28].
                                              In South Africa, most of the conducted studies on exposure to airborne
                                        Mn [29,30] were confined to occupational settings. Rodríguez-Agudelo et al. [31] ar-
                                        gued that although occupational settings commonly have higher airborne Mn concentra-
                                        tions than residential areas, occupational exposures are periodic, usually between 8 and
                                        12 h/day. Conversely, residential exposures are continuous, usually between 12 and
                                        24 h/per day, and include susceptible groups such as children under the age of five, the el-
                                        derly, and immunocompromised people [31–33]. Davourie et al. [34], added that exposure
                                        to airborne Mn-bearing particles in occupational settings has been sufficiently investigated,
                                        however, exposure in residential areas remains a significant concern.
                                              To the best of our knowledge, no studies have investigated the physicochemical prop-
                                        erties of indoor and outdoor airborne PM2.5 in residential areas near FeMn smelters in
                                        South Africa [35]. Subsequently, there are limited data on physicochemical properties
                                        of PM2.5 and exposure assessment data in residential areas near FeMn smelters in South
                                        Africa [36,37]. Knowledge of the physicochemical properties of PM2.5 is important in
                                        understanding its origin, formation, and transformation mechanisms, and the processes
                                        that can occur at its surfaces [38]. Once the main emission source(s) have been identified,
                                        effective control measures to protect public health and the environment can be imple-
                                        mented [39,40]. The results may also provide insight into the morphology and elemental
                                        composition of the PM2.5 to which the residents are potentially exposed. This is important,
                                        given that the health outcomes of exposure to airborne Mn-bearing PM2.5 depend on the
                                        size and elemental composition [41]. In this study, we aimed to (1) characterise indoor and
                                        outdoor PM2.5 ; (2) determine the relationship between indoor and outdoor PM2.5 mass
                                        concentrations; and (3) apportion the emission source(s) of PM2.5 in three residential areas
                                        near a FeMn smelter in Meyerton, South Africa.

                                        2. Materials and Methods
                                        2.1. Description of Study Area
                                             The study was conducted in the town of Meyerton with geographical positioning
                                        system coordinates 26.5854◦ S and 28.0069◦ E. Meyerton has an area of 180.24 km2 and
                                        had a population size of 55.283 people in the recent census [42]. The area has an average
                                        temperature of 17 ◦ C, average rainfall of 34.4 mm, humidity 61%, and wind speeds of
                                        6 km/h. Within Meyerton, there is a FeMn smelter that has been operating since 1959
                                        and produces between 540 kilotons of FeMn, annually [43]. Old Sicelo, New Sicelo, and
                                        Noldick were the three residential areas selected for this study; all are located downwind
                                        of the FeMn smelter (Figure 1). Although the three residential areas are in the same region,
                                        they have different characteristics and are at different distances from the FeMn smelter.
                                        New Sicelo is closest to the FeMn smelter (~1.4 km), followed by Noldick (~1.5 km) and
                                        Old Sicelo (3.5 km).
and Old Sicelo are predominantly shacks, constructed from corrugated iron and boards;
most of the dwellings in Noldick are constructed from cement blocks. The residential ar-
eas had been developed because people wanted to be closer to their workplaces to save
money related to transport costs and to maximise their time [37]. Old and New Sicelo are
Int. J. Environ. Res. Public Health 2021,located
18, 8900 west of the R59, which is one of Gauteng Province’s busiest freeways that connects
3 of 18
to other neighbouring provinces. The R551 and M61 roads that connect to other neigh-
bouring residential areas pass through Noldick and New Sicelo.
Figure 1. Geographical
Figure 1. Geographical map
map of
of the
the study
study area
area (created
(created using
using Google
Google earth
earth map
map (Mountain
(Mountain View, CA, USA)
View, CA, USA) and
and Arcmap
Arcmap
version 10.8 (Esri, Redlands, CA, USA)).
version 10.8 (Esri, Redlands, CA, USA)).
2.2. Sampling of Indoor
In addition to the and
FeMn Outdoor
smelter,PMthere
2.5 are other stationery sources within the Meyerton
area.Polycarbonate
A cement factory is located ~1.2
membrane filters of 37 mm km frominNoldick,
diameter2.5with
km afrom
poreNew size Sicelo,
of 0.08 and
µm
2.8 kmconditioned
were from Old Sicelo.
before There
and is alsosampling.
after a coal-firedGravimetric
starch factory that is ~1.6
weighing waskm from Noldick,
undertaken un-
~3.3 km from New
der controlled Sicelo,conditions
laboratory and ~3.6 km (atfrom
21 °COld Sicelo. Most
temperature and dwellings at New using
35% humidity), and Oldan
Sicelo are microbalance
electronic predominantly shacks,
scale constructed
(Sartorius, from corrugated
AG, Germany), iron and boards;
model CPA225D, that hasmost of
a min-
the dwellings
imum in Noldick
resolution and precision are constructed
of 0.001 mg. from cement
Indoor andblocks.
outdoorThe PMresidential areas sim-
2.5 was sampled had
been developed
ultaneously, usingbecause people Gilian
two identical wanted to be300plus
GilAir closer topumps
their workplaces
(Sensidyne,to Stsave money
Petersburg,
related to transport costs and to maximise their time [37]. Old and
FL, USA). One pump was used to sample the outdoor PM2.5 while the other was used to New Sicelo are located
west of indoor
sample the R59,PMwhich
2.5 in is
the one
mainof Gauteng Province’s
activity room. Bothbusiest
pumpsfreeways
were placedthat indoors
connectsfor to secu-
other
neighbouring
rity purposes and provinces.
to protect The R551
them andharsh
from M61 environmental
roads that connect to other
conditions neighbouring
such as rain and
residential areas pass through Noldick and New Sicelo.
direct sunlight, which can damage the pumps and affect their functionality. The pumps
2.2. Sampling of Indoor and Outdoor PM2.5
Polycarbonate membrane filters of 37 mm in diameter with a pore size of 0.08 µm
were conditioned before and after sampling. Gravimetric weighing was undertaken un-
der controlled laboratory conditions (at 21 ◦ C temperature and 35% humidity), using
an electronic microbalance scale (Sartorius, AG, Germany), model CPA225D, that has a
minimum resolution and precision of 0.001 mg. Indoor and outdoor PM2.5 was sampled
simultaneously, using two identical Gilian GilAir 300plus pumps (Sensidyne, St Petersburg,
FL, USA). One pump was used to sample the outdoor PM2.5 while the other was used
to sample indoor PM2.5 in the main activity room. Both pumps were placed indoors for
security purposes and to protect them from harsh environmental conditions such as rain
and direct sunlight, which can damage the pumps and affect their functionality. The pumps
were connected to a Teflon tube that joined the pumps and a 37 mm cassette (SKC Inc., PA,
USA) fitted with a polycarbonate membrane filter (PCTE) (Zefon, Ocala, FL, USA) [44].
Int. J. Environ. Res. Public Health 2021, 18, 8900                                                                                  4 of 18

                                              The cassette was coupled with a 37 mm PM2.5 Gs-3 multiple-inlet cyclone (SKC Inc.,
                                        PA, USA) that separated the coarse and fine particles, using centrifugal force. PCTE filters
                                        are suitable for microscopic analyses because they have a smooth surface area which makes
                                        it easier to detect single particles [45,46]. PCTE filters are also recommended for elemental
                                        analysis due to their low blank levels, inertness to gas adsorption, low impurities, low
                                        moisture absorption, high PM collection efficiency, and ability to withstand severe weather
                                        conditions [45,47].
                                              Indoor and outdoor PM2.5 was sampled at a constant flow rate of 2.75 L/min and the
                                        particles were deposited onto the PCTE filters. Indoor and outdoor PM2.5 were sampled
                                        continuously for 24 h over seven days at 30 selected households, resulting in 60 samples
                                        (30 indoor and 30 outdoor samples). The sampled houses were randomly selected by draw-
                                        ing a grid on the study area map and two houses were selected from each grid. Sampling
                                        was conducted from September to November 2019, which was spring in South Africa.
                                              Indoor PM2.5 samples were collected at a height of ~1.5 m, 1.2 m from the walls and
                                        openings, and 1 m from indoor sources such as cooking activities [48]. Indoor samples were
                                        collected in the sitting rooms; where impossible (e.g., one-room houses) indoor samples
                                        were collected in the middle of the room. There were no restrictions on the activities
                                        undertaken during the sampling, therefore, participants carried out their normal activities.
                                        For outdoor samples, the 1.5 m height could not be used in most cases due to the difference
                                        in the house structures. Therefore, outdoor samples were sometimes collected at a height
                                        below or above 1.5 m.

                                        2.3. Data Analysis
                                        2.3.1. Indoor and Outdoor PM2.5 Mass Concentration
                                             Gravimetric weighing was undertaken to obtain the post-mass using the Sartorius
                                        electronic microbalance. Each filter was weighed three times before and three times after
                                        sampling and the average mass was recorded. The final mass was obtained by subtracting
                                        the initial mass from the post-mass of the filter, using Equation (1).

                                                                       M = M f − Mi + B f − Bi                                (1)

                                        where (M) is the final corrected mass (µg), (Mf ) is the post mass of the field filter after
                                        sampling, (Mi ) is the pre-mass of the field filter before sampling, (Bf ) is the post mass of the
                                        blank filter, (Bi ) is the pre mass of the blank filter. The volume of sampled air was obtained
                                        using Equation (2).
                                                                                           fl × t
                                                                                     V=                                                 (2)
                                                                                           1000
                                        where (V) is the volume, (fl) is the flow rate at which the pump was sampling in L/min, (t)
                                        is the sampling duration in minutes. To convert the unit of volume from L/min to cubic
                                        metres (m3 ), the product of the flow rate and time was divided by 1000. The concentration
                                        of indoor and outdoor PM2.5 was calculated using Equation (3).

                                                                                          M
                                                                                    C=                                                 (3)
                                                                                          V

                                        where (C) is the concentration (µg/m3 ), (M) is the final corrected mass obtained using
                                        Equation (1) and (V) is the volume of sampled air in m3 obtained using Equation (2).

                                        2.3.2. Indoor–Outdoor Ratio
                                             Indoor–outdoor ratios (I/O) were calculated to determine the difference between
                                        indoor and outdoor PM2.5 mass concentration and to determine whether there is a contri-
                                        bution of outdoor PM2.5 to the indoor environment. An I/O ratio of one indicates unity
                                        between the PM2.5 in the indoor and outdoor environment. An I/O ratio of less than one
                                        indicates a contribution of outdoor PM to the indoor environment. A ratio greater than one
Int. J. Environ. Res. Public Health 2021, 18, 8900                                                                                   5 of 18

                                        indicates a significant indoor source that is contributing to indoor air quality. The I/O ratio
                                        was obtained using Equation (4).
                                                                                         C
                                                                                  Ci = in                                           (4)
                                                                                        Cout
                                        where Ci is the indoor-outdoor ratio, Cin is the indoor PM2.5 mass concentration, and Cout
                                        is the outdoor PM2.5 mass concentration.

                                        2.3.3. Statistical Analysis
                                              Microsoft Excel 2019 version (Redmond, Washington, DC, USA) was used for data
                                        analysis and to compare the indoor and outdoor PM2.5 mass concentrations. An F-test
                                        was used to check the normality of the data and the type of t-test to employ. Based on the
                                        outcome of the F-test, Student’s t-test was used to test for a statistically significant difference
                                        between the means of indoor and outdoor PM2.5 mass concentrations. The Student’s
                                        t-test was performed at a 95% confidence level and a p-value of less than 0.05 indicated a
                                        statistically significant difference [49]. Microsoft Excel was also used to perform Pearson’s
                                        correlation coefficient to determine the strength of the relationship between indoor and
                                        outdoor PM2.5 mass concentrations. Regression was also performed to determine the
                                        contribution of outdoor PM2.5 on indoor PM2.5 mass concentrations. Furthermore, the
                                        indoor and outdoor PM2.5 mass concentration data was transferred to the IBM version 27 of
                                        the Statistical Package for Social Sciences software (Chicago, IL, USA), and a Tukey–Kramer
                                        post hoc test was performed to obtain an adjusted p-value.

                                        2.3.4. Scanning Electron Microscopy (SEM)
                                             The morphology and chemical composition of the particles were studied using a
                                        Tescan Vega3 SEM (Tescan, Brno, Czech Republic) coupled with X-max 50 mm2 energy-
                                        dispersive spectroscopy (EDS) (Oxford Instruments, Abingdon, Oxfordshire, UK). SEM
                                        was used to image the surface of the particles and the EDS was used to semi-quantitatively
                                        analyse the chemical composition. Approximately 1 cm2 was cut from the centre of each
                                        selected PCTE filter containing the sampled PM, using a pair of scissors [50,51]. The centre
                                        of the analysed filters was assumed to be a representative of the entire deposited PM2.5 [52].
                                        The filter pieces were mounted onto an aluminium stub, using a double-sided adherent
                                        carbon conductive tape [53]. The PCTE filters are non-conductive; therefore, the samples
                                        were sputter-coated with a thin layer of carbon (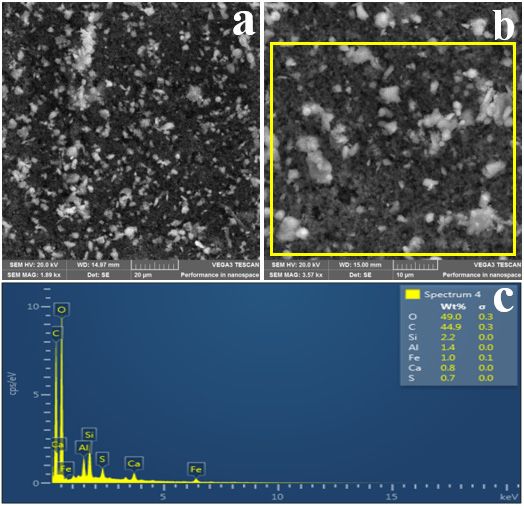
Int. J. Environ. Res. Public Health 2021, 18, 8900                                                                                6 of 18

                                        folded and placed inside pre-cleaned microwave digestion vessels; 9 mL ultrapure (Merck)
                                        nitric acid (HNO3 ) and 1 mL ultrapure (Merck) hydrogen peroxide (H2 O2 ) was added to
                                        each vessel [60]. A reagent blank was included with the batch as a control. The vessels were
                                        closed and placed in a Mars 6 microwave (Mars CEM, Matthews NC, USA). The samples
                                        were transferred to a 50 mL volumetric flask of ultrapure water, 18.2 MΩ/cm resistivity
                                        using the Milli-Q system (Merck Millipore, Bedford, MA, USA). Calibration standards of
                                        0, 0.1, 0.5, 1.0, 5.0, and 10 µg/L were prepared from 100 mg/L National Institute of
                                        Standards Technology traceable stock standards. The samples were then filtered using a
                                        0.45 µm syringe filter and diluted 10 times (1 mL diluted to 10 mL). After digestion, the
                                        samples were analysed using a Perkin Elmer NexION 300 ICP-MS (Perkin Elmer, Waltham,
                                        MA, USA). The elements analysed using the ICP-MS included Mn, magnesium (Mg),
                                        silicon (Si), lead (Pb), vanadium (V), cadmium (Cd), sodium (Na), iron (Fe), cobalt (Co),
                                        nickel (Ni), copper (Cu), chromium (Cr), and zinc (Zn). Similar to Ari et al. [61], indoor
                                        and outdoor concentrations of the elements distributed on sampled PM2.5 were calculated
                                        using Equation (5).
                                                                              Me − f ield blank f ilter
                                                                        Ce =                                                        (5)
                                                                                         V
                                        where (Ce ) is the concentration of the elements in micrograms (µg), (Me ) is the mass of the
                                        elements from the ICP-MS in (µg), field blank filter is the mass of the blank filter, and (V) is
                                        the volume in cubic metre (m3 ).

                                        2.4. Quality Control
                                             Standard pendulums, weighing 100 and 200 g, were weighed on the microbalance
                                        before and after sampling to calibrate the scale and to validate the results. All filters
                                        were prepared in a dust-free laboratory; forceps were used to load and unload filters
                                        while wearing dust-free surgical gloves to avoid cross-contamination. A blank filter was
                                        prepared for each sampling period and transported to the laboratory with the field filters.
                                        During sampling, the blank filter was placed next to the field filters and used to account
                                        for moisture loss due to meteorological conditions, particularly during transportation. The
                                        flow rate of the pump was checked before and after sampling using a rotameter. The flow
                                        rate was verified using a bubble flow metre (Sensidyne, St Petersburg, FL, USA) and the
                                        fluctuation was within 5% deviation. Blank filters were also analysed using SEM-EDS and
                                        ICP-MS to obtain the background and to ensure that the filters were not contaminated.

                                        3. Results
                                        3.1. Indoor and Outdoor PM2.5 Mass Concentration
                                              Table 1 presents the indoor and outdoor PM2.5 mass concentration together with the
                                        I/O ratio results. Mean indoor concentration ranged from 7.78 to 12.93 µg/m3 whereas
                                        the outdoor concentration ranged from 23.79–26.23 µg/m3 . When comparing the overall
                                        combination of the indoor and outdoor PM2.5 concentrations for the three residential areas,
                                        the mean indoor and outdoor PM2.5 mass concentrations were 10.99 and 24.95 µg/m3 ,
                                        respectively. Furthermore, the outdoor PM2.5 mass concentration was 2.27-fold higher than
                                        the indoor concentration. From Table 1, it can also be observed that the outdoor PM2.5
                                        concentrations were higher than the indoor concentrations across the three residential areas.
                                        Outdoor PM2.5 concentrations in Old Sicelo, New Sicelo, and Noldick were 1.94-, 1.92-,
                                        and 3.37-fold higher than the indoor concentrations, respectively. These findings suggest
                                        that the indoor environments were influenced by PM2.5 from the outdoor environment. A
                                        statistically significant difference (p < 0.05) was found, implying that there was a significant
                                        difference between the means of the indoor and outdoor PM2.5 mean concentrations across
                                        the three residential areas. The highest mean I/O ratio was recorded at New Sicelo whereas
                                        the lowest was recorded at Noldick. Mean I/O ratios across the three residential areas were
                                        less than one, indicating that indoor PM2.5 mass concentrations were influenced by PM2.5
                                        from the outdoor environment.
Int. J. Environ. Res. Public Health 2021, 18, 8900                                                                                 7 of 18

      Table 1. Descriptive statistics of indoor and outdoor PM2.5 mass concentrations (µg/m3 ) and indoor–outdoor ratios in the
      three residential areas.

                                                                                                                       CI (95%)
 Residential Area          Pairings          Min          Max      Mean        SD       %Difference         I/O
                                                                                                                     Q1            Q3
                            Indoor          5.9475       18.840    12.2516   4.3295                                8.2864      16.1538
      Old Sicelo              vs.                                                            48.5095      0.5040
                           Outdoor         15.2314       33.9638   23.7939   6.1595                                18.2963     28.8151
                            Indoor          8.3359       19.1895   12.9288    3.290                                10.4902     15.9271
     New Sicelo               vs.                                                            48.0221      0.5441
                           Outdoor          11.680       40.4385   24.8737   9.0046                                18.4296     31.4255
                            Indoor          2.8828       16.9837   7.7841    6.0794                                3.6197      15.9553
       Noldick                vs.                                                            70.3243      0.2732
                           Outdoor          19.470       35.0946   26.2305   5.0204                                21.8400     30.2382
      Min: minimum; Max; maximum; SD: standard deviation; I/O: indoor–outdoor ratio; CI: confidence interval; Q1: lower quartile;
      Q3: upper quartile.

                                             Table 2 shows the Pearson’s correlation coefficients and regression results between
                                        indoor and outdoor PM2.5 mass concentrations. It can be observed that there was a strong
                                        positive relationship between indoor and outdoor PM2.5 mass concentrations across the
                                        three residential areas. Approximately 94% of the indoor PM2.5 concentrations in Old
                                        Sicelo could be explained by the outdoor PM2.5 , whereas 80 and 76% of indoor PM2.5 in
                                        New Sicelo and Noldick, respectively, could be explained by outdoor PM2.5 .

      Table 2. Correlation and regression between indoor and outdoor PM2.5 mass concentrations for the three residential areas.

   Residential Area              r-Value             Intercept     Slope        R-Square               p-Value     Adjusted p-Value
      Old Sicelo                  0.9688             −3.9517       0.6810           0.9386             0.0307             0.0038
      New Sicelo                  0.8932              4.8116       0.3263           0.7978             0.0136             0.0025
       Noldick                    0.8703             −19.8615      1.0539           0.7575             0.0077             0.0010

                                        3.2. Morphology of Indoor and Outdoor PM2.5
                                             Representative SEM images showing the shape of indoor and outdoor PM2.5 sampled
                                        in the three residential areas are shown in Figures 2–4. It can be observed that indoor and
                                        outdoor PM2.5 had different sizes and shapes. Indoor PM2.5 in all three areas consisted of
                                        irregular and spherical particles, whereas outdoor PM2.5 consisted of agglomerated and
                                        irregular-shaped particles. PM2.5 from the indoor and outdoor environments had the same
                                        or similar morphologies, suggesting that it was from the same source.
                                             Table 3 shows particle diameter results for the indoor and outdoor PM2.5 sampled in
                                        the three residential areas. The mean size of the indoor particles ranged between 0.38 and
                                        0.49 µm, whereas the mean size of outdoor particles ranged between 0.3 and 0.37 µm. It
                                        can be observed that both indoor and outdoor PM2.5 in the three residential areas were in
                                        the accumulation mode (0.1–1 µm).
Int. J. Environ. Res. Public Health 2021, 18, 8900 8 of 18
Int. J. Environ. Res. Public Health 2021, 18, x FOR PEER REVIEW 8 of 18
Int. J. Environ. Res. Public Health 2021, 18, x FOR PEER REVIEW 8 of 18
Indoor Outdoor
Indoor Outdoor
FigureFigure
2. SEM images
2. SEM of images
indoor andofoutdoor
indoorPM 2.5 sampled at Old Sicelo: (a) image captured at 20 µm; (b) image captured
and outdoor PM2.5 sampled at Old Sicelo: (a) image captured at
at 10 µm;
Figure (c) EDS
2. SEM spectrum
images of the
of indoor portion
and highlighted
outdoor in yellow.
PM2.5 sampled at Old Sicelo: (a) image captured at 20 µm; (b) image captured
20 µm; (b) image captured at 10 µm; (c)
at 10 µm; (c) EDS spectrum of the portion highlighted in EDS spectrum of the portion highlighted in yellow.
yellow.
Indoor Outdoor
Indoor Outdoor
Figure 3. SEM images of indoor and outdoor PM2.5 sampled at New Sicelo: (a) indoor image captured at 10 µm; (b) indoor
captured
Figure at 5 µm;
3. SEM (a) outdoor
images indoorimage captured
PMat
2.5 20 µm; (b)
at image captured at 5 µm; (c) EDS spectrum of the
(b)portion
Figure
highlighted
3. SEMofimages and outdoor
of indoor and sampled
outdoor PM New Sicelo: (a) indoor
2.5 sampled at Newimage captured
Sicelo: at 10 µm;
(a) indoor image indoor
captured
captured at in yellow.
5 µm; (a) outdoor image captured at 20 µm; (b) image captured at 5 µm; (c) EDS spectrum of the portion
atRes.
Int. J. Environ.
highlighted10Public
µm;
in (b) indoor
Health
yellow. 2021, 18, captured at 5 µm; (a) outdoor image captured at 20 µm; (b) image captured
x FOR PEER REVIEW at
9 of 18
5 µm; (c) EDS spectrum of the portion highlighted in yellow.
Indoor Outdoor
FigureFigure
4. SEM 4.
images
SEMof indoor
images andofoutdoor
indoor PM 2.5 sampled at Noldick: (a) image captured at 20 µm; (b) image captured
and outdoor PM2.5 sampled at Noldick: (a) image captured at
at 10 µm; (c) EDS spectrum of the portion highlighted in yellow.
20 µm; (b) image captured at 10 µm; (c) EDS spectrum of the portion highlighted in yellow.
Table 3 shows particle diameter results for the indoor and outdoor PM2.5 sampled in
the three residential areas. The mean size of the indoor particles ranged between 0.38 and
0.49 µm, whereas the mean size of outdoor particles ranged between 0.3 and 0.37 µm. It
can be observed that both indoor and outdoor PM2.5 in the three residential areas were in
the accumulation mode (0.1–1 µm).
Table 3. Indoor and outdoor particle diameter (µm) measurements in the three residential areas.Int. J. Environ. Res. Public Health 2021, 18, 8900 9 of 18
Table 3. Indoor and outdoor particle diameter (µm) measurements in the three residential areas.
Old Sicelo New Sicelo Noldick
Parameter
Indoor Outdoor Indoor Outdoor Indoor Outdoor
Minimum 0.09 0.11 0.10 0.10 0.10 0.14
Mean 0.49 0.37 0.38 0.36 0.40 0.30
Maximum 1.06 0.67 0.66 0.70 0.70 0.48
3.3. Elemental Composition of Indoor and Outdoor PM2.5
Table 4 shows the concentrations of elements in the air in indoor and outdoor en-
vironments obtained using ICP-MS. It can be observed that outdoor concentrations of
elements were higher than indoor concentrations across the three residential areas, also
suggesting that the indoor environment was impacted by PM2.5 from the outdoor environ-
ment. Silicon, Mn, and iron were the highest in both indoor and outdoor environments.
Potassium and cadmium were not detected in either indoor and outdoor samples across
the three residential areas. The limits of quantification for K and Cd wereInt. J. Environ. Res. Public Health 2021, 18, 8900 10 of 18
openings but also through foot tracking, whereas some could have been suspended or
resuspended during walking and cleaning activities [66–69].
Noldick had the highest average outdoor PM2.5 mass concentration (26.23 ± 5 µg/m3 ),
followed by New Sicelo (24.89 ± 9 µg/m3 ), and Old Sicelo (18.7 ± 8.9 µg/m3 ) (Table 1).
However, the 24 h mean outdoor PM2.5 mass concentrations across the three residential
areas were within the World Health Organization ambient air quality guidelines and the
South African national air quality standard of 25 µg/m3 . Although Noldick is furthest
from the FeMn smelter, it had the highest outdoor PM2.5 mass concentration relative to
New Sicelo, which is nearest. This finding is an indication that the FeMn smelter is not the
only contributing source of outdoor PM2.5 ; the coal-fired starch factory, cement factory, and
mobile sources are also potential sources. Moreover, Noldick is closest to the R59 highway,
R551 and M61 main roads, the coal-fired starch factory, and the cement factory.
Our indoor and outdoor PM2.5 mass concentration results are similar to those of
previous studies [70–72], which also found that the outdoor mass concentration was
greater than the indoor concentration. Studies by Martuzevicius et al. [73] and Abdel-
Salam [74] found a significant correlation between the distance from major traffic roads
and outdoor PM2.5 mass concentrations in residential areas. The difference in outdoor
PM2.5 mass concentrations across the three residential areas could be due to variation
in the source, source strength, distance from the source, and different meteorological
conditions [7,8,75,76].
4.2. Relationship between Indoor and Outdoor PM2.5 Mass Concentrations
As shown in Table 1, the mean I/O ratio at New and Old Sicelo showed less variation;
however, the I/O ratios of the two residential areas varied when compared to Noldick.
Nonetheless, the I/O ratios across the three residential areas were below one, implying
that the indoor PM2.5 mass concentrations were influenced by PM2.5 from the outdoor envi-
ronment. The correlation coefficient results (Table 2) showed a strong positive relationship
between indoor and outdoor PM2.5 mass concentrations across the three residential areas.
Correlation coefficients for Old Sicelo, New Sicelo, and Noldick were r = 0.97, p = 0.03;
r = 0.90, p = 0.01; and r = 0.88, p = 0.01, respectively. The R-square values of Old Sicelo,
New Sicelo, and Noldick were 0.94, 0.80, and 0.76, respectively.
The relationship between indoor and outdoor PM2.5 mass concentrations in Old Sicelo
can be described using the equation y = −3.96x + 0.68, which indicates that for every unit
mass increase in outdoor PM2.5 , the indoor mass concentration increases by 0.68 µg/m3 .
At New Sicelo, the relationship between indoor and outdoor PM2.5 concentrations can be
described by the equation y = 4.81x + 0.33, which indicates that for every unit mass increase
in outdoor PM2.5 , indoor mass concentration increases by 0.33 µg/m3 . The indoor and
outdoor PM2.5 mass concentration relationships at Noldick can be represented using the
equation y = −19.87x + 1.05, which indicates that for every unit mass increase in outdoor
PM2.5 , indoor mass concentration increases by 1.05 µg/m3 0.33 µg/m3 .
The positive correlation between indoor and outdoor PM2.5 concentrations, R-square
values close to one, and the corresponding I/O ratios of less than one, confirm that indoor
concentrations were influenced by PM2.5 from the outdoor environment. Similar results
were reported by Massey et al. [77] and Bozlaker et al. [72], who also found a strong
and positive relationship between indoor and outdoor PM2.5 mass concentrations. The
results are expected because it has been reported that approximately 35–70% of indoor
PM2.5 comes from the outdoor environment [64,78]. Our indoor and outdoor PM2.5 mass
concentration findings complement those of Hasheminassab et al. [13], Gao et al. [79], and
Zhao et al. [80], who found that outdoor PM2.5 mass concentration was significantly higher
than the indoor concentration.
4.3. Morphology
SEM-EDS was used to determine the physicochemical properties of indoor and out-
door PM2.5 . Figures 2–4 show representative SEM-EDS images of indoor and outdoorInt. J. Environ. Res. Public Health 2021, 18, 8900 11 of 18
PM2.5 for the three residential areas. As previously mentioned, indoor PM2.5 across the
three residential areas consisted of irregular and spherical particles, whereas the outdoor
PM2.5 was dominated by compact agglomerated irregular particles. Mn particles tend to
form aggregates of primary particles that are fused and agglomerates of string-like clusters
of primary particles that adhere due to electrostatic forces [81,82]. According to Gjønnes
et al. [83], agglomerated particles indicate that the particles were of submicron size and
agglomerated to form larger particles. Spherical particles commonly originate from natural
processes such as pollen, or anthropogenic sources such as high-temperature combustion
processes [4,50,84]. Therefore, it can be concluded that the indoor spherical particles are
from a high-combustion source(s) such as the nearby FeMn smelter.
Table 3 shows the indoor and outdoor PM2.5 particle diameter results. It can be
observed that indoor particles were larger than the outdoor particles; however, both indoor
and outdoor particles were of a submicron size. The mean particle diameter for indoor
PM2.5 was 0.49 µm for Old Sicelo, 0.38 µm for New Sicelo, and 0.40 µm for Noldick. The
mean outdoor particle diameters at Old Sicelo, New Sicelo, and Noldick were 0.37, 0.36,
0.30 µm, respectively. Our SEM results are similar to those of Gjønnes et al. who used SEM-
EDS to investigate the physicochemical properties of particulate matter during various
processes in a ferro and silicomanganese smelter in Norway. The authors reported spherical,
irregular, and agglomerated submicron Mn oxide particles. Our results also complement
those of Ervik et al. [85], who conducted a study in a ferro and silicomanganese smelter
in Norway using SEM-EDS and found that the FeMn smelter was dominated by compact
agglomerated and individual spherical oxidic Mn particles. The authors also reported
elements such as Mn, sulphur, and silicon, which were also found in this study. In another
study conducted near a FeMn alloy plant in Cantabria, Spain, Hernández-Pellón et al. [7]
found irregular Mn- and Fe-enriched particles.
4.4. Elemental Composition of Indoor and Outdoor PM2.5
The EDS results revealed that indoor and outdoor PM2.5 across the three residential
areas was enriched with elements such as aluminium, iron, and sulphur. Potassium
and cadmium were not detected in either indoor and outdoor samples across the three
residential areas, for which the limit of detection for the EDS was Fe > Mn.
However, outdoor concentrations of elements in the air were higher than the indoor
concentrations, further supporting the indoor and outdoor PM2.5 mass concentrations
reported in Table 1. The elements reported in Table 4 have been reported in residential
areas near FeMn smelters and high traffic density [8,86]. Noldick had the highest indoor Mn
concentrations (1.7 µg/m3 ), followed by Old Sicelo (1.2 µg/m3 ), whereas New Sicelo had
the lowest concentration (1.03 µg/m3 ). Noldick, which is 1.5 km from the FeMn smelter,
also had the highest outdoor Mn concentration (6.7 µg/m3 ), followed by New Sicelo
(5.6 µg/m3 ), which is 1.4 km away. Old Sicelo, which is located 3.5 km from the FeMn
smelter, reported the least airborne Mn concentration (3.9 µg/m3 ). Indoor Fe concentrationsInt. J. Environ. Res. Public Health 2021, 18, 8900 12 of 18
at Old Sicelo, New Sicelo, and Noldick were 3.87, 7.08, and 4.85 µg/m3 , respectively,
whereas outdoor Fe concentrations were 10.53, 12.06, and 6.17 µg/m3 , respectively.
The indoor and outdoor Fe and Mn concentrations can be attributed to the FeMn
smelter and vehicular emissions [7,87]. Studies have found higher Mn concentrations in
residential areas near FeMn smelters, particularly in residential areas downwind. A study
conducted in residential areas near a FeMn metallurgy plant in Boulogne-Sur-Mer, France,
found high Fe and Mn concentrations in a residential area within 200 m [88]. In another
study conducted in Cantabria, Spain, Expósito et al. [76] found higher concentrations of
airborne Mn concentrations in residential areas within 1.5 km of the FeMn smelter. The
airborne Fe concentrations can also be attributed to the corrugated Fe used for roofing and
constructing shacks.
After the ban of Pb in the petroleum industry, methylcyclopentadienyl manganese
tricarbonyl, which is an organic derivative of Mn, has been used significantly as an additive
to improve the octane level and anti-knock characteristic of petrol [89,90]. Mn air concentra-
tions in urban areas are influenced by traffic resuspension, abrasion of brake pads, and the
combustion of methylcyclopentadienyl manganese tricarbonyl [22]. Sanderson et al. [91]
reported that engine blocks can contribute significantly to the ambient Fe concentration. A
study conducted in three residential areas near an industrial site in Durban, South Africa,
found high Mn concentrations, which were attributed to metal works industries and high
traffic density in one of the residential areas studied [92]. Silicon is a naturally occurring
element that is abundant in the Earth’s crust and is also a marker of coal-burning [93,94].
Therefore, the high presence of Si content in indoor and outdoor PM2.5 can be attributed to
the coal-fired starch factory, the FeMn smelter, and the cement factory.
The cement factory, motor vehicular emissions, the coal-fired starch factory and the
FeMn smelter were identified as potential contributing sources of indoor and outdoor
PM2.5 in three residential areas in Meyerton. The physicochemical properties of indoor and
outdoor PM2.5 suggest that the nearby FeMn smelter is the main potential emission source.
Our findings suggest that there is a need for integrated town planning and development
strategies whereby FeMn smelters should not be developed near residential areas. Simi-
larly, residential areas should be developed near FeMn smelters, particularly downwind.
Our findings can be used to strengthen epidemiological data and for human health risk
assessment. Although the current study was focused and confined to the characterisation
of indoor and outdoor PM2.5 , the findings indicate that there is potential for exposure
to PM2.5 enriched with elements both in indoor and outdoor environments. Therefore,
the following are recommended to protect the health of residents in the three sampled
residential areas in Meyerton: tree plantation is recommended to trap atmospheric PM, and
planting of vegetation and paving of dusty areas should be implemented to prevent the
resuspension of settled PM by wind or human activities. The planting of trees should also
be undertaken alongside the busy roads because motor vehicular emissions were identified
as the major potential source of Mn- and Fe-enriched PM2.5 .
Interventional studies are important given the health outcomes associated with ex-
posure to PM2.5 enriched with elements, particularly Mn-bearing PM2.5 . For example, the
interventional studies can investigate the type of interventions needed and where they can
be placed to effectively reduce exposure to PM2.5 Mn-bearing particles, both indoor and
outdoor. Exposure and human health risk assessment studies are also recommended in the
Meyerton area. Where possible, the measurements should be taken at the breathing zone
of the receptors, e.g., [25,95,96], to reduce the uncertainty. Future studies can investigate
the environmental and human health impacts of the FeMn smelter and motor vehicular
emissions beyond the three residential areas studied. Furthermore, future studies can
investigate the possibility of the PM2.5 changing from the air compartment to water and
soil. Time–activity pattern studies are also recommended to quantify how much time
the residents spend indoors, outdoors, and outside the boundaries of their microenviron-
ment. Time-activity pattern studies are necessary because the development of adverse
health outcomes depends on factors such as duration and frequency of exposure. Therefore,Int. J. Environ. Res. Public Health 2021, 18, 8900 13 of 18
time–activity patterns can be used to collect data that will be useful for exposure assessment
and modelling the intake and uptake of PM2.5 .
4.5. Strengths and Limitations
This is the first study to investigate the physicochemical properties of indoor and
outdoor PM2.5 in a residential area near a FeMn smelter in South Africa. The study did not
use data obtained from stationery monitors located farther from the receptors; rather, PM2.5
samples were collected at the level of the receptors. PM2.5 samples were also collected
in indoor environments, which are neglected in numerous studies, even though people
spend 80–90% of their time indoors. The study also identified the major potential emitting
sources of indoor and outdoor PM2.5 -bound elements in the three residential areas.
We only analysed a small portion of the filter (~1 cm2 ) cut from the centre of the
filter. We acknowledge that some of the sampled PM2.5 could have deposited on the edge
of the filters. Due to limited funds, only two indoor and outdoor filters per residential
area were analysed using ICP-MS. The study did not use a weather monitoring station
to obtain meteorological data, which are important for the transportation and dispersion
of atmospheric PM. Moreover, there was no monitoring data for Meyerton on the South
African Air Quality Information System during the study. Due to this limitation, the PM2.5
concentrations were not correlated with meteorological data, such as wind speed, wind
direction, humidity, and temperature. Time–activity patterns were also not included in this
study. The time–activity patterns would have assisted in understating the contribution of
indoor sources to the indoor PM2.5 mass concentration.
The data were collected during the spring season, and the PM2.5 concentrations are
unlikely to remain consistent throughout the different seasons. Therefore, future studies
should be conducted over a longer period to address seasonal variations. The air exchange
rates in the sampled households were not measured, and may have helped determine the
infiltration and deposition rate of outdoor PM2.5 into the indoor environments. Information
about the production rate of the smelter was also unobtainable. Although the sample size
was small, there is no reason to believe that the measurements were not representative
of the three areas. A study using a larger sample size could, however, be conducted to
confirm the findings.
5. Conclusions
In this study, indoor and outdoor PM2.5 samples were collected concurrently in three
residential areas near a FeMn smelter. We characterised indoor and outdoor PM2.5 , de-
termined the relationship between indoor and outdoor PM2.5 mass concentrations, and
apportioned the potential source(s). For the first time in the context of South Africa, the
physicochemical properties of indoor and outdoor PM2.5 in a residential area near a FeMn
smelter were investigated. Therefore, the findings can be used as baseline information
because such data is limited in South Africa. Indoor PM2.5 mass concentrations were less
than the outdoor concentrations in all three residential areas, and the mean outdoor mass
concentration was 2.27-fold higher than the indoor concentration. Pearson’s correlation
coefficients showed a strong positive relationship between indoor and outdoor PM2.5 mass
concentrations in the three residential areas. The mean I/O ratios of less than one and a pos-
itive relationship between indoor and outdoor PM2.5 supported the hypothesis that indoor
PM2.5 mass concentrations were influenced by PM2.5 from the outdoor environment. EDS
and ICP-MS analysis showed the presence of elements commonly associated with FeMn
smelter emissions. The concentrations of elements were higher in outdoor environments
than in indoor environments across the three residential areas. The spherical, irregular,
and agglomerated submicron particles, and their elemental composition, are associated
with high-combustion sources such as FeMn smelter and motor vehicles. Therefore, the
coal-fired starch factory, the FeMn smelter, motor vehicles, and the FeMn smelter are
potential sources of indoor and outdoor PM2.5 of different physicochemical properties in
the three residential areas in Meyerton.Int. J. Environ. Res. Public Health 2021, 18, 8900 14 of 18
Author Contributions: Conceptualisation, S.J.M. and M.D.M.; methodology, M.D.M.; software,
S.J.M.; validation, M.D.M. and G.N.; formal analysis, S.J.M. and M.D.M.; investigation, S.J.M.;
resources, M.D.M.; data curation, S.J.M.; writing—original draft preparation, S.J.M.; writing—review
and editing, M.D.M. and G.N.; visualisation, S.J.M.; supervision, M.D.M.; project administration,
G.N.; funding acquisition, M.D.M. All authors have read and agreed to the published version
of the manuscript.
Funding: This work was supported by the National Institutes of Health—National Institute of
Environmental Health Sciences (R01ES025991, R01ES025991-02S1).
Institutional Review Board Statement: The study was conducted according to the guidelines of the
Declaration of Helsinki, and approved by the Human Research Ethics Committee (University of the
Witwatersrand, Johannesburg, Gauteng province, South Africa) (clearance certificate no: M150466,
15/06/2015) approved this study.
Informed Consent Statement: Informed consent was obtained from all subjects involved in the study.
Data Availability Statement: The data presented in this study are available on reasonable request
from the corresponding author.
Acknowledgments: We are thankful to Tony da Silva for assisting with the data collection, to the
occupational hygiene section at the National Institute for Occupational Health for their support with
sampling equipment, to Siyasanga Mpelane for his assistance with SEM-EDX analysis, to Petrus
Philipus Pieters for assisting with the ICP-MS analysis, and to Seremi China Mooa for assisting with
the data presentation and statistical analysis. Lastly, we thank all the study participants for their
co-operation and for allowing us into their houses.
Conflicts of Interest: The authors declare no conflict of interest.
References
1. Li, X.; Sun, W.; Zhao, L.; Cai, J. Emission characterization of particulate matter in the ironmaking process. Environ. Technol. 2017,
40, 282–292. [CrossRef]
2. Hänninen, O.; Goodman, P. Outdoor Air as a Source of Indoor Pollution. In Indoor Air Pollution; the Royal Society of Chemistry:
London, UK, 2019; pp. 35–65.
3. Goix, S.; Uzu, G.; Oliva, P.; Barraza, F.; Calas, A.; Castet, S.; Point, D.; Masbou, J.; Duprey, J.L.; Huayta, C.; et al. Metal
concentration and bioaccessibility in different particle sizes of dust and aerosols to refine metal exposure assessment. J. Hazard.
Mater. 2016, 317, 552–562. [CrossRef]
4. Ahmed, M.; Guo, X.; Zhao, X.-M. Spectroscopic and microscopic characterization of atmospheric particulate matter. Instrum. Sci.
Technol. 2017, 45, 659–682. [CrossRef]
5. Galvão, E.S.; Santos, J.M.; Lima, A.T.; Reis, N.C.; Orlando, M.T.D.A.; Stuetz, R.M. Trends in analytical techniques applied to
particulate matter characterization: A critical review of fundaments and applications. Chemosphere 2018, 199, 546–568. [CrossRef]
[PubMed]
6. Almeida, S.; Pio, C.; Freitas, M.; Reis, M.; Transcoso, M. Source apportionment of fine and coarse particulate matter in a sub-urban
area at the Western European Coast. Atmos. Environ. 2005, 39, 3127–3138. [CrossRef]
7. Hernández-Pellón, A.; Fernández-Olmo, I.; Ledoux, F.; Courcot, L.; Courcot, D. Characterization of manganese-bearing particles
in the vicinities of a manganese alloy plant. Chemosphere 2017, 175, 411–424. [CrossRef] [PubMed]
8. Hernández-Pellón, A.; Fernández-Olmo, I. Airborne concentration and deposition of trace metals and metalloids in an urban area
downwind of a manganese alloy plant. Atmos. Pollut. Res. 2019, 10, 712–721. [CrossRef]
9. Dos Santos, N.R.; Rodrigues, J.L.; Bandeira, M.J.; Anjos, A.L.d.S.; Araújo, C.d.F.S.; Adan, L.F.F.; Menezes-Filho, J.A. Manganese
exposure and association with hormone imbalance in children living near a ferro-manganese alloy plant. Environ. Res. 2019,
172, 166–174. [CrossRef]
10. Menezes-Filho, J.A.; Paes, C.R.; Ângela, Â.M.; Moreira, J.C.; Sarcinelli, P.N.; Mergler, D. High levels of hair manganese in children
living in the vicinity of a ferro-manganese alloy production plant. Neurotoxicology 2009, 30, 1207–1213. [CrossRef]
11. Colledge, M.A.; Julian, J.R.; Gocheva, V.V.; Beseler, C.L.; Roels, H.A.; Lobdell, D.T.; Bowler, R.M. Characterization of air manganese
exposure estimates for residents in two Ohio towns. J. Air Waste Manag. Assoc. 2015, 65, 948–957. [CrossRef]
12. Salma, I.; Füri, P.; Németh, Z.; Balásházy, I.; Hofmann, W.; Farkas, Á. Lung burden and deposition distribution of inhaled
atmospheric urban ultrafine particles as the first step in their health risk assessment. Atmos. Environ. 2015, 104, 39–49. [CrossRef]
13. Hasheminassab, S.; Daher, N.; Shafer, M.M.; Schauer, J.J.; Delfino, R.J.; Sioutas, C. Chemical characterization and source
apportionment of indoor and outdoor fine particulate matter (PM 2.5 ) in retirement communities of the Los Angeles Basin. Sci.
Total Environ. 2014, 490, 528–537. [CrossRef]Int. J. Environ. Res. Public Health 2021, 18, 8900 15 of 18
14. Koivisto, A.J.; Kling, K.I.; Hänninen, O.; Jayjock, M.; Löndahl, J.; Wierzbicka, A.; Fonseca, A.S.; Uhrbrand, K.; Boor, B.E.; Jiménez,
A.S.; et al. Source specific exposure and risk assessment for indoor aerosols. Sci. Total Environ. 2019, 668, 13–24. [CrossRef]
[PubMed]
15. Bowler, R.M.; Beseler, C.L.; Gocheva, V.V.; Colledge, M.; Kornblith, E.S.; Julian, J.R.; Kim, Y.; Bollweg, G.; Lobdell, D.T.
Environmental exposure to manganese in air: Associations with tremor and motor function. Sci. Total Environ. 2016, 541, 646–654.
[CrossRef] [PubMed]
16. Kornblith, E.S.; Casey, S.L.; Lobdell, D.T.; Colledge, M.A.; Bowler, R. Environmental exposure to manganese in air: Tremor, motor
and cognitive symptom profiles. Neurotoxicology 2018, 64, 152–158. [CrossRef] [PubMed]
17. Solís-Vivanco, R.; Rodríguez-Agudelo, Y.; Riojas-Rodríguez, H.; Ríos, C.; Rosas, I.; Montes, S. Cognitive impairment in an adult
Mexican population non-occupationally exposed to manganese. Environ. Toxicol. Pharmacol. 2009, 28, 172–178. [CrossRef]
[PubMed]
18. Ruiz-Azcona, L.; Fernández-Olmo, I.; Expósito, A.; Markiv, B.; Paz-Zulueta, M.; Parás-Bravo, P.; Sarabia-Cobo, C.; Santibáñez, M.
Impact of Environmental Airborne Manganese Exposure on Cognitive and Motor Functions in Adults: A Systematic Review and
Meta-Analysis. Int. J. Environ. Res. Public Health 2021, 18, 4075. [CrossRef]
19. Rodrigues, J.L.; Araújo, C.F.S.; dos Santos, N.R.; Bandeira, M.J.; Anjos, A.L.S.; Carvalho, C.F.; Lima, C.S.; Abreu, J.N.S.; Mergler,
D.; Menezes-Filho, J.A. Airborne manganese exposure and neurobehavior in school-aged children living near a ferro-manganese
alloy plant. Environ. Res. 2018, 167, 66–77. [CrossRef] [PubMed]
20. Racette, B.A.; Nelson, G.; Dlamini, W.W.; Hershey, T.; Prathibha, P.; Turner, J.R.; Checkoway, H.; Sheppard, L.; Searles Nielsen, S.
Depression and anxiety in a manganese-exposed community. Neurotoxicology 2021, 85, 222–233. [CrossRef]
21. Hernández-Pellón, A.; Nischkauer, W.; Limbeck, A.; Fernández-Olmo, I. Metal(loid) bioaccessibility and inhalation risk assess-
ment: A comparison between an urban and an industrial area. Environ. Res. 2018, 165, 140–149. [CrossRef]
22. Moreno, T.; Pandolfi, M.; Querol, X.; Lavín, J.; Alastuey, A.; Viana, M.; Gibbons, W. Manganese in the urban atmosphere:
Identifying anomalous concentrations and sources. Environ. Sci. Pollut. Res. 2011, 18, 173–183. [CrossRef]
23. Haynes, E.N.; Sucharew, H.; Hilbert, T.J.; Kuhnell, P.; Spencer, A.; Newman, N.C.; Burns, R.; Wright, R.; Parsons, P.J.; Dietrich,
K.N. Impact of air manganese on child neurodevelopment in East Liverpool, Ohio. Neurotoxicology 2018, 64, 94–102. [CrossRef]
24. Sly, P.D.; Carpenter, D.O.; Van den Berg, M.; Stein, R.T.; Landrigan, P.J.; Brune-Drisse, M.-N.; Suk, W. Health Consequences of
Environmental Exposures: Causal Thinking in Global Environmental Epidemiology. Ann. Glob. Health. 2016, 82, 3. [CrossRef]
25. Haynes, E.N.; Ryan, P.; Chen, A.; Brown, D.; Roda, S.; Kuhnell, P.; Wittberg, D.; Terrell, M.; Reponen, T. Assessment of personal
exposure to manganese in children living near a ferromanganese refinery. Sci. Total Environ. 2012, 427–428, 19–25. [CrossRef]
[PubMed]
26. Snyder, E.G.; Watkins, T.H.; Solomon, P.A.; Thoma, E.D.; Williams, R.W.; Hagler, G.S.W.; Shelow, D.; Hindin, D.A.; Kilaru, V.J.;
Preuss, P.W. The Changing Paradigm of Air Pollution Monitoring. Environ. Sci. Technol. 2013, 47, 11369–11377. [CrossRef]
[PubMed]
27. Lowther, S.D.; Jones, K.C.; Wang, X.; Whyatt, J.D.; Wild, O.; Booker, D. Particulate Matter Measurement Indoors: A Review of
Metrics, Sensors, Needs, and Applications. Environ. Sci. Technol. 2019, 53, 11644–11656. [CrossRef] [PubMed]
28. West, J.J.; Cohen, A.; Dentener, F.; Brunekreef, B.; Zhu, T.; Armstrong, B.; Bell, M.L.; Brauer, M.; Carmichael, G.; Costa, D.L.; et al.
What We Breathe Impacts Our Health: Improving Understanding of the Link between Air Pollution and Health. Environ. Sci.
Technol. 2016, 50, 4895–4904. [CrossRef] [PubMed]
29. Young, T.; Myers, J.E.; Thompson, M. Lou The Nervous System Effects of Occupational Exposure to Manganese-Measured as
Respirable Dust-in a South African Manganese Smelter. Neurotoxicology 2005, 26, 993–1000. [CrossRef] [PubMed]
30. Myers, J.E.; Tewaternaude, J.; Fourie, M.; Zogoe, H.B.A.; Naik, I.; Theodorou, P.; Tassel, H.; Daya, A.; Thompson, M. Lou Nervous
System Effects of Occupational Manganese Exposure on South African Manganese Mineworkers. Neurotoxicology 2003, 24,
649–656. [CrossRef]
31. Rodríguez-Agudelo, Y.; Riojas-Rodríguez, H.; Ríos, C.; Rosas, I.; Sabido Pedraza, E.; Miranda, J.; Siebe, C.; Texcalac, J.L.; Santos-
Burgoa, C. Motor alterations associated with exposure to manganese in the environment in Mexico. Sci. Total Environ. 2006, 368,
542–556. [CrossRef]
32. Zota, A.R.; Schaider, L.A.; Ettinger, A.S.; Wright, R.O.; Shine, J.P.; Spengler, J.D. Metal sources and exposures in the homes of
young children living near a mining-impacted Superfund site. J. Expo. Sci. Environ. Epidemiol. 2011, 21, 495–505. [CrossRef]
[PubMed]
33. Morawska, L.; Afshari, A.; Bae, G.N.; Buonanno, G.; Chao, C.Y.H.; Hänninen, O.; Hofmann, W.; Isaxon, C.; Jayaratne, E.R.;
Pasanen, P.; et al. Indoor aerosols: From personal exposure to risk assessment. Indoor Air 2013, 23, 462–487. [CrossRef] [PubMed]
34. Davourie, J.; Westfall, L.; Ali, M.; Mcgough, D. Evaluation of particulate matter emissions from manganese alloy production
using life-cycle assessment. Neurotoxicology 2017, 58, 180–186. [CrossRef] [PubMed]
35. Kalisa, E.; Archer, S.; Nagato, E.; Bizuru, E.; Lee, K.; Tang, N.; Pointing, S.; Hayakawa, K.; Lacap-Bugler, D. Chemical and
Biological Components of Urban Aerosols in Africa: Current Status and Knowledge Gaps. Int. J. Environ. Res. Public Health 2019,
16, 941. [CrossRef]
36. Hermanus, M.A. Manganese-A Public Health Concern: Its Relevance for Occupational Health and Safety Policy and Regulation
in South Africa. Int. J. Occup. Environ. Health 2000, 6, 151–160. [CrossRef]You can also read