Pineapple (Ananas comosus L.) By-Products Valorization: Novel Bio Ingredients for Functional Foods

Page created by Danny Avila
 
CONTINUE READING
Pineapple (Ananas comosus L.) By-Products Valorization: Novel Bio Ingredients for Functional Foods
molecules
Article
Pineapple (Ananas comosus L.) By-Products Valorization:
Novel Bio Ingredients for Functional Foods
Diana I. Santos 1 , Cátia F. Martins 1 , Renata A. Amaral 2 , Luísa Brito 1 , Jorge A. Saraiva 2 ,
António A. Vicente 3 and Margarida Moldão-Martins 1, *

                                          1   LEAF, Linking Landscape, Environment, Agriculture and Food, School of Agriculture, University of Lisbon,
                                              Tapada da Ajuda, 1349-017 Lisbon, Portugal; dianaisasantos@isa.ulisboa.pt (D.I.S.);
                                              catiamartins@isa.ulisboa.pt (C.F.M.); lbrito@isa.ulisboa.pt (L.B.)
                                          2   LAQV-REQUIMTE, Department of Chemistry, University of Aveiro, 3810-193 Aveiro, Portugal;
                                              renata.amaral@ua.pt (R.A.A.); jorgesaraiva@ua.pt (J.A.S.)
                                          3   CEB, Centro de Engenharia Biológica, Departamento de Engenharia Biológica, Universidade de Minho,
                                              Campus de Gualtar, 4710-057 Braga, Portugal; avicente@deb.uminho.pt
                                          *   Correspondence: mmoldao@isa.ulisboa.pt; Tel.: +351-213653547

                                          Abstract: Pineapple is consumed on a large scale around the world due to its appreciated sensorial
                                          characteristics. The industry of minimally processed pineapple produces enormous quantities of by-
                                          products (30–50%) which are generally undervalued. The end-of-life of pineapple by-products (PBP)
                                          can be replaced by reuse and renewal flows in an integrated process to promote economic growth by
                                          reducing consumption of natural resources and diminishing food waste. In our study, pineapple shell
                                          (PS) and pineapple core (PC), vacuum-packed separately, were subjected to moderate hydrostatic
                                pressure (225 MPa, 8.5 min) (MHP) as abiotic stress to increase bromelain activity and antioxidant
         
                                          capacity. Pressurized and raw PBP were lyophilized to produce a stable powder. The dehydrated
Citation: Santos, D.I.; Martins, C.F.;
                                          samples were characterized by the following methodologies: chemical and physical characteriza-
Amaral, R.A.; Brito, L.; Saraiva, J.A.;
                                          tion, total phenolic compounds (TPC), antioxidant capacity, bromelain activity, microbiology, and
Vicente, A.A.; Moldão-Martins, M.
                                          mycotoxins. Results demonstrated that PBP are naturally rich in carbohydrates (66–88%), insoluble
Pineapple (Ananas comosus L.)
By-Products Valorization: Novel Bio
                                          (16–28%) and soluble (2–4%) fiber, and minerals (4–5%). MHP was demonstrated to be beneficial in
Ingredients for Functional Foods.         improving TPC (2–4%), antioxidant activity (2–6%), and bromelain activity (6–32%) without affecting
Molecules 2021, 26, 3216. https://        the nutritional value. Furthermore, microbial and mycotoxical analysis demonstrated that powdered
doi.org/10.3390/molecules26113216         PC is a safe by-product. PS application is possible but requires previous decontamination to reduce
                                          the microbiological load.
Academic Editor: Alice Martins
                                          Keywords: pineapple by-products; bioactive compounds; novel food ingredient; sustainability
Received: 15 April 2021
Accepted: 25 May 2021
Published: 27 May 2021

                                          1. Introduction
Publisher’s Note: MDPI stays neutral
                                               Pineapple has potential in the fresh-cut form market due to its appreciated sensorial
with regard to jurisdictional claims in
                                          characteristics (flavor, juiciness, and taste) and the demand for immediate consumption [1].
published maps and institutional affil-
                                          In addition to its sensorial quality, the nutritional properties of pineapple also deserve
iations.
                                          interest since it is a good source of phenolics, and consequently, it is rich in antioxidant
                                          activity [2].
                                               The consumption of pineapple has health benefits, namely on the digestive system,
                                          and helps to maintain a balanced diet [3]. Pineapple has essential minerals such as man-
Copyright: © 2021 by the authors.
                                          ganese with important functions in bone formation and enzyme activation, and copper with
Licensee MDPI, Basel, Switzerland.
                                          functions on iron absorption, blood pressure regulation, and heart rate [4]. Pineapple is a
This article is an open access article
                                          source of a mixture of several proteases, namely stem bromelain and fruit bromelain [5,6].
distributed under the terms and
                                               Bromelain is an enzyme naturally present in pineapple by-products (PBP; shell, core,
conditions of the Creative Commons
Attribution (CC BY) license (https://
                                          crown, and leaves) that has numerous advantages in the digestive and cardiovascular
creativecommons.org/licenses/by/
                                          systems, along with an anti-inflammatory effect, anticancer, and antimicrobial agent [7].
4.0/).

Molecules 2021, 26, 3216. https://doi.org/10.3390/molecules26113216                                       https://www.mdpi.com/journal/molecules
Pineapple (Ananas comosus L.) By-Products Valorization: Novel Bio Ingredients for Functional Foods
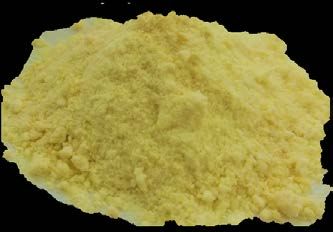
Molecules 2021, 26, 3216                                                                                           2 of 17

                           These characteristics, associated with the high content of phenolic compounds and an-
                           tioxidant activity, are an added value for health [8]. For that reason, bromelain has been
                           used in several areas such as food, pharmaceuticals, cosmetics, and other industries. It
                           may have several industrial food applications, notably in beer clarification, meat and fish
                           brewing (meat tenderizing), baking cookies, grain protein solubilization, functional protein
                           pre-digestion, and protein hydrolysate production [9,10].
                                 Moderate hydrostatic pressure treatments (225 MPa, 8.5 min) are applied on pineapple
                           by-products such as abiotic stress, activate cellular processes, and enhancing the accumu-
                           lation of bromelain and phenolic compounds with antioxidant activity [11]. Dehydrated
                           pineapple by-product, enriched in bromelain using hydrostatic pressure treatment has
                           been used in marinated beef (10–20 mg tyrosine.100 g−1 meat), resulting in a 41% reduction
                           of beef hardness, 8% reduced pH (5.44 to 4.99), and increased marination yield (4%) [12].
                           In the pharmaceutical industry, it is used to facilitate digestion, tumor growth modulation,
                           third-degree burns, enhancing antibiotic action, and as a medication for the oral systemic
                           treatment of inflammation, blood coagulation associated, and cancerous disorders [13].
                           Bromelain is also used in the cosmetics industry as an active ingredient in facial and body
                           care products to provide smooth cell peeling [10].
                                 Fruit by-products produced during processing (shell, core, stem, and crown), repre-
                           senting approximately 50% (w/w) of the total weight of the pineapple, are used mainly
                           in animal feed and in the pharmaceutical industry. Pineapple residues are distributed
                           in 29–40% shell, 9–10% core, 2–6% stem, and 2–4% crown and have the potential to be
                           transformed into value-added products [14,15]. The by-products contain compounds such
                           as dietary fiber, vitamins, minerals, phenolic compounds, and other bioactive compounds.
                           Taking into account the benefits mentioned above, PBP are recommended for incorporation
                           into human food [4,14,16]. The use of agro-industrial by-products is very important due
                           to the large amount of material available, low cost, and characteristics that allow extract-
                           ing/obtaining added-value compounds [17]. The waste generated by the food industry
                           is often a loss of valuable materials that, if treated as by-products, have the potential
                           to be used in other productions and thus reduce management problems (economic and
                           environmental) [18]. The process for recovering by-products must include food safety to
                           ensure the application of the ingredients in the food industry. Therefore, what once was
                           waste can be valued in an integrated way and become a secondary raw material [19,20].
                                 PBP are sensitive to microbial deterioration, entail costs in their disposal, and cause
                           environmental problems. The use of these by-products would be an excellent opportunity
                           to innovate (develop new products) and reduce the amount of waste caused by the food
                           industry [14].
                                 The present study, within the scope of the circular economy concept, aims to: (i) con-
                           tribute to the reduction of food waste through the valorization of PBP (shell and core);
                           (ii) to study the effect of abiotic stress applied by hydrostatic pressure on the compo-
                           sition of PBP, namely antioxidant capacity and bromelain activity, and microbial and
                           toxicological quality.

                           2. Results and Discussion
                           2.1. Color Measurement
                                The analysis of the values of the CIE L*a*b* color parameters showed that the samples
                           of the dehydrated pineapple by-product, core, and shell, presented a similar color, in
                           the yellow/green range, with the color of the pineapple core (PC) being lighter (higher
                           significant values of L*) (Table 1). The photos make it possible to observe differences
                           between the lightness of the core and shell pineapple samples. The color of the samples is
                           quite neutral, and it is expected that the addition to food will not have very marked changes.
                           The samples did not show visible differences between pressurized and non-pressurized
                           samples, although the color evaluation identified a slight variation in the parameter a*
                           of the PS and in the parameter b* in the PC. The visual characteristics of a product have
                           a strong impact on the consumer’s first opinion. Color is a very important attribute in
Molecules
             Molecules2021, 26,26,
                        2021,   x FOR  PEER
                                   x FOR    REVIEW
                                         PEER REVIEW                                                                                                                                   3 of 17 17
                                                                                                                                                                                          3 of

                                            changes.
                                              changes.TheThesamples
                                                              samples diddidnotnot show
                                                                                     show visible differences
                                                                                            visible  differences between
                                                                                                                   between  pressurized
                                                                                                                              pressurizedandandnon-pres-
                                                                                                                                                  non-pres-
Molecules 2021, 26, 3216                                                                                                                               3 of 17
                                            surized
                                              surizedsamples,
                                                        samples, although
                                                                   although   thethecolor  evaluation
                                                                                       color evaluation  identified
                                                                                                           identifieda slight
                                                                                                                       a slightvariation
                                                                                                                                 variationinin
                                                                                                                                             the  param-
                                                                                                                                                the  param-
                                            eter a*a*
                                              eter  ofof
                                                       the
                                                         thePSPS
                                                               andandinin
                                                                        the
                                                                          the parameter
                                                                                 parameter   b*b*
                                                                                                ininthe
                                                                                                      thePC.
                                                                                                          PC.The
                                                                                                               Thevisual
                                                                                                                    visualcharacteristics
                                                                                                                             characteristicsofof
                                                                                                                                               a product
                                                                                                                                                  a product
                                            have
                                              havea strong
                                                    a strong impact
                                                               impact ononthethe consumer’s
                                                                                    consumer’s  first opinion.
                                                                                                   first opinion.Color
                                                                                                                   Coloris is
                                                                                                                           a very  important
                                                                                                                              a very important   attribute
                                                                                                                                                   attribute
                                     sensoryinanalysis
                                               sensory   since it since
                                                         analysis   inducesit it the consumer
                                                                              induces     the consumerto expect
                                                                                                            toto  a certain
                                                                                                               expect          taste
                                                                                                                       a certain     or or
                                                                                                                                  taste  expectation,
                                                                                                                                            expectation,   in
                                              in sensory   analysis since         induces   the  consumer        expect  a certain  taste  or expectation,
                                     addition  to
                                            inin  influencing
                                               addition
                                                 addition toto    perceptions
                                                             influencing
                                                               influencing            regarding
                                                                            perceptions
                                                                               perceptions          the remaining
                                                                                             regarding
                                                                                               regarding  the          sensory
                                                                                                               remaining
                                                                                                             the remaining        attributes.
                                                                                                                            sensory  attributes.
                                                                                                                               sensory  attributes.

                                     Table 1.Table
                                                Table
                                               The   1. 1.
                                                        The
                                                    color   ofcolor
                                                           The  colorof of
                                                                        pineapple
                                                                pineapple      shellshell
                                                                           pineapple        samples
                                                                                        shell
                                                                                       samples    andand
                                                                                              samples      andpineapple
                                                                                                                 pineapple
                                                                                                          pineapple        core
                                                                                                                         core    samples:
                                                                                                                              core  samples:
                                                                                                                               samples:      L*,L*,
                                                                                                                                             L*, a* and
                                                                                                                                                 a*a*  and
                                                                                                                                                     and  b*b*
                                                                                                                                                             CIE
                                                                                                                                                             b* CIE
                                                                                                                                                               CIE L*a*b*
                                                                                                                                                                      L*a*b*
                                                                                                                                                                      L*a*b*
                                             color  parameters,
                                                color
                                     color parameters,parameters,   andandphotography.
                                                            and photography.photography.
                                                                                      Mean Mean
                                                                                              Mean values
                                                                                              values   values ± standard
                                                                                                                ± standard
                                                                                                         ± standard         error,nn ==n 10.
                                                                                                                              error,
                                                                                                                          error,             Different
                                                                                                                                         = 10.
                                                                                                                                         10.   Different
                                                                                                                                             Different  letters  express
                                                                                                                                                           letters
                                                                                                                                                          letters   express
                                                                                                                                                                    express
                                             significant differences      between    thethe
                                                                                          color  of of
                                                                                                    pineapple      shell (PS)  and   pressurized    pineapple     shell
                                     significantsignificant
                                                  differences differences
                                                                  between    between
                                                                                the color   color       pineapple
                                                                                             of pineapple             shell
                                                                                                                  shell     (PS)
                                                                                                                         (PS)    and
                                                                                                                                and     pressurized
                                                                                                                                       pressurized     pineapple
                                                                                                                                                        pineapple    shell
                                                                                                                                                                        shell
                                             (PPS)  (lowercase
                                                (PPS)  (lowercase  letters), and
                                                                      letters), andpineapple
                                                                                     pineapple  core
                                                                                                   core(PC)
                                                                                                          (PC)andandpressurized
                                                                                                                      pressurized  pineapple
                                                                                                                                      pineapple core  (PPC)
                                                                                                                                                   core  (PPC)samples
                                                                                                                                                                 samples
                                     (PPS) (lowercase
                                             (capital      letters),
                                                       letters).
                                                (capital  letters).    and   pineapple      core   (PC)     and   pressurized      pineapple      core   (PPC)     samples
                                     (capital letters).
                                                  Color
                                                    Color                   PSPS                     PPS PPS                    PCPC                      PPCPPC
                                             Color L*L*              79.91 PS± 1.02
                                                                        79.91   ± 1.02
                                                                                     a a       79.49
                                                                                                  79.49
                                                                                                     PPS± 0.83
                                                                                                           ± 0.83a a     90.44
                                                                                                                            90.44±PC0.34
                                                                                                                                    ± 0.34 A A      89.44
                                                                                                                                                       89.44±PPC
                                                                                                                                                               1.61
                                                                                                                                                               ± 1.61A A

                                               L* a*a*               −2.61 ±±1.02
                                                                        −2.61  0.36
                                                                                ± 0.36         −2.07
                                                                                                  −2.07±± 0.83
                                                                                                           0.16
                                                                                                           ± 0.16        −1.94
                                                                                                                            −1.94±±0.13
                                                                                                                                    ± 0.34
                                                                                                                                       0.13 A       −2.09
                                                                                                                                                       −2.09±± 0.23
                                                                                                                                                               ± 0.23
                                                                                     a  a                        b  b                      A A                       A A
                                                                  79.91             a         79.49              a        90.44                       89.44       1.61 A
                                               a* b*b*            −25.46   ±± 0.36
                                                                        25.46  0.36
                                                                                ± 0.36       −25.99
                                                                                                  25.99 ± 0.97
                                                                                                           ±0.16
                                                                                                              0.97b      23.22
                                                                                                                             1.94± ±
                                                                                                                          −23.22    0.56
                                                                                                                                    ± 0.56          24.80
                                                                                                                                                     −24.80 ± 0.77
                                                                                                                                                               ± 0.77
                                                                                    aa  a                        a  a                      A A                        B B
                                                                     2.61                       2.07   ±                               0.13 A           2.09   ±  0.23 A
                                                   b*                    25.46 ± 0.36 a                  25.99 ± 0.97 a                 23.22 ± 0.56 A                  24.80 ± 0.77 B

                                              Photograph
                                                Photograph
                                          Photography
                                                   yy

                                     2.2. Chemical and Physical Characterization
                                             2.2.
                                           The  2.2.Chemical
                                                       Chemical
                                                 chemical           and
                                                                   and  andPhysical
                                                                              Physical
                                                                            physical   Characterization
                                                                                           Characterization
                                                                                             characterization of the PS and core samples is resumed in
                                     Table 2. TheThe         chemical
                                                        global               and
                                                        The chemical and physical
                                                                      analysis      physical
                                                                                     of   the        characterization
                                                                                                   data characterization
                                                                                                            makes it possible  ofofthethePSto
                                                                                                                                            PSand and  core
                                                                                                                                                  observe  coresamples
                                                                                                                                                                  samples
                                                                                                                                                                  differences is is
                                                                                                                                                                                  resumed
                                                                                                                                                                                     resumed
                                                                                                                                                                                       betweeninin
                                     the coreTable
                                                Table
                                                and    2.shell
                                                            The
                                                           2.  The global
                                                                       global
                                                                   pineapple   analysis
                                                                                  analysis
                                                                                     samples,  ofofthe thedata
                                                                                                             data
                                                                                                          however,makes
                                                                                                                     makes   it it
                                                                                                                           the  possible
                                                                                                                                   possible
                                                                                                                                  effect     oftotheobserve
                                                                                                                                                   to   observe   differences
                                                                                                                                                          hydrostaticdifferences      between
                                                                                                                                                                                pressurebetween
                                                                                                                                                                                              did
                                             the
                                     not affect thecore
                                                  the  core and
                                                          basicand  shell
                                                                        shellpineapple
                                                                    composition pineapple   ofsamples,   PBPhowever,
                                                                                                   samples,
                                                                                                  the             however,
                                                                                                                 samples.      thethe
                                                                                                                                  Theeffect
                                                                                                                                        effect ofof
                                                                                                                                         results     theofhydrostatic
                                                                                                                                                        the    hydrostatic
                                                                                                                                                             the   samples     pressure
                                                                                                                                                                                    of rawdid
                                                                                                                                                                                   pressure    did
                                                                                                                                                                                              and
                                             not
                                     pressurizednot affect
                                                       PBPthe
                                                       affect    the
                                                                are basic
                                                                        basic
                                                                        not   composition
                                                                                 composition
                                                                               presented,            ofof
                                                                                                    sincethethePBP
                                                                                                              the PBP samples.
                                                                                                                         samples.
                                                                                                                     values      wereThe
                                                                                                                                       The results
                                                                                                                                               results
                                                                                                                                           similar.       ofofthe  samples
                                                                                                                                                                 the   samples     ofof
                                                                                                                                                                                      raw
                                                                                                                                                                                        rawandand
                                           PSpressurized
                                                pressurized
                                              samples             PBP PBP
                                                               presented   are  not
                                                                              are  notpresented,
                                                                                  lower   presented,
                                                                                               moisture    since
                                                                                                              sincethe
                                                                                                                (5.50 the
                                                                                                                        ±values
                                                                                                                             values
                                                                                                                             0.28%)  were
                                                                                                                                        were
                                                                                                                                         than similar.
                                                                                                                                                  similar.
                                                                                                                                                    PC (7.96 ± 0.17%). However,
                                     all samples had similar and low values of aw (0.264–0.299) toPCPC
                                                     PS PSsamples
                                                              samples     presented
                                                                             presented    lowerlower   moisture
                                                                                                          moisture   (5.50
                                                                                                                        (5.50 ± 0.28%)
                                                                                                                                 ± 0.28%)   thanthan        (7.96
                                                                                                                                                          allow(7.96±good
                                                                                                                                                                       0.17%).
                                                                                                                                                                       ± 0.17%).    However,
                                                                                                                                                                                       However,
                                                                                                                                                                                preservation
                                             allallsamples
                                                     samples      had had  similar
                                                                              similar and and   low low values
                                                                                                            values  ofofawaw(0.264–0.299)
                                                                                                                                 (0.264–0.299)        totoallow
                                                                                                                                                             allow   good
                                                                                                                                                                        good   preservation
                                                                                                                                                                                   preservation
                                     characteristics. Higher moisture values in the PC and similar values of aw can be justified
                                             characteristics.
                                                characteristics.        Higher
                                                                            Higher  moisture
                                                                                      moisture        values
                                                                                                         values  ininthethePCPC  andandsimilar
                                                                                                                                           similar    values
                                                                                                                                                          values  ofofawacanw can bebejustified
                                                                                                                                                                                        justified
                                     by the higher sugar content that promotes greater water retention. Megías-Pérez et al.
                                             bybythe  thehigher
                                                             highersugar   sugarcontent
                                                                                    contentthat     thatpromotes
                                                                                                            promotesgreater greaterwaterwaterretention.
                                                                                                                                                     retention.Megías-Pérez
                                                                                                                                                                       Megías-Pérezet etal.al.
                                     (2014) [21]
                                             (2014) studiedstudied pineapple dehydrated                       fruit and obtained               similar results           (10.4% moisture
                                                (2014)[21]   [21] studiedpineapple  pineappledehydrated  dehydratedfruit     fruitand andobtained
                                                                                                                                               obtainedsimilar   similarresultsresults(10.4%
                                                                                                                                                                                          (10.4%
                                     and awmoisture
                                              ofmoisture
                                                   0.532)and   to
                                                                and  those
                                                                     awaof w of
                                                                                obtained
                                                                              0.532)
                                                                                 0.532)toto       for
                                                                                              those
                                                                                                  those  the   PC
                                                                                                        obtained
                                                                                                            obtained by-products.
                                                                                                                       forforthethePCPC by-products.
                                                                                                                                           by-products.
                                           The caloric         value        of  PSofand        PC     samples         (374.52       and     363.89         kcal.100           −1 dry matter)
                                                     TheThe  caloric
                                                                caloric   value
                                                                             value    PSPS
                                                                                     of       andand  PC PC samples
                                                                                                              samples    (374.52
                                                                                                                            (374.52  andand  363.89
                                                                                                                                                 363.89   kcal.100
                                                                                                                                                             kcal.100   g−1gg−1
                                                                                                                                                                              dry
                                                                                                                                                                                dry matter)
                                                                                                                                                                                       matter) is is
                                             higher
                                     is higher   thanthan
                                                higher       than
                                                            that   that
                                                                     ofthat ofof
                                                                          some some
                                                                                  some   dehydrated
                                                                                             dehydrated
                                                                                    dehydrated                 fruits
                                                                                                            fruitsfruits such
                                                                                                                      such  suchasasraisins,
                                                                                                                                      raisins,
                                                                                                                                     as  raisins,    apples,
                                                                                                                                                        apples,
                                                                                                                                                    apples,       figs,
                                                                                                                                                                     figs,
                                                                                                                                                                   figs,  peaches,
                                                                                                                                                                              peaches,pears,
                                                                                                                                                                            peaches,       pears,
                                                                                                                                                                                           pears,
                                             and
                                     and plums  and plums
                                                        plums
                                                      (347–357  (347–357
                                                                    (347–357
                                                                         kcal.100      g−g
                                                                                kcal.100
                                                                                   kcal.100        gdry
                                                                                               1 −1dry
                                                                                                     −1 drymatter)
                                                                                                              matter)
                                                                                                           matter)     [22].   However,
                                                                                                                           [22].
                                                                                                                         [22].     However,
                                                                                                                                   However,      it is   lower
                                                                                                                                                     it it
                                                                                                                                                         is lower
                                                                                                                                                            is     than
                                                                                                                                                                lower than  thethe
                                                                                                                                                                             than value
                                                                                                                                                                                      themen-
                                                                                                                                                                                     value  men-
                                                                                                                                                                                           value
                                             tioned
                                     mentioned       bybyprevious
                                                tioned        previous
                                                             by  previous      authors
                                                                                  authors
                                                                             authors         forfor
                                                                                             for    nuts
                                                                                                       nuts
                                                                                                    nuts    (553–718
                                                                                                               (553–718
                                                                                                             (553–718      kcal.100
                                                                                                                              kcal.100
                                                                                                                              kcal.100  g−1g)g−1and
                                                                                                                                                −) 1and forfor
                                                                                                                                                     ) and    cereals
                                                                                                                                                                 cereals
                                                                                                                                                                for      (corn,
                                                                                                                                                                      cereals (corn, oats, and
                                                                                                                                                                                       oats,
                                                                                                                                                                                    (corn,    and
                                                                                                                                                                                             oats,
                                             barley
                                     and barley barley   (~425.22
                                                            (~425.22
                                                     (~425.22            kcal.100
                                                                            kcal.100
                                                                       kcal.100      g
                                                                                     g−1−g)1−1[23].
                                                                                              )) [23].
                                                                                                 [23].
                                                     AsAs
                                           As observed     observed
                                                              observed
                                                                  for most  forfor
                                                                                 most
                                                                                    most  dehydrated
                                                                                   dehydrated  dehydrated       fruits,
                                                                                                           fruits, fruits, studied
                                                                                                                      studiedstudiedPBPPBPPBP   samples
                                                                                                                                             samplessamples    presented
                                                                                                                                                                  presented
                                                                                                                                                               presented         lowlow
                                                                                                                                                                                   low protein
                                                                                                                                                                                         protein
                                                                                                                                                                                        protein
                                             content
                                     content (
Molecules 2021, 26, 3216                                                                                                                      4 of 17

                           Table 2. Chemical and physical characterization of the dehydrated samples: pineapple shell (PS) and
                           pineapple core (PC). Different letters express significant differences between pineapple shell and
                           pineapple core samples. Mean values ± standard error. Dietary fiber (n = 6), other parameters (n = 3).

                                                                                                                  PS                   PC
                                            Moisture (g.100                           g−1 )                  5.50 ± 0.28 a
                                                                                                                                  7.96 ± 0.17 b
                                               Water activity                                               0.264 ± 0.004 a      0.299 ± 0.011 b
                                   Caloric value (kcal.100 g−1 dry matter)                                  374.52 ± 1.83 b      363.89 ± 3.90 a
                                Protein                                                                      3.86 ± 0.10 b         2.71 ± 0.20 a

                                                    (g.100 g−1 dry
                             Carbohydrates                                                                   66.44 ± 6.29 a       87.58 ± 3.37 b
                                 Ash                                                                          4.23 ± 0.13 a        4.83 ± 0.28 b

                                                                            matter)
                                                                                               Insoluble     28.82 ± 1.58 b       16.17 ± 1.20 a
                              Dietary fiber                                                     Soluble      3.63 ± 0.13 b         1.53 ± 0.46 a
                                                                                                 Total       32.42 ± 1.55 b       17.70 ± 1.45 a
                                                                                                Sodium      277.87 ± 22.07 a      266.24 ± 8.55 a
                                                            (mg·kg−1 dry matter)               Potassium   9997.69 ± 108.13 a   12089.92 ± 93.91 b
                                                                                                Calcium    1592.45 ± 80.18 b     375.65 ± 43.22 a
                                                                                              Magnesium     784.71 ± 13.87 a     964.45 ± 11.71 b
                                                                                              Phosphorus    1552.87 ± 8.37 b      545.17 ± 8.84 a
                                Minerals                                                        Sulphur    1183.92 ± 19.18 b      601.98 ± 3.48 a
                                                                                                  Iron       32.79 ± 2.84 b        19.44 ± 0.68 a
                                                                                                Copper        5.16 ± 0.78 a         5.80 ± 0.34 a
                                                                                                  Zinc       8.91 ± 0.04 b          1.81 ± 0.05 a
                                                                                              Manganese      34.97 ± 1.06 b        21.90 ± 0.59 a
                                                                                                 Boron       6.66 ± 0.66 b          2.75 ± 0.37 a

                                 PC samples presented lower values of dietary fiber (17.70%) compared to PS samples
                           (32.42%) (Table 2). The fraction of insoluble fiber was the most representative (28.82 and
                           16.17% for PC and shell, respectively). It should be noted that despite being the least
                           representative, the fraction of soluble fiber (1.53–3.63) was relatively high compared to
                           other fruits or cereals. This may be important as dietary fiber is important to reduce the
                           blood glucose of the consumers. Campos et al. (2020) [29] conducted a study with the solid
                           fraction (press cake) of PS and obtained 38.30% insoluble fiber and 7.99% soluble fiber, and
                           regarding PC, obtained 44.37% insoluble fiber and 4.57% soluble fiber. The determination
                           of dietary fiber in pineapple pomace found 45.22% total dietary fiber, 44.44% insoluble
                           fiber, and 0.78% soluble fiber [24]. The pineapple co-products showed 75.8% total dietary
                           fiber, 75.2% insoluble fiber, and 0.6% soluble fiber [25]. Our results for PBP were according
                           to other authors, although the studied samples were not exactly the same. This study
                           evaluated the PS and core independently and without any extraction or concentration.
                           Analyzing the results, it can be assured that the by-products present considerable values
                           of dietary fiber, most of which are insoluble fibers, as obtained in other studies [24,25,29].
                           The PS contains a considerable amount of insoluble fiber that involves mainly cellulose,
                           substances from pectin, hemicellulose, and lignin [30].
                                 Regarding the effect of hydrostatic pressure, in this study (225 MPa), it was not
                           so evident to that observed by Wennberg and Nyman (2004) [31] in the study of the
                           effect of hydrostatic pressure (400 and 500 MPa combined with temperature 20, 50 and
                           80 ◦ C) in white cabbage (Brassica oleracea). Wennberg and Nyman (2004) [31] concluded
                           that the total dietary fiber content of white cabbage was slightly affected by the pressure
                           treatment, but considerable effects were observed on the results of the soluble and insoluble
                           fibers. The proportion of soluble fiber was reduced at all temperatures to pressures of
                           400 MPa. The development of new foods products with specific health benefits may be
                           based on increasing the solubility of dietary fiber improved by the pressure treatment and
                           temperature.
                                 The PS samples showed an ash content (4.23 ± 0.13 g.100 g−1 dry matter) smaller than
                           the PC samples (4.83 ± 0.28 g.100 g−1 dry matter) (Table 2). Hydrostatic pressure treatment
Molecules 2021, 26, 3216                                                                                                                5 of 17

                                                        did not influence the ash-based composition and mineral content, and the results are not
                                                        shown. The values obtained for ash in other studies with pineapple waste samples showed
                                                        a wide range of values (1–5%) [27,30,32]. The ash values obtained in other studies with PS
                                                        corroborate the values obtained in the present study: 4.81% [30], 4.7% [33], and 4.14% [34].
                                                        A study carried out recently obtained values of 6.8% (dry matter basis) in samples of PS [26],
                                                        which confirmed the great variability of results obtained in this pineapple constituent. One
                                                        study with PC samples showed 1.3% of ash with 10% moisture [35], which indicates
                                                        approximately 1.44% (dry matter basis), a lower value than that was observed in the
                                                        present study. The characterization of the chemical composition is still little studied and
                                                        further studies need to be carried out, especially in PC samples.
                                                             The samples of PBP showed a group of minerals (Table 2) of interest for human health.
                                                        The PC samples showed a higher amount of potassium and magnesium compared to the
                                                        PS (p < 0.05), while the PS samples showed a higher amount in the remaining analyzed
                                                        minerals. The minerals present in pineapple juice powder in greater quantities are sodium,
                                                        potassium, calcium, magnesium, and phosphorus, which is in agreement with the obtained
                                                        results in the present study, except for sodium [36]. The PBP, as well as the fruits, also
                                                        have interesting amounts of minerals. The quantification of minerals in PS defined calcium
                                                        and potassium as the majority, although it presents a number of other minerals (bromine,
                                                        cobalt, chromium, cesium, iron, lanthanum, sodium, rubidium, scandium, and zinc) in
                                                        their composition [37]. The PC presents calcium, sodium, potassium, and magnesium in
                                                        greater amounts and iron and zinc in minor amounts [38].

                                                        2.3. Total Phenolic Content and Antioxidant Activity (DPPH, FRAP, and ABTS)
                                                             The total phenolic content (Figure 1) showed higher values in pressurized samples
                                                        (shell: 81.67 mg CAE·g−1 dry matter; core: 80.89 mg CAE·g−1 dry matter) compared to non-
                                                        pressurized samples (shell: 80.42 mg CAE. dry g−1 dry matter; core: 77.61 mg CAE·g−1
                                                        dry matter). The hydrostatic pressure promoted a significant increase (p < 0.05) of 2
                                                        and 4% in the pineapple shell and pineapple core samples, respectively. The increase in
ecules 2021, 26, x FOR PEER REVIEW                      the phenolic content due to pressurization was also verified by Santos et al. (2020) [11],        6 of
                                                        but at different levels. The time between fresh fruit cutting and pressure processing is
                                                        an important factor, and further studies on this subject should be developed since the
                                                        longer storage time between cutting and pressure processing showed higher levels of total
                                                        phenolic compounds [39].

                                                         a                      b                                              B
                                                                                                       A
                                              80
                  Total phenolic compounds
                   (mg CAE. g-1 dry matter)

                                              60

                                              40

                                              20

                                              0
                                                        PS                    PPS                      PC                    PPC
                                                                                       Samples
             Figure 1. Total phenolic content in pineapple shell (PS) and pineapple core (PC) samples before and after pressurization
             (shell, PPS; core, PPC). Error bars represent ± standard deviation (n = 9). Different letters express significant differences
  Figure 1. Total  phenolic
             between           content
                       pineapple          in pineapple
                                  shell (lowercase letters)shell (PS) andcore
                                                            and pineapple pineapple    core (PC)
                                                                              samples (capital       samples before and after pressurization
                                                                                               letters).
  (shell, PPS; core, PPC). Error bars represent ± standard deviation (n = 9). Different letters express significant differences
  between pineapple shell (lowercase letters) and pineapple core samples (capital letters).

                                                        Regarding the antioxidant activity, evaluated by DPPH, FRAP, and ABTS metho
                                                   (Figure 2), it is possible to verify that the PC has higher values for DPPH (34.80–36.
FOR PEER REVIEW                                                                                                                     7 of 17

      Molecules 2021, 26, 3216                                                                                                            6 of 17
              values were 4.8 ± 0.10 µmol Trolox equivalent.g−1, 6.2 ± 0.26 µmol Trolox equivalent.g−1
              and 7.7 ± 0.90 µmol Trolox      equivalent.g−1 (dry mass) for the DPPH, FRAP, and ABTS meth-
                                         The values of total phenolic content are commonly expressed in gallic acid, but in
              ods, respectively [25].   A study
                                   the present         carried
                                                   work,         outexpressed
                                                          they are     with 26 in pineapple
                                                                                     chlorogenic genotypes
                                                                                                   acid since it from
                                                                                                                    is theChina
                                                                                                                           major ob-
                                                                                                                                   phenolic
              tained mean valuescompound
                                     (fresh weight)        of antioxidant
                                                  in pineapple  samples [40]. activity     by the
                                                                                The phenolic        DPPH
                                                                                               content  in themethods
                                                                                                                PBP reportedof 12.20
                                                                                                                                 by Campos
                                   et al. (2020)
              µmol Trolox equivalent.       g−1 and[29] ABTS
                                                        was 1.31ofmg  ·L−1µmol
                                                                   8.35     in coreTrolox
                                                                                    juice and  0.85 mg·L−1gin
                                                                                            equivalent.           shell juice,
                                                                                                               −1 [43].        expressed in
                                                                                                                         In another
                                   chlorogenic acid equivalent.
              study, the antioxidant activity of pineapples was determined by the DPPH method and
                                         Regarding the antioxidant activity, evaluated by DPPH, FRAP, and ABTS methods
              quantified 5.03 µmol      Trolox.g
                                   (Figure
                                                     −1 sample, dry weight basis [44]. Considering the studies
                                             2), it is possible to verify that the PC has higher values for DPPH (34.80–36.45 µmol
              mentioned above, it  Trolox.g   −
                                      can be concluded
                                                1  dry matter), that
                                                                  FRAP   exists  some typical
                                                                           (25.60–27.09    µmol Trolox.g    − 1 dry
                                                                                                    variation      of matter)
                                                                                                                        antioxidant
                                                                                                                                 and ABTS
                                   (41.43–42.19                      − 1
                                                           Trolox.g of dry
              activity of these samples,            µmolbecause
                                             not only                     the matter)   thanof
                                                                               variability    thethePSbiomass
                                                                                                        for DPPH    but(28.01–29.15
                                                                                                                          the differ-µmol
                                   Trolox.g−1 dry matter), FRAP (19.79–20.62 µmol Trolox.g−1 dry matter), and ABTS
              ences in the methods used. Another study −also                 carried out with pineapple fruit obtained
                                   (38.55–39.73 µmol Trolox.g −11 dry matter). These results are in agreement with the
              antioxidant activityresults
                                     of 53.42      µmolforTrolox.g
                                             obtained        PS and core  sample     (dry
                                                                             juices by      matter)
                                                                                        Campos         by(2020)
                                                                                                   et al.   the DPPH
                                                                                                                   [29]. Themethod
                                                                                                                               antioxidant
              [45]. In general, theactivity
                                     valuesof of theantioxidant       activityshowed
                                                      PPS and PPC samples        obtained     in values
                                                                                          higher  the samples
                                                                                                           than the of    pineapple
                                                                                                                      antioxidant   activity
              fruits are lower thanof the   values obtainedshell
                                       the non-pressurized          for samples
                                                                         the antioxidant      activity
                                                                                   by the DPPH,      FRAP,in and
                                                                                                              the ABTS
                                                                                                                    present     study The
                                                                                                                            methods.
                                   pressure
              for the PBP (shell and           treatment
                                          core).    The PBP in the  PS promoted
                                                                 presented           a significant
                                                                                attractive           increase (p
                                                                                             compounds              < 0.05)
                                                                                                                 that   make of 4%  (DPPH
                                                                                                                                 their
                                   and FRAP) and 3% (ABTS) in the antioxidant activity and in PC, the pressure treatment
              recovery very interesting.
                                   promoted a significant enhancement (p < 0.05) 5, 6, and 2% by the DPPH, FRAP, and
                                                                 ABTS methods, respectively (Figure 2).

                                                        50
                   TEAC (µmol Trolox. g-1 dry matter)

                                                                                                                  ❶             ❷
                                                                       ①                     ②
                                                        40                                                            B
                                                                                                         A
                         Antioxidant activity

                                                             a                     b
                                                        30                                                   I            II

                                                                   i                    ii
                                                        20

                                                        10

                                                         0
                                                                  PS                   PPS                   PC           PPC
                                                                                               Samples

                                                                                 DPPH        FRAP   ABTS
            Figure 2. Antioxidant activity in pineapple shell (PS) and pineapple core (PC) samples, before and after pressurization (shell:
            PPS; core: PPC), by methods: (a) DPPH (2,2-diphenyl-1-picrylhydrazyl), (b) FRAP (Ferric Reducing Antioxidant Power),
               Figure 2. Antioxidant activity in pineapple shell (PS) and pineapple core (PC) samples, before and
            and (c) ABTS (2,20 -azino-bis(3-ethylbenzothiazoline-6-sulphonic acid)). The results were expressed by Trolox Equivalent
               after pressurization (shell: PPS; core: PPC), by methods: (a) DPPH (2,2-diphenyl-1-picrylhydrazyl),
            Antioxidant Capacity (TEAC). Error bars represent ± standard deviation (n = 9). Statistical analysis express significant
               (b) FRAP (Ferric Reducing Antioxidant Power), and (c) ABTS (2,2′-azino-bis(3-ethylbenzothia-
            differences between pineapple shell and pressurized pineapple shell for DPPH (lowercase letters), FRAP (lowercase roman
               zoline-6-sulphonic
            numeral)   and ABTS (whiteacid)).
                                        ordinalThe  results
                                                number),  andwere    expressed
                                                               between  pineappleby  Trolox
                                                                                  core        Equivalent
                                                                                       and pressurized      Antioxidant
                                                                                                       pineapple            Capacity
                                                                                                                  core for DPPH   (capital
               (TEAC).    Error  bars represent    ± standard    deviation   (n =  9).
            letters), FRAP (capital roman numeral), and ABTS (black ordinal number).   Statistical analysis  express    significant
              differences between pineapple shell and pressurized pineapple shell for DPPH (lowercase letters),
                                        The increase
              FRAP (lowercase roman numeral)      andpromoted
                                                       ABTS (whiteby abiotic stress
                                                                        ordinal      in antioxidant
                                                                                 number),              activitypineapple
                                                                                             and between        was less than
                                                                                                                           corethe ob-
                                   servedcore
              and pressurized pineapple   by Santos et al. (2020)
                                               for DPPH           [11].
                                                            (capital    The antioxidant
                                                                     letters),            activityroman
                                                                               FRAP (capital        for PS numeral),
                                                                                                           and PC samples
                                                                                                                      and obtained
                                   in a present
              ABTS (black ordinal number).      study  agree  with  the  results for  DPPH    (shell: 20.43–35.01  µmol   Trolox.g−1
                                                                                  −1
                                  dry matter; core: 33.94–41.34 µmol Trolox.g dry matter), FRAP (shell: 23.84–39.85 µmol
                                  Trolox.g−1 dry matter; core: 24.17–34.76 µmol Trolox. g−1 dry matter) and ABTS (shell:
              2.4. Bromelain Activity
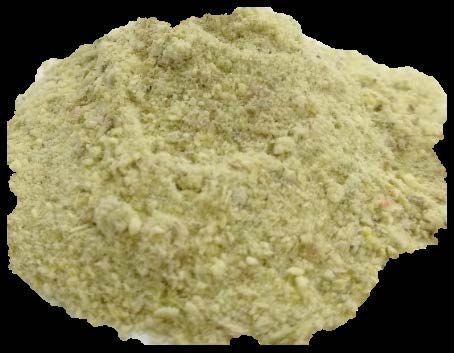
                                  28.67–48.78 µmol Trolox.g−1 dry matter; core: 30.87–48.32 µmol Trolox.g−1 dry matter).
                   As can be seen in Figure 3, bromelain activity is higher in the PS samples (18.73–19.90
              mg tyrosine.min−1.g−1 dry matter) than in the PC samples (7.14–9.45 mg tyrosine.min−1.g−1
              dry matter). The results obtained are in accordance with the range of values determined
              for PS (15.71–27.65 mg tyrosine.min−1.g−1 dry matter) and PC (5.09–16.81 mg tyro-
              sine.min−1.g−1 dry matter) samples developed by Santos et al. (2020) [11].
Molecules 2021, 26, 3216                                                                                             7 of 17

                                 Pressurization implies a significant increase in antioxidant activity. The use of abiotic
                           stresses by technologies such as wounding, heat treatment, and UV radiation to improve
                           phenolic compounds and antioxidant activity has been studied in other foods, namely in
                           carrots [41,42]. A possible explanation for the lower values in the present study may be
                           the shorter time between the cutting of the fruits and the processing of the by-products by
                           hydrostatic pressure. The time between cutting and processing influences enzymatic activ-
                           ity and is reflected in the response of enzymes to stress. The determination of antioxidant
                           activity in PBP is still poorly studied, some studies have used different extraction methods
                           and reported in different units, which does not allow the comparison of values.
                                 The characterization of the pineapple fruit is more frequently performed than that
                           of PBP. The pineapple extracted with ethanol yielded antioxidant activity values (dry
                           mass) of 1.7 ± 0.19 µmol Trolox equivalent. g−1 , 2.5 ± 0.0.13 µmol Trolox equivalent.
                           g−1 and 1.7 ± 0.20 µmol Trolox equivalent. g−1 for the DPPH, FRAP, and ABTS methods,
                           respectively. In case of the same samples extracted with methanol: acetone, the antioxi-
                           dant activity values were 4.8 ± 0.10 µmol Trolox equivalent.g−1 , 6.2 ± 0.26 µmol Trolox
                           equivalent.g−1 and 7.7 ± 0.90 µmol Trolox equivalent.g−1 (dry mass) for the DPPH, FRAP,
                           and ABTS methods, respectively [25]. A study carried out with 26 pineapple genotypes
                           from China obtained mean values (fresh weight) of antioxidant activity by the DPPH
                           methods of 12.20 µmol Trolox equivalent. g−1 and ABTS of 8.35 µmol Trolox equivalent.
                           g−1 [43]. In another study, the antioxidant activity of pineapples was determined by the
                           DPPH method and quantified 5.03 µmol Trolox.g−1 sample, dry weight basis [44]. Consid-
                           ering the studies mentioned above, it can be concluded that exists some typical variation
                           of antioxidant activity of these samples, not only because of the variability of the biomass
                           but the differences in the methods used. Another study also carried out with pineapple
                           fruit obtained antioxidant activity of 53.42 µmol Trolox.g−1 sample (dry matter) by the
                           DPPH method [45]. In general, the values of antioxidant activity obtained in the samples
                           of pineapple fruits are lower than the values obtained for the antioxidant activity in the
                           present study for the PBP (shell and core). The PBP presented attractive compounds that
                           make their recovery very interesting.

                           2.4. Bromelain Activity
                                As can be seen in Figure 3, bromelain activity is higher in the PS samples (18.73–19.90
                           mg tyrosine.min−1 ·g−1 dry matter) than in the PC samples (7.14–9.45 mg tyrosine.min−1 ·g−1
                           dry matter). The results obtained are in accordance with the range of values deter-
                           mined for PS (15.71–27.65 mg tyrosine.min−1 ·g−1 dry matter) and PC (5.09–16.81 mg
                           tyrosine.min−1 ·g−1 dry matter) samples developed by Santos et al. (2020) [11].
                                The effect of pressurization on the bromelain activity, very evident in the study
                           conducted by Santos et al. (2020) [11] (134% for PS and 350% for PC), was less marked in
                           the present study, despite being positive. Bromelain activity increased for PPS (6%) and
                           PPC (32%) samples, compared to untreated PS and PC samples, respectively. The effect of
                           hydrostatic pressure on bromelain activity is still poorly studied and further studies are
                           needed. The time and temperature at which the by-products are subjected after minimal
                           processing of the fruit and before pressurization must be optimized. Some studies have
                           been developed through the application of other abiotic stresses in vegetables and its
                           effect on enzymatic activity (increase in PAL enzyme), and consequently in total phenolic
                           compounds and antioxidant activity [39].
                                Given that bromelain is commonly ingested in the form of a pill or capsule (134.33 ± 1.34 mg
                           tyrosine.min−1 ·g−1 dry matter), the ingestion of 7 g of dehydrated PS by-products allows
                           obtaining the amount of bromelain equivalent to a pill. In the case of dehydrated PC, it
                           would be necessary to consume a double approach. Ingesting PBP could suppress the need
                           for bromelain pills to treat some diseases or promote health.
compounds and antioxidant activity [39].
                                    Given that bromelain is commonly ingested in the form of a pill or capsule (134.33 ±
                               1.34 mg tyrosine.min−1.g−1 dry matter), the ingestion of 7 g of dehydrated PS by-products
                               allows obtaining the amount of bromelain equivalent to a pill. In the case of dehydrated
Molecules 2021, 26, 3216
                               PC, it would be necessary to consume a double approach. Ingesting PBP could suppress   8 of 17
                               the need for bromelain pills to treat some diseases or promote health.

                                                                          25                      a

                                   (mg tyrosine. min-1. g-1 dry matter)
                                                                                      a
                                                                          20

                                           Bromelain activity
                                                                          15

                                                                                                                             B
                                                                          10
                                                                                                                      A

                                                                           5

                                                                           0
                                                                                     PS          PPS                  PC    PPC
                                                                                                          Samples

                                   Figure 3. Bromelain activity in pineapple shell (PS) and pineapple core (PC) samples before and after
                                   pressurization
                               Figure   3. Bromelain (shell: PPS;
                                                       activity in core: PPC).shell
                                                                   pineapple   Error(PS)
                                                                                      bars represent
                                                                                         and         ± standard
                                                                                              pineapple   core (PC)deviation   (n = 9).and
                                                                                                                    samples before      Different
                               afterletters express significant
                                      pressurization             differences
                                                       (shell: PPS;          between
                                                                    core: PPC).        pineapple
                                                                                Error bars        shell±(lowercase
                                                                                            represent               letters) and
                                                                                                         standard deviation    (n pineapple
                                                                                                                                  = 9). Dif- core
                               ferent  letters(capital
                                   samples     expressletters).
                                                        significant differences between pineapple shell (lowercase letters) and pine-
                               apple core samples (capital letters).
                                   2.5. Microbiology (Aerobic Colony Counts, Yeasts, and Moulds)
                               2.5. Microbiology   (Aerobic
                                          The results        Colony
                                                       obtained       Counts,
                                                                 for the       Yeasts, and
                                                                          enumeration    of Moulds)
                                                                                            microorganisms in the samples are shown
                                   inThe
                                      Table   3. The  PS  showed    levels  of mold   considered   unsatisfactory         3 CFU·g−1 ) for
                                                                                                                    (>10samples
                                           results obtained for the enumeration of microorganisms               in the               are
                                   fruitinproducts
                               shown       Table 3.[46],
                                                     The both  in raw levels
                                                          PS showed     samples   as pressurized.
                                                                               of mold   considered However,  the PC(>10
                                                                                                      unsatisfactory    samples    showed
                                                                                                                             3 CFU.g  −1)

                               for fruit products [46], both in raw samples as pressurized. However, the PC samplesthe
                                   satisfactory   values  for the three   quality criteria  analyzed,  although   also regardless    of
                                   pressurization
                               showed                treatment.
                                          satisfactory  values forAs
                                                                   thea suggestion
                                                                        three qualitytocriteria
                                                                                        reduceanalyzed,
                                                                                                the levelsalthough
                                                                                                           of mold in    theregardless
                                                                                                                      also    PS, it would
                               of the pressurization treatment. As a suggestion to reduce the levels of mold in the PS,fruits
                                   be interesting   to  intensify  or  improve   the  washing    and  disinfection  of  pineapple      it
                                   before
                               would    be cutting  in the
                                            interesting  to minimally
                                                            intensify or processed
                                                                           improveindustry.
                                                                                      the washing and disinfection of pineapple
                               fruits before cutting in the minimally processed industry.
      Table 3. Microbiological characterization of the samples (aerobic colony count, mold and yeast enumeration) in the samples:
      pineapple shell (PS), pressurized pineapple shell (PPS), pineapple core (PC), and pressurized pineapple core (PPC). Mean
      values ± mean difference, n = 2.

                                                              Aerobic Colony Count                      Mould Count           Yeast Count
             Samples
                                                                   (CFU·g−1 )                            (CFU·g−1 )            (CFU·g−1 )
                 PS                                                       4.10 (±2.0) × 104            2.30 (±0.1) × 104    3.85 (±1.6) × 104
                PPS                                                       3.25 (±0.2) × 104            5.25 (±0.1) × 104    1.50 (±0.1) × 103
                PC                                                        1.90 (±0.6) × 102            2.00 (±0.1) × 102      1 (±0.0) × 102
                PPC                                                       1.20 (±0.1) × 102            2.00 (±0.0) × 102           103

                                   2.6. Mycotoxins
                                       The quantification of mycotoxins aflatoxin B1 , aflatoxin B2 , aflatoxin G1 , aflatoxin G2 ,
                                   ochratoxin A, and patulin in PS and PC can be seen in Table 4.
Molecules 2021, 26, 3216                                                                                                         9 of 17

      Table 4. Results of mycotoxins quantification (aflatoxin B1 , aflatoxin B2 , aflatoxin G1 , aflatoxin G2 , ochratoxin A, and
      patulin) in the samples: pineapple shell (PS), pressurized pineapple shell (PPS), pineapple core (PC), and pressurized
      pineapple core (PPC). * Corrected results for the recovery rate; DL, detection limit; QL, quantification limit.

   Samples             Mycotoxin results        Aflatoxin B1   Aflatoxin B2   Aflatoxin G1   Aflatoxin G2   Ochratoxin A     Patulin
                        Result (µg/kg)
Molecules 2021, 26, 3216                                                                                           10 of 17

                           FRAP, and ABTS); bromelain activity; microbial content (total mesophilic microorganisms,
                           yeasts, and molds); and mycotoxins (aflatoxin B1 , aflatoxin B2 , aflatoxin G1 , aflatoxin G2 ,
                           ochratoxin A, and patulin).

                           3.2.1. Color
                                The color was evaluated on the surface of PBP powder with a Minolta CR 300 (Konica
                           Minolta, Osaka, Japan) using the L*, a*, b* coordinates (CIELab color system). The calibra-
                           tion was performed with a white ceramic reference (standard illuminant D65). The color
                           was evaluated ten times on each pineapple by-product sample and the color parameter
                           value resulted from the arithmetic mean of ten measurements.

                           3.2.2. Moisture Content and Water Activity (aw )
                               The water content of the samples was determined gravimetrically by mass loss in an
                           oven at 105 ± 1 ◦ C until constant weight, in three replicates. Water activity was determined
                           using a Rotronic HygroPalm HP23-A equipment, Bassersdorf, Switzerland (20 ◦ C).

                           3.2.3. Caloric Value
                                 Energy was calculated by the complete combustion of samples in an adiabatic calorime-
                           ter (Parr 1261; Parr Instrument Company, Moline, IL, USA) [50].

                           3.2.4. Protein
                                 Protein analysis was performed by the Kjeldhal method using equipment with a
                           semi-automatic Kjeltec system, Effretikon (Zurich), Switzerland, according to the AOAC
                           920.152 official method for fruit products [51]. The determination of crude protein occurred
                           in three phases. The first was digestion, 1 g of sample was added with kjeltab and sulfuric
                           acid, and then it was placed in the digestion unit at 400 ◦ C for 60 min. The second step was
                           distillation; the solution was placed in the distillation unit that added distilled water and
                           NaOH solution (50%). The distillate was collected in 1% boric acid with an indicator, and
                           titration was performed with 0.1 mol·L−1 HCl solution. The protein determination was
                           performed in triplicate.

                           3.2.5. Carbohydrates
                                 The determination of total carbohydrates was performed by the phenol-sulphuric acid
                           method with some modifications [52]. Briefly, the samples (50 mg) were reconstituted with
                           distilled water [28] and extracted four times with 10 mL ethanol (80%) in sealed tubes by
                           boiling at 95 ◦ C for 10 min in a water bath. After each extraction, the tubes were centrifuged
                           at 2500 rpm for 5 min, and the supernatants of the four extractions were combined. The
                           extract samples were mixed with phenol (5%) and concentrated sulfuric acid. The color was
                           developed after 10 min in a dark place and 20 min of cooling in a water bath at 25–30 ◦ C.
                           The absorbance was measured at 490 nm against a reagent blank on a spectrophotometer.
                           The total carbohydrates were defined by a standard curve of D-glucose. Each sample was
                           replicated six times.

                           3.2.6. Dietary Fiber
                                The determination of the total, soluble and insoluble dietary fiber contents of PS and
                           PC were carried out according to the AOAC 991.43 method [53]. Dietary fiber was analyzed
                           using the fiber assay kit (Megazyme K-TDFR, Wicklow, Ireland). In the PC samples,
                           the sugar was extracted before determining the dietary fiber. The sample extraction
                           (10 mL·g−1 ) was performed with 85% ethanol, centrifuged at 8000 rpm for 20 min, and the
                           pellet was collected. This process was repeated three times, and subsequently, the sample
                           was dried overnight at 40 ◦ C. The content of the dietary fiber was corrected for residual
                           protein (Kjeldahl method), ash, and white. The PC samples were also corrected for the
                           sugar fraction removed. The fiber was performed six times and the average was used for
                           each condition.
Molecules 2021, 26, 3216                                                                                           11 of 17

                           3.2.7. Ash Content
                                Ash content was determined gravimetrically by incineration at 550 ◦ C in a muffle
                           furnace (Heraeus 260E, Katzwinkel, Germany) according to the AOAC 940.26 method [51].
                           The ash was carried out in triplicate and the average was used for each condition.

                           3.2.8. Minerals
                                The mineral content was evaluated by inductively coupled plasma spectrometry (ICP)
                           (iCAP Spectrometer equipped with ASX-520 AutoSampler (Thermo Scientific, Waltham,
                           MA, USA)). The lyophilized sample (0.25 g) was transferred to digestion vessels, 9 mL of
                           HCl and 3 mL of nitric acid (HNO3 ) were added. Digestion took place in several stages:
                           (1) 30 min/40 ◦ C, (2) 30 min/80 ◦ C, and (3) 90 min/105 ◦ C in the SCP Science equipment
                           (DigiPREP MS, Baie d’Urfe, QC, Canada).
                                After cooling, 50 mL of distilled water was added before being decanted. The cleared
                           supernatant was used in inductively coupled plasma to determine the elements (sodium,
                           potassium, calcium, magnesium, phosphorus, sulfur, iron, copper, zinc, manganese, and
                           boron). The analyses were repeated in triplicate.

                           3.2.9. Pineapple Extract Preparation for Total Phenolic Content and Antioxidant Activity
                                 The PBP extract was prepared by the procedure of Heredia and Cisneros-Zevallos
                           (2009) and Swain and Hillis (1959) [54,55]. The extraction was performed in a ratio of 1:10
                           (w:v) of three PBP independent samples and methanol (100%) followed by Ultra-Turrax
                           homogenizer at 8000 rpm for 2 min. The homogenates were incubated overnight (12–24 h)
                           at 4 ◦ C. Subsequently, the extracts were centrifuged at 8000 rpm for 20 min (4 ◦ C), and the
                           supernatants were stored at 4 ◦ C, protected from light until analysis.

                           Total Phenolic Content (TPC)
                                 The total phenolic content (TPC) was determined according to Heredia and Cisneros-
                           Zevallos (2009), and Swain and Hillis (1959) [54,55]. The extract aliquots (150 µL) were
                           diluted with 2400 µL nanopure water, mixed with 150 µL Folin-Ciocalteu reagent (Panreac
                           AppliChem, Germany) (0.25 mol·L−1 ). The reaction was interrupted by adding 300 µL
                           sodium carbonate (1 mol·L−1 ) and the mixture was incubated (2 h). The samples were read
                           at 725 nm in a spectrophotometer (UNICAM UV/Vis Spectrometer, United Kingdom). The
                           total phenolics content was determined by a standard curve of chlorogenic acid equivalents
                           (CAE) and expressed as mg CAE·g−1 dry weight. Each extract was analyzed in triplicate
                           and the average was used for each condition.

                           Antioxidant Activity (DPPH, FRAP, and ABTS)
                                The antioxidant capacity by DPPH (2,2-diphenyl-1-picrylhydrazyl) method was eval-
                           uated following the procedure of Brand-Williams et al. (1995) [56]. The DPPH solution was
                           prepared with DPPH reagent (Sigma–Aldrich, Darmstadt, Germany) diluted in methanol
                           until reaching 1.1 units of absorbance at 515 nm. The supernatant (100 µL) was combined
                           with 3.9 mL DPPH solution, and the reaction occurred for 40 min. The samples were read
                           at 515 nm using a spectrophotometer (UNICAM UV/Vis Spectrometer).
                                The FRAP (ferric reducing antioxidant power) test was performed according to Benzie
                           and Strain (1996) [57]. The reaction initiated with the mixture of the FRAP solution (2.7 mL),
                           270 µL nanopure water with the extract samples (90 µL), and afterwards, warmed in a
                           water bath at 37 ◦ C for 30 min. The colored product (ferrous tripyridyltriazine complex)
                           was read at 595 nm.
                                Antioxidant activity was also measured using ABTS (2,20 -azino-bis(3-ethylbenzothiazoline-
                           6-sulphonic acid)) method as described by Re et al. (1999) and Rufino et al. (2007) [58,59].
                           The reaction was performed by mixing 2970 µL ABTS solution (Sigma–Aldrich, Germany)
                           with sample aliquots (30 µL) for 6 min, and the absorbance at 734 nm was read. The
                           antioxidant activity (DPPH, FRAP e ABTS) was determined using Trolox (Acros Organics,
                           Belgium), and the results were expressed by Trolox Equivalent Antioxidant Capacity
Molecules 2021, 26, 3216                                                                                              12 of 17

                           [TEAC (µmol Trolox.g−1 dry matter)]. For each antioxidant determination method (DPPH,
                           FRAP, and ABTS), each extract was analyzed in triplicate and the average was used for
                           each condition.

                           3.2.10. Bromelain Activity
                                The bromelain assay was established according to Chakraborty et al. (2014) [60]
                           with some modifications. The reaction involved 50 µL enzyme extract (from PBP) and
                           1150 µL casein 1% (w/v) (Sigma–Aldrich, Germany) solution in glycine 0.1 mol·L−1 (Sigma–
                           Aldrich, Germany) and 25 mmol·L−1 cysteine (Sigma–Aldrich, Germany). The mixture
                           was incubated in a shaking water bath (10 min at 37 ◦ C) and the reaction was stopped
                           by adding 1.8 mL trichloroacetic acid 5% (w/v). The assay mixture was filtrated with a
                           syringe filter (0.45 µm) and the absorbance measurement was performed at 280 nm. The
                           bromelain activity was calculated using a tyrosine (Alfa Aesar, Lancashire, UK) standard
                           curve and expressed as the amount of tyrosine on a dry weight basis reported as µmol
                           tyrosine. min−1 ·g−1 dry weight.

                           3.2.11. Microbiological Analysis (Aerobic Colony Count, Yeasts and Molds)
                                For the enumeration of mesophiles (aerobic colony count) of yeasts and molds, 10 g
                           of each sample was aseptically weighed into   sterile
                                                                     Molecules    BagFilters
                                                                               2021,            (Interscience,
                                                                                     26, x FOR PEER  REVIEW France), and
                           90 mL of Ringer Solution (RS) was added. Samples were homogenized using a paddle
                           blender, 85 rpm for 30 s. Afterwards, decimal dilutions were made with RS diluent
                           according to ISO Standard [61]. The aerobic colony count was performed according to ISO
                           4833:2003 [62], incorporating 1 mL of the respective decimal dilution in PlateEnumeration
                                                                                                                Count Agar of molds
                                                                                                         spreading
                           medium (Biokar Diagnostics, Beauvais, France) and incubating for 72 ± 3 h at 30 ±        0.11 mL
                                                                                                                         ◦ C. of the res
                                                                                                         Agar  (GYP).
                                Enumeration of molds and yeasts was carried out based on ISO 21527-2:2008 [63], by     Subsequently,
                           spreading 0.1 mL of the respective decimal dilution onto plates of Glucose    ing the colonies
                                                                                                             Yeast Peptone  (CFU) of m
                                                                                                      ◦
                           Agar (GYP). Subsequently, the plates were incubated at (25 ± 1) C for 5 days before
                           counting the colonies (CFU) of molds and yeasts per gram of sample. 3.2.12. Mycotoxins

                           3.2.12. Mycotoxins                                                            Aflatoxins and Ochratoxin
                           Aflatoxins and Ochratoxin A                                                        The extraction of aflat
                                 The extraction of aflatoxins (B1 , B2 , G1 , and G2 ) and ochratoxin A was  carriedof
                                                                                                        in samples     out  with 10 g o
                                                                                                                          PBP
                           was carried out with 10 g of sample and 50 mL of methanol/water (80:20,      was   filtered
                                                                                                          v/v).         using folded f
                                                                                                                  The extract
                           was filtered using folded filter paper and a 10 mL aliquot was dilutedbuffered           saline to 100 mL, f
                                                                                                          with phosphate-
                                                                                                        in an
                           buffered saline to 100 mL, filtered once again with a glass microfiber filter,   andimmunoaffinity
                                                                                                                  introduced       colu
                           in an immunoaffinity column containing specific antibodies to aflatoxinsAand    (AflaOchra,
                                                                                                               ochratoxin  Vicam).
                                                                                                                             A      The
                           (AflaOchra, Vicam). The elution was carried out with 1.6 mL methanol (HPLC           grade), with
                                                                                                        with successive     dilution w
                           successive dilution with water to 10 mL (16:84, v/v). A volume (800 µL)into    wastheinjected
                                                                                                                   HPLCintosystem.
                           the HPLC system.                                                                   HPLC analysis was p
                                 HPLC analysis was performed using a Waters Alliance 2695 equipment          with fluorescence
                                                                                                        ters 2475    a Waters       dete
                           2475 fluorescence detector (Waters, Milford, MA, USA) with Empower Chromatography
                                                                                                        raphy Software.   Soft-
                                                                                                                              Post-colum
                           ware. Post-column derivatization was performed with electrochemically generated           bromine
                                                                                                        erated bromine       (Kobra cel
                           (Kobra cell, R-Biopharm). The chromatographic column was a Prodigy ODS 100 Ǻ (5 µm,            µm, 150 × 4
                           150 × 4.6 mm, Phenomenex, Torrance, CA, USA). The mobile phases were awere           a gradient
                                                                                                          gradient   involvedinvolved
                                                        − 1                                   − 1
                           with a flow rate of 1 mL·min between phase A [KBr (175 mg·L )/MeOH/MeCN/C    mg.L )/MeOH/MeCN/C            2H
                                                                                                                       2 H4 O2
                                                                                                               −1

                           (1650:465:390:50)] and phase B [KBr (175 mg·L−1)/MeOH/ MeCN/C2H4O2mg.L        (140:1283:1073:50)].
                                                                                                               −1)/MeOH/MeCN/C2H

                           The temperatures of the automatic sampler were maintained at 10 ◦ C and         the temperature
                                                                                                        sampler     were maintained a
                           of the chromatography column at 35 ◦ C. The total run time was 59 min. The        wavelength
                                                                                                        35 °C.              of time w
                                                                                                                 The total run
                           the fluorescence detector was 365 and 322 nm (excitation), and 465 and and    468 nm
                                                                                                             322 (emission)
                                                                                                                   nm (excitation), an
                           for aflatoxins and ochratoxin A, respectively (Martins et al., 2018; Sizoo respectively
                                                                                                         and Van Egmond,(Martins et al.
                           2005) [64,65].
                                                                                                        Patulin
                                                                                                              Stock solution with 20
                                                                                                         etate, stored at −20 °C, and
                                                                                                         ethanol for the formulation
                                                                                                         standard concentration sol
                                                                                                         blank, applying the molar
                                                                                                         luted with acetic acid (0.1%
                                                                                                         200 µg.L−1.
Molecules 2021, 26, 3216                                                                                         13 of 17

                           Patulin
                                 Stock solution with 200 mg·L−1 of patulin (Sigma–Aldrich) was prepared in ethyl
                           acetate, stored at −20 ◦ C, and when required, some volume was evaporated and diluted
                           with ethanol for the formulation of an intermediate standard solution. The patulin interme-
                           diate standard concentration solution was determined by UV at 276 nm, compared to a
                           solvent blank, applying the molar extinction value. The intermediate standard solutions
                           were diluted with acetic acid (0.1%) with the aim of develop final concentrations between 2
                           and 200 µg·L−1 .
                                 The HPLC equipment was a Waters Alliance 2695 system equipped with a photodiode
                           array detector (Waters 2996), set at 276 nm and with a 2000 µL loop. Data compilation
                           and following processing were performed utilizing the Empower II software. A stainless
                           steel analytical column (250 × 4.6 mm i.d., 4 µm, SynergyHydro-RP C18; Phenomenex,
                           Tecnocroma, Portugal) preceded by a guard column (4 × 3 mm i.d.) with the equal
                           stationary phase was applied. The mobile phase, eluting at a flow rate of 1 mL·min−1 ,
                           contained an isocratic blend of water–acetonitrile–perchloric acid (96:4:0.1) for 20 min
                           followed by a gradient washing (5 min) stage, which begins with a concentration of
                           acetonitrile (100%) and closes with acetonitrile (65%) in water. Two hundred microliters
                           were injected onto the HPLC column.
                                 Patulin was extracted from the samples of PBP using ethyl acetate solvent in the
                           presence of sodium sulfate and sodium hydrogen carbonate. The extracts were cleaned (or
                           purified) using a solid-phase extraction of unconditioned silica gel (SPE) column (Strata Si
                           500 mg/3 mL, Phenomenex, Tecnochroma, Portugal). The purified extract was evaporated,
                           dissolved again in aqueous acetic acid solution (pH 4), separated by reversed-phase (RP)
                           HPLC, and quantitatively determined by UV detection at 276 nm. The redissolved samples
                           were filtered with a membrane filter (Millex 0.45 µm, Millipore) and the filtrate transferred
                           to HPLC flasks. The samples were analyzed in duplicate and a third sample enriched
                           with patulin at 20 µg·kg−1 . The identification of the patulin peak of the sample extracts
                           was produced by comparison with the retention time of standard solutions and samples
                           fortified with patulin. Additional validation of patulin was achieved by comparing peak
                           spectra with standard spectra found under the same chromatographic requirements and
                           peak purity assessment [66,67].

                           3.3. Data Interpretation and Analysis
                                For each sample submitted to microbiological analysis, average values and respective
                           mean difference from duplicate plates were calculated. The guidelines for the microbio-
                           logical quality of ready-to-eat foods sampled at the point of sale of the National Institute
                           of Health, Dr. Ricardo Jorge, Portuguese Ministry of Health [46] were used for the in-
                           terpretation of the microbiological quality of the pineapple samples. Physicochemical
                           and enzymatic characterization data were statistically evaluated through the StatisticaTM
                           v.8 Software (StatSoft Inc., Tulsa, OK, USA 2007) from Statsoft (StatSoft Inc., Tulsa, OK,
                           USA) [68]. Tukey’s honest significant difference (HSD) test was applied to determine
                           the significant differences among means for different treatments. The accepted level of
                           significant differences was p < 0.05.

                           4. Conclusions
                                The dehydrated pineapple by-products (shell and core) from the minimally processed
                           industry showed significant levels of value-added compounds, namely dietary fiber, min-
                           erals, and phenols, and high values of bromelain activity. Abiotic stresses by moderate
                           hydrostatic pressure were demonstrated to be beneficial in enhancing total phenolic con-
                           tent, antioxidant activity, and bromelain activity without affecting the nutritional value.
                           The microbiological and mycotoxins results show that the core by-product have adequate
                           characteristics to be used as food ingredients, however, the shell needs to be subjected to
                           more efficient prior decontamination.
Molecules 2021, 26, 3216                                                                                                         14 of 17

                                       In conclusion, the re-incorporation of dehydrated pineapple core into the food chain
                                  as an ingredient rich in antioxidants and bromelain is of great interest, leading to a virtuous
                                  cycle of waste reduction, optimizing the use of natural resources and the preservation of
                                  the ecosystems, and creating value.

                                  Author Contributions: Conceptualization, D.I.S. and M.M.-M.; methodology, D.I.S., C.F.M., L.B. and
                                  M.M.-M.; formal analysis, D.I.S., C.F.M. and R.A.A.; investigation, D.I.S., C.F.M., L.B. and M.M.-
                                  M.; writing—original draft preparation, D.I.S., C.F.M. and R.A.A.; writing—review and editing,
                                  D.I.S., C.F.M., R.A.A., L.B., J.A.S., A.A.V. and M.M.-M.; supervision L.B., J.A.S., A.A.V. and M.M.-
                                  M.; funding acquisition L.B., J.A.S., A.A.V. and M.M.-M. All authors have read and agreed to the
                                  published version of the manuscript.
                                  Funding: The first author acknowledges the financial support from Fundação para a Ciência e a
                                  Tecnologia (FCT), Portugal, through a PhD grant (SFRH/BD/109124/2015) and for financing the PhD
                                  grant of Renata A. Amaral (SFRH/BD/146009/2019). This work was supported by the national fund-
                                  ing of FCT, under the scope of the strategic funding to the research units LEAF (UIDB/04129/2020),
                                  LAQV-REQUIMTE Associate Laboratory (UIDB/50006/2020) and CEB (UIDP/04469/2020) through
                                  national funds and where applicable co-financed by the FEDER, within the PT2020 Partnership
                                  Agreement, and PDR2020-101-031856 ProEnergy—New food products and bioenergy from fruits of
                                  low commercial value and agro industrial wastes.
                                  Institutional Review Board Statement: Not applicable.
                                  Informed Consent Statement: Not applicable.
                                  Data Availability Statement: Not applicable.
                                  Acknowledgments: The authors acknowledge industrial partner Campotec, located in Torres Vedras,
                                  for supplying the pineapple by-products used in this study. The authors thank Ana Carla Silva for
                                  the support with the work performed in the Laboratory of Microbiology (ISA/ULisboa).
                                  Conflicts of Interest: The authors declare no conflict of interest.
                                  Sample Availability: Not available.

References
1.  Antoniolli, L.R.; Benedetti, B.C.; Souza Filho, M.S.M.; Borges, M.F. Avaliação da vanilina como agente antimicrobiano em abacaxi
    “Pérola” minimamente processado. Ciênc. Tecnol. Aliment. 2004, 24, 473–477. [CrossRef]
2.  Hossain, M.A.; Rahman, S.M.M. Total phenolics, flavonoids and antioxidant activity of tropical fruit pineapple. Food Res. Int.
    2011, 44, 672–676. [CrossRef]
3.  Hossain, M.F. Nutritional Value and Medicinal Benefits of Pineapple. Int. J. Nutr. Food Sci. 2015, 4, 84. [CrossRef]
4.  Debnath, P.; Dey, P.; Chanda, A.; Bhakta, T. A Survey on Pineapple and its medicinal value. Sch. Acad. J. Pharm. 2012, 1, 24–29.
5.  Corzo, C.A.; Waliszewski, K.N.; Welti-Chanes, J. Pineapple fruit bromelain affinity to different protein substrates. Food Chem.
    2012, 133, 631–635. [CrossRef]
6.  Chakraborty, S.; Rao, P.S.; Mishra, H.N. Empirical model based on Weibull distribution describing the destruction kinetics of
    natural microbiota in pineapple (Ananas comosus L.) puree during high-pressure processing. Int. J. Food Microbiol. 2015, 211,
    117–127. [CrossRef]
7.  Chakraborty, A.J.; Mitra, S.; Tallei, T.E.; Tareq, A.M.; Nainu, F.; Cicia, D.; Dhama, K.; Emran, T.B.; Simal-Gandara, J.; Capasso, R.
    Bromelain a Potential Bioactive Compound: A Comprehensive Overview from a Pharmacological Perspective. Life 2021, 11, 317.
    [CrossRef]
8.  Santos, D.I.; Correia, M.J.N.; Mateus, M.M.; Saraiva, J.A.; Vicente, A.A.; Moldão, M. Fourier transform infrared (FT-IR) spec-
    troscopy as a possible rapid tool to evaluate abiotic stress effects on pineapple by-products. Appl. Sci. 2019, 9, 4141. [CrossRef]
9.  Chobotova, K.; Vernallis, A.B.; Majid, F.A.A. Bromelain’s activity and potential as an anti-cancer agent: Current evidence and
    perspectives. Cancer Lett. 2010, 290, 148–156. [CrossRef] [PubMed]
10. Ketnawa, S.; Chaiwut, P.; Rawdkuen, S. Extraction of bromelain from pineapple peels. Food Sci. Technol. Int. 2011, 17, 395–402.
    [CrossRef]
11. Santos, D.I.; Pinto, C.A.; Corrêa-Filho, L.C.; Saraiva, J.A.; Vicente, A.A.; Moldão-Martins, M. Effect of moderate hydrostatic
    pressures on the enzymatic activity and bioactive composition of pineapple by-products. J. Food Process. Eng. 2020, e13537.
    [CrossRef]
12. Santos, D.I.; Fraqueza, M.J.; Pissarra, H.; Saraiva, J.A.; Vicente, A.A.; Moldão-Martins, M. Optimization of the Effect of Pineapple
    By-Products Enhanced in Bromelain by Hydrostatic Pressure on the Texture and Overall Quality of Silverside Beef Cut. Foods
    2020, 9, 1752. [CrossRef] [PubMed]
You can also read