Poland up to 2022 Fish nor Fowl - Reintje Maasdam Economic Research Department
←
→
Page content transcription
If your browser does not render page correctly, please read the page content below
Poland up to 2022
               Fish nor Fowl

Reintje Maasdam
Economic Research Department

October 2011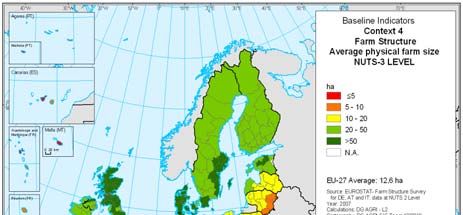
Table of contents
               Management Summary                                        3

               1.   History of Poland                                    7

               2.   People                                           10

               3.   Economy                                          21

               4.   Government                                       41

               5.   External position                                54

               6.   SWOT Analysis                                    60

               7.   Economic scenarios                               66

               Annex 1                                               78

               List of abbreviations                                 79

               Bibliography                                          80

               Colophon                                              85

        Economic Research Department can be found on the internet.
              The address is www.rabobank.com/economics

                    Completion date: 04 October 2011

October 2011                   Rabobank   Economic Research Department       2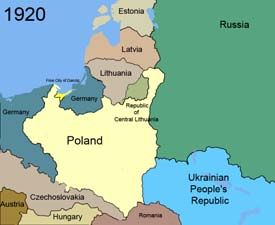
Management Summary

Next decade of Poland
The Country Risk Research team of Rabobank’s Economic Department presents
to you the study ‘Poland In depth: ten years ahead’. With this study we aim to
provide an in depth analysis of Poland and point out the key developments in the
next decade.

Why did we choose to look at the next decade? In a period of ten years, Poland
can alter structural aspects of its economy, such as the labour participation, its
pension system and euro adoption. This means that we can assume changes
that are not possible within 1 or 2 years, the general forecast period of a country
analysis. Clearly, the global financial and economic crises have shown that
forecasting the future is very difficult and the past is not always a predictor of
the coming years. Despite this, we would like to show you our ideas about the
current situation in Poland and the medium to long term developments.

Neither Fish nor Fowl
The main message is portrayed in the subtitle ‘Fish nor Fowl’. We see Poland as a
stable country, which is neither a crisis-prone, nor a very dynamic, booming
emerging market. It has some promising sectors, but also a lagging business
environment. It has well-educated workforce, but a mismatch with the deman-
ded skills. It is a young state, but has an ageing population. It has attractive low
labour costs, but relatively low labour productivity. It has a sustainable pension
system, but only very small pensions. It has a diversified economy, but the
labour market strongly relies on the agricultural and public sector. Etc, etc.

In the next decade, economic growth is expected to gradually decrease to a
level of around 3%. The main reasons for this rather low level are a declining
working-age population and a moderate productivity growth. In chapter 7, we go
into more detail on the long-term economic growth. In the same chapter, we
also discuss different scenarios, which result from several positive and negative
shocks: (1) increased labour participation, (2) higher emigration, (3) depre-
ciation of the zloty, (4) early EMU entry, and (5) higher oil price. The scenarios
show that the economy of Poland is rather robust. This is both positive, in the
sense that shocks are dampened, and negative, in the sense that acceleration is
not easy either. Again, it shows that Poland is neither very sensitive to shocks,
nor very dynamic.

In depth analysis
On the next page, a short summary is given of chapters 1-5; history of Poland,
people, economic structure, government and external position. Each section is
indicated by the underlined key phrase.

October 2011                      Rabobank    Economic Research Department           3
Management Summary

History of Poland
Poland has a scarred history. From being one of the powerful European States in
the 14th century, the country has spent much of the past two centuries under
foreign rule. The economic transition from communism towards a market
economy has been rapid. After initial contraction, economic growth boomed
during 1990s and accelerated again in the period 2003-2008. Dips in growth
were caused by overheating in the late 1990s and by the global financial crisis.

People
The demography of Poland is characterized by an ageing population. Around
2012, the active population will start to shrink. The Polish culture is strongly
linked to Central Europe and Poland is a homogenous society. Poland is a high
income country. The progress on the convergence path is slow, but steady.
Education is universal with many Poles attending higher education. However,
there is a mismatch between education and the labour market and soft skills are
generally not a strong point. Life-long learning is limited. The unit labour costs in
Poland compared favourably to other OECD countries, but labour productivity is
rather low. Labour productivity growth is expected to remain around 3% per
year in the next decade. Unemployment is stubbornly above 10%, but is
expected to decrease with the ageing population. Joblessness is higher among
well-educated, young people and among low-educated and older Poles. Rigidities
in the labour market are one of the reasons for the high structural unemploy-
ment. Restrictive regulation makes hiring and firing difficult, while early
retirement benefits distort labour supply. The labour participation rate is low.
Inactivity is highest among females, low-educated persons and the 50+ age
groups. EU accession boosted emigration, which partly absorbed Poland’s brain
overflow. In the future, Poland could become a net immigration country.

Economy
The structure of economic sectors in Poland is rather similar to more developed
countries, while the government and agriculture are large employers. The
agricultural sector in Poland is important for employment and exports. But with
low usage of capital, in parts of Poland extensive crop farming and under-
developed land rent system, there seems ample room for improvement. In the
industrial sector, the automotive and food processing sectors are important. The
combination of relatively low labour costs and abundance of (semi)skilled
workers and/or proximity to Germany makes Poland attractive to foreign
investment. The services sector has seen a rapid development in the past 20
years, helped by the growth of household spending power. The financial market
in Poland is the main financial centre in the region and is sizeable compared to
regional competitors. But the Polish financial market is still small and shallow
compared to developed countries. Liquidity and long-term finance are issues.
The banking sector is characterized by low, but growing usage – definitely a

October 2011                      Rabobank    Economic Research Department          4
Management Summary

growth market. As many as half of the Poles do not have a bank account, but in
many cities bank outlets are very prominent and numerous. The monetary policy
is determined by the Narodowy Bank Polski (NBP, Poland’s central bank). Its
primary objective is price stability. In the late 1990s, inflation was a major issue,
but it is generally considered under control now. The exchange rate is under an
occasionally managed, free floating regime. The zloty acts as a thermometer for
Central Europe. Euro adoption is still far away; 2018 seems a realistic option.
The business environment and institutional quality of Poland lags behind other
Central European countries. Important obstacles are skills availability, labour
regulation, excessive red tape and bureaucracy, and a slow judiciary system.
The main natural resources of Poland are coal, arable land and –potentially-
shale gas. Although promising in size, shale gas extraction is far from opera-
tional. In most areas of infrastructure, Poland is behind compared to other Euro-
pean countries. Energy security and environmental impact are hot topics, but
roads, electricity, water and waste water treatment also demand investment.
Environmental awareness has increased in the past years, helped by EU regu-
lation. Poland still faces significant issue related to soil, water and air pollution
and it scores poorly on energy intensity and CO2 emissions.

Government
The central government consists out of a bicameral parliament with political
power concentrated in the cabinet. The president has a largely ceremonial role.
The political landscape is dominated by the centre-right, liberal PO party and
conservative, state-oriented PiS party. Although there is consensus on the
general direction of Poland, there are major differences on certain topics, such
as euro adoption, the pace of reforms and foreign politics. The fiscal policy has
to deal with the ballooning fiscal deficit. Fiscal stimuli during the global financial
crisis and past reforms have added to the fiscal burden. Useful future reforms
would be widening the tax base, stimulating labour participation and trans-
forming the farmers’ social fund. The pension system reform of 1999, on the
other hand, supports long-term sustainability. But this is achieved by shifting the
burden to retirees – pension benefits are expected to shrink in the future. The
health care system gives Poles almost universal access. More attention is needed
for efficiency, service delivery and monitoring spending. Public spending is
currently relatively low, but out-of-pocket spending is high. Privatization efforts
peaked in 2000, but will likely receive a boost from fiscal consolidation needs.
Currently, the Polish state is still very present in power, natural resources and
banking sectors. Poland is the largest net receiver of EU funds, but the co-
investment requirement pushes fiscal spending up. The international position of
Poland shifted towards the West after the fall of communism. Poland became
member of several multilateral platforms, such as the EU and NATO.

October 2011                       Rabobank     Economic Research Department             5
Management Summary

                       External position
                       Foreign trade is dominated by the EU and especially Germany. The automotive
                       sector is important for both imports and exports. The current account balance
                       tends to be in deficit, between 2-6% of GDP. Deficits on the trade and income
                       balances are the reason for the current account deficit. The transfer balance
                       benefits from EU subsidies and remittances. Foreign investment took off after EU
                       entry, especially FDI. Portfolio investment is growing, but remains very volatile.
                       The Netherlands and Germany are the largest investors in Poland, which has the
                       largest stock of FDI in Central Europe. Per capita stock, on the other hand, is
                       less impressive. The level of external debt is around 55% of GDP. The compo-
                       sition of foreign debt changed toward more private debt and shorter tenors,
                       among others due to the many foreign acquisitions of banks.

                       SWOT analysis
                       Based on the present situation in Poland and outlooks, a SWOT analysis is made,
                       summarizing the strengths, weaknesses, opportunities and threats for Poland.
                       Below you will find a summary and in chapter 6 the explanation is given.

SWOT analysis of Poland

 Strengths                                            Weaknesses
 1. Large internal market.                            1. Lagging business environment
 2. EU Membership                                     2. Poor infrastructure
 3. Stable democracy                                  3. High structural unemployment
 4. Macroeconomic stability                           4. Low labour productivity (growth)
 5. Low labour costs                                  5. Low productivity in agriculture
 6. Abundance of (semi-)skilled labour                6. Sustained current account deficit
 7. Steady convergence path
 Opportunities                                        Threats
 1. Increase participation rate                       1. Ageing population
 2. Stimulate investment in human capital             2. Slow growth in Western Europe
 3. Improve access to financial services              3. Deterioration of fiscal situation
 4. Strengthen financial sector                       4. New EU budget
 5. Introduce the euro                                5. Stalling privatization
 6. Exploitation of shale gas                         6. Electricity shortage

                       We would like to thank Dariusz Winek and Michal Kolesnikow (Bank BGZ) for
                       their contribution to the sections on agriculture, banking and financial markets,
                       Jane Foley (Raboank Financial Markets Research) for her contribution to the
                       section on exchange rate and Theo Smid (Rabobank Economic Research Depart-
                       ment) for his work on the economic scenarios.

                       October 2011                     Rabobank    Economic Research Department            6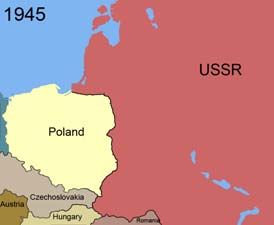
1. History of Poland
In this chapter a brief overview of Poland’s history is given. After a general
introduction, we focus on economic development since the transition.
1.1 A short history
Poland’s history shaped by foreign forces.
No independent Polish state from 1795 to 1918.
Solidarity movement key in peaceful end of communism.
Rapid reorientation towards market economy and the west after fall
communism.
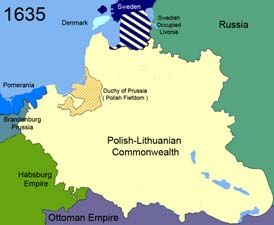
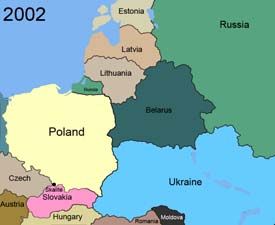
Poland has a scarred history1. From being one of the powerful European States
in the 14th century, the country has spent much of the past two centuries under
foreign rule (figure 1). The Polish-Lithuanian Commonwealth was established in
1569, but a marriage between the Queen of Poland and the Grand Duke of
Lithuania in the 14th century had already created one of the largest political
bodies in Europe. From mid-17th century, internal struggles led to a decline of
the state. The Russian empire, the Kingdom of Prussia and the Austrian-
Hungarian Habsburg Monarchy benefitted from this and each conquered parts of
the Commonwealth. From 1795, when the Commonwealth ceased to exist, until
1918 there was no independent Polish state. The idea of an independent Polish
state was kept alive and was the source of continuous uprisings. After World
War I, the Second Polish Republic was established in the Treaty of Versailles.
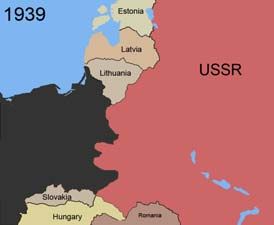
In 1939, the Soviet Union and Nazi Germany signed the Molotov-Ribbentrop
non-aggression pact, effectively dividing Poland, and within a month both
countries had invaded Poland. Two years later, Germany fully occupied Poland.
In 1945, the Soviet Union and the People’s Army of Poland (controlled by the
2
Figure 1: Territorial changes of Poland
Source: Wikipedia
October 2011 Rabobank Economic Research Department 7
1. History of Poland
Soviets) defeated the Germans and liberated Poland in the process. In Yalta
(June 1945), the People’s Republic of Poland was established.
Under the rule of the communist Polish United Workers’ Party, Poland became a
Soviet satellite state. As communist rule was applied less strict at times, this
allowed a large influx of western credit in the first half of 1970s, boosting
Poland’s economic growth. However, it also created an unsustainable public
debt. When the government wanted to increase the price of meat in order to
create extra revenue, it prompted a series of strikes in 1980. Guided by an
electrician (Lech Walesa), workers at the Lenin Shipyard in Gdansk reached an
agreement to end the strike. Crucial in this agreement was the right to form
independent trade unions. This paved the way for the Solidarity movement,
which played a key role in the peaceful ending of the communist rule. Solidarity
negotiated Polish legislative elections in 1989, which became an important event
in the fall of communism in Poland. In December of that year, a non-communist
government renamed the country ‘Republic of Poland’ and introduced a program
to reform the Polish economy from a centrally planned economy to a market
economy. After almost two centuries of struggles with foreign powers, Poland
finally regained full sovereignty. Governments in the 1990s continued with the
transformation of the economy and focused foreign policy on the west. In 1999,
Poland joined NATO and in 2004 the country entered the European Union (EU).
1.2 Economic growth after fall of communism
Serious contraction of growth during transition in 1989-1991.
Economic growth spurred during 1990s and 2003-2008.
Dips in growth due to the overheating late 1990s and due to global
financial crisis.
After the fall of communism, Poland’s economy was transformed from a centrally
planned economy into a market economy. Part of the turnaround was the end of
guaranteed employment, the reduction of many subsidies, and the restructuring
or closure of several state enterprises. These changes initially had a negative
effect on output in 1989-1991. On the back of latent consumption demand and
years of underinvestment, combined with rising availability of (foreign) credit
and foreign direct investment (FDI), the Polish economy bloomed in the 1990s.
Towards the end of the 1990s, the consumption and investment driven binge
pushed up inflation - well beyond double digits. In response, the Polish central
bank sharply tightened its monetary policy. Around the same time, major trade
and investment partners of Poland were hit by first the Russian crisis (1998) and
later the dot-com bubble (2001/02). This depressed trade and especially FDI. In
the mean time, employment was affected by the slowdown in investment and
consumer spending. This all pushed economic growth down, although growth
still stayed in positive territory. On the back of EU entry in 2004, the economy
got a new boost supported by a large influx of FDI, ample availability of foreign
October 2011 Rabobank Economic Research Department 8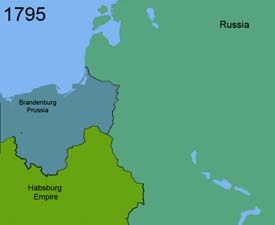
1. History of Poland

credit, rising spending power, decreasing unemployment and looser monetary
policy. Economic growth averaged 5.1% in the period 2003-2008. When the
financial crisis spread across the globe, Poland was affected too. FDI and foreign
credit shrunk. Initially exports fell as well, but a depreciation of the zloty helped
compensate. All-in-all, on the back of Poland’s large internal market, additional
government spending and a partial recovery of the export market, the economy
managed to post a positive growth of 1.7%. Poland was the only country in the
EU that managed to stay out of recession.

October 2011                      Rabobank     Economic Research Department             9
2. People
In this chapter, we take a closer look at the people in Poland and the labour
market. Demography, culture, income and education are discussed. Then, we
look at labour cost and productivity, unemployment, and participation rate. The
chapter finishes with migration.
Figure 2: Population size by age category
mln
2.1 Demography
mln
40 40 Poland is the sixth most populous
35 35 state in the EU.
30 30
Population has been shrinking since
25 25
1998.
20 20
The population is ageing and the ratio
15 15
of dependent to active population is
10 10
rising.
5 5
0 0
80 85 90 95 00 05 10 15 20 25 30
With almost 38 million inhabitants, Poland is2. People
these were still widely spoken as second languages. Also other indicators
suggest that Poland is a rather homogenous society. 97% of the inhabitants of
Poland belong to the Polish ethnic group. Other groups are German (0.4%),
Belarusian (0.1%), Ukrainian (0.1%) and other (2.7%). Moreover, 90% of the
Poles indicate that he or she is Roman Catholic, of which 75% are practicing.
This is very high in European context, but it is not evenly spread across the
country. In general, the young, urban and well-educated population is less
religious than the rural and older Poles. Despite the homogenous character of
Poland, the country sees spats of extreme right, anti-Semitism and anti-
foreigners sentiment. This flares up occasionally, especially in areas with high
unemployment.
2.3 Income
Poland is a high income country with almost USD 19,000 per capita
(PPP).
Income inequality is moderate.
Progress on convergence path is slow, but steady.
Per capita income of Poland was USD 18,770 (in PPP terms) in 2010. This is just
above the cut-off line between high income and middle income countries, as
defined by the World Bank. Income per head has seen a dramatic increase since
the fall of communism, despite a fall and stagnation in the period 1989-91
(figure 3). Per capita income is expected to almost double again in the next
decade.
Figure 3: GDP per capita (USD, PPP) Figure 4: Convergence of income
USD USD % %
25000 25000 100 % of EU 27 average 100
(nominal GDP per capita in EUR in PPP)
90 90
80 80
20000 20000
70 70
60 60
15000 15000 50 50
40 40
30 30
10000 10000
20 20
10 10
5000 5000 0 0
95 96 97 98 99 00 01 02 03 04 05 06 07 08 09
Slovenia Slovakia Estonia
0 0 Lithuania Latvia Bulgaria
89 91 93 95 97 99 01 03 05 07 09 11 Czech Rep Hungary Poland
Source: Economist Intelligence Unit Source: Eurostat
October 2011 Rabobank Economic Research Department 112. People
The Gini index, measuring the degree of income inequality, is 35% for Poland5,
which is moderate. In comparison, the Netherlands has a Gini coefficient of
31%, while and Brazil and South Africa (which are known for their inequality)
have an index of 55% and 57%, respectively.
The convergence path is often mentioned as a key target in the development of
NMS. It focuses on the disparities in income per head in Central Europe and in
Western Europe. The general idea is that less developed countries grow faster as
they adopt technology and increase efficiency, which allows them to catch up
with the more developed countries. Poland’s income (measured by nominal
income per capita in PPP terms) climbed from 42% of the EU-27 average in
1995 to 60% of the EU-27 average in 2009 (figure 4). The convergence path of
Poland is thus slow, but steady.
Outlook: Per capita income is expected to continue rising to around USD 35,000
(PPP) in 2020. This means that Poland would pass Hungary and Portugal and
edge close to Greece in 2020. It would still be around USD 5,000 per capita
behind Italy, the Czech Republic, and Slovakia in 2020. If Poland stays on track
it would be on par with Italy’s income per capita in 2030.
2.4 Education
Education is universal with many Poles attending higher education.
Mismatch between education and labour market
Soft skills are generally not a strong point of Poles
Life-long learning is relatively low.
The education reform of 1999 has been very successful in increasing the number
of people with secondary and higher education qualification and improving
quality, especially in secondary education6. In Poland, 88% of adults (25-64
years) have a medium of high degree. This compares well with the EU-27
average of 71.8%. Moreover, the PISA scores7 of Poland are rising, and were
just below OECD average in 2006 – except for reading, which was above
average (figure 5). Surprisingly, Poland is able to achieve this level with per-
student expenditures that are significantly lower than the average in OECD
countries8. Education is universal in Poland with high enrolment rates, except for
pre-primary education. A boom in higher education in the past 20 years had led
to a participation rate that is one of the highest in Europe. With about 500
students per 10,000 inhabitants, Poland ranks sixth in the world regarding
accessibility of higher education. Admittedly, the quality of teaching and
research has had difficulties keeping up with the boom in higher education
students (table 1).
October 2011 Rabobank Economic Research Department 122. People
Despite the success of the education reforms, there are several caveats that
hinder the full-potential of many Poles. First, there seems to be a mismatch
between the studies chosen by students and supplied by schools on the one
hand, and the disciplines demanded by employers on the other hand9. The focus
in Poland is too much on social sciences and too little on science, mathematics
and IT. Second, soft skills are often considered below standard. This is said to be
a legacy of the communist era, when these skills were neither necessary nor
promoted. Considering the many business students and returning emigrants, it
is expected to improve in the coming years. A third issue is that in the age group
25-64, participation in education and training, so-called lifelong learning, is
about half of the EU average. This suggests that those age cohorts, and
especially the older groups, can have difficulties updating their skills to match
the demands in a changing economy.
Outlook: As a result of the issues in the education sector, many still work in jobs
that are below their potential, leading to the claim that Poland faces a ‘brain
overflow’ (excess of well-qualified people). It also leads to structural
unemployment as skills and education do not match demands by employers. To
take the education system to the next level, the government will need to focus
on pre-primary schooling, the mismatch between education and business
community, soft skills and lifelong learning. By addressing these points, Poland
can potentially boost long-term economic growth.
2.5 Labour costs and productivity
Labour productivity is rather low.
Rapid increase in productivity during transition period, but pace slowed.
Unit labour costs compare favourable to other OECD countries.
Strong increase in unit labour costs during 1990s, but stabilization since.
Table 1: Global Competitiveness – education
Figure 5: PISA scores
indicator
score score
600 600 Rank
550 550 Selected indicators (out of 139)
500 500 Higher education and training (overall) 26
450 450 Secondary education enrollment rate 25
Tertiary education enrollment rate 21
400 400
Quality of the educational system 62
350 350
Quality of math and science education 40
300 300 Quality of management schools 62
Males Females Males Females Males Females
Local availability of research and 22
Science scale Mathematics scale Reading scale
Poland Finland (highest scores)
training services
Mexico (lowest scores) OECD average
Source: OECD. Data: 2006. Source: World Economic Forum, 2010.
October 2011 Rabobank Economic Research Department 132. People
Labour productivity10 in Poland is still rather low. GDP per hour worked in Poland
is only about 43% of what Germany produces per hour (figure 6). Also
compared to neighbouring countries, such as the Czech Republic, Slovakia and
Hungary, Poland is less productive per hour worked. As can be expected, labour
productivity growth in Poland was well above
Figure 6: Labour productivity European average during the transition period
% %
(figure 7). In the period 1993-2000, productivity
160 GDP per hour worked as % of Germany (Germany = 100) 160
Data: 2009 growth averaged almost 5% per year. However,
140 140
this was no ‘real’ productivity gain, but merely
120 120
100 100
the shake out of unproductive workers – which
80 80 also occurred in most other former-communist
60 60 countries. After 2000, productivity growth was
40 40 based on technological advancement. Average
20 20
productivity growth was around 2.5-3%, but the
0 0
trend seems to be downward. At a first glance,
Netherlands
UK
Sweden
Italy
Israel
Canada
Japan
New Zealand
Korea
Euro area
US
Czech Rep.
Mexico
Norway
Ireland
Finland
Slovenia
Slovakia
Greece
Germany
Denmark
Belgium
Iceland
Hungary
France
Luxembourg
Portugal
Austria
Australia
Switzerland
Spain
Poland
OECD avg
Russia
this seems to make sense as the economy of
Poland is maturing. However, the level of
Source: OECD productivity per hour is still lower than in ‘new’
EU countries, such Slovakia and Hungary.
In terms of competitive advantages and investor attractiveness, the low
productivity of Poland is partially compensated by the low labour costs. This
leads to relatively low Unit Labour Costs (ULC; i.e. labour costs per unit of
output). In the period 2005-2009, Poland had lower ULC than many
neighbouring countries (such as the Czech Republic, Slovenia, and Hungary)
(figure 8). However, if Poland wants to stay competitive in the area of labour
costs, the ULC should not increase faster than the countries it is competing
against. During 2007/08, the ULC in Poland rose rapidly, as labour costs
increased more than 10% per year and real output only grew close to 6% per
year.
Figure 7: Labour productivity growth Figure 8: Unit Labour costs
% change p.a. % change p.a. USD USD
0.9 Unit Labor Costs (average 2005-2009) 0.9
10 10
9 9 0.8 0.8
8 8
7 7 0.7 0.7
6 6 0.6 0.6
5 5
4 4 0.5 0.5
3 3
0.4 0.4
2 2
1 1 0.3 0.3
0 0
0.2 0.2
-1 -1
Israel
Sweden
Italy
US
Netherlands
UK
Korea
Turkey
Czech Rep
Ireland
New Zealand
Slovenia
Japan
Finland
Canada
Norway
Greece
Mexico
Euro zone
Hungary
Germany
Denmark
EU-27
Slovakia
Belgium
France
Portugal
Poland
Luxembourg
Australia
Spain
Austria
Switzerland
Estonia
0.1 0.1
0.0 0
IE
EE
PT
IT
CY
OECD*
LV
CZ
NL
RO
AT
HU
LU
DM
CH
PL
ES
SE
DE
US
UK
FI
LT
BU
BE
FR
SI
GR
SK
average 1993-2000 average 2001-2010
Source: OECD Source: OECD (* simple average)
October 2011 Rabobank Economic Research Department 142. People
Outlook: Assuming that Poland will continue to acquire technology and increase
efficiency, but that Poland will not receive an extra, special boost (like it did in
the 1990s), the labour productivity growth is expected to be around 3% per
year in the next decade. This is slightly above developed countries like Australia
and the Netherlands and similar to the labour productivity growth in the past
years. The ULC is likely to come under pressure due to rising wage costs. This is
expected as generally in an ageing society, wages rise as labour becomes
scarcer.
2.6 Unemployment
Unemployment remains stubbornly above 10%.
About 25% of the jobless is longer than 12 months unemployed.
In northern and eastern provinces unemployment is higher.
Joblessness is higher among well-educated, young people and low-
educated and older Poles.
After the fall of communism, two major changes in the economic system were
the end of guaranteed employment and the restructuring or closure of several
state enterprises (although the latter was postponed well into 2000s in some
cases). This pushed unemployment up from a very low (and perhaps
understated) 3% of the labour force in 1990, to 16% in 1994 (figure 9). An
economic downturn in 2001/02 drove the unemployment rate to 20%. Since
2004, the rate has seen a steady decline –apart from 2009–, but still has not
dropped below 10%. It moderately increased again during the financial crisis in
2009, and is currently around 11-12%
The continuous decline since 2003 is the result of strong economic growth in the
pre-crisis years and emigration. Not only the number of jobseekers declined, but
Figure 9: Unemployment rate Figure 10: Long-term and structural
unemployment
% persons (per year) thousand persons %
25 60000 2500000 18
Data: * from 3Q2010, rest end of year
20 50000 16
2000000 14
15 40000
30000 12
10 1500000
20000 10
5 8
10000 1000000
0 6
0
-5 500000 4
-10000
2
-10 -20000
0 0
-15 -30000 06 07 08 09 10
90 92 94 96 98 00 02 04 06 08 10 12
unemployed (l)* unemployed >12 months (l)*
Unemployment rate (l) GDP growth (l) Emigration (r) structural unemployment rate (r)
Source: Economist Intelligence Unit, GUS Source: GUS, OECD.
October 2011 Rabobank Economic Research Department 152. People
also the number of long-term unemployed (>12 months) (figure 10).
However,still a quarter of the unemployed is jobless for more than a year.
Moreover, structural unemployment is around 10% according to the OECD.
There are large differences among the different unemployment groups – in
terms of location, age and education (annex 1)11. The northern and eastern
voivodships (provinces) generally have higher unemployment rates; with
unemployment in Warminsko-Mazurskie, in the north-east of Poland, at 20.7%
in 2009. Age-wise, the cohort 25-34 years scores worst, as this is the age that
people enter the labour market. However, the average duration of
unemployment for this group is relatively short, except for those who have a
tertiary (university) education - they had been looking for a job for a massive 29
months on average (in 3Q10). For people older than 55 and unretired, the
duration of unemployment was close to 40 months in 3Q10. Among the low-
educated, more than a third of all active people are unemployed.
Outlook: Unemployment is expected to slowly decline in the next decade, helped
by a shrinking working age population. Actual levels will depend on changes in
labour market regulation, job creation, pension scheme/early retirement
options, educational mismatch and lack of relevant skills and participation rate.
Labour market rigidities resulting from regulation (see also next section) is also
an important factor in the high structural unemployment.
2.7 Labour market regulation
Restrictive labour regulation makes hiring and firing difficult.
Tax wedge12 is moderate and recently reduced.
Unemployment benefits are not considered as majorly disruptive to
labour supply – but early retirement benefits are.
Table 2: Global Competitiveness – labour market Figure 11: Tax wedge
indicators
% %
Rank 60 Tax wedge for single individual without children earning 60
gross wage of average worker, as % of total labor costs
Selected indicators (out of 139) Data 2010
50 50
Labor market efficiency (overall) 53 40 40
Cooperation in labor-employer relations 88
30 30
Rigidity of employment 64
Hiring and firing practices 108 20 20
Redundancy costs 21 10 10
Pay and productivity 54
0 0
Brain drain 79
Belgium
Japan
OECD average
US
Germany
Italy
Denmark
Spain
Norway
Poland
UK
Switzerland
Mexico
Austria
Slovakia
Portugal
Finland
Iceland
Sweden
Estonia
Canada
Australia
Israel
Luxembourg
Czech Rep
Netherlands
Ireland
New Zealand
Chile
Slovenia
Korea
France
Greece
Hungary
Turkey
Female participation in labor force 56
Source: World Economic Forum, 2010. Source: OECD, 2011.
October 2011 Rabobank Economic Research Department 162. People
Labour regulation is rather strict and unions have considerable influence13. This
makes dismissing an employee difficult and non-salary costs of employment
high. In the Global Competitiveness Report 2010-11, restrictive labour
regulations are mentioned as third on the list of most problematic factors for
doing business (after tax regulation and bureaucracy). On the indicator ‘hiring
and firing practices’ scores Poland 108 out of 139, but also rigidity in
employment and cooperation in labour-employer relations stand out in a
negative way (table 2).
The tax wedge in Poland is moderate14. Between 2007 and 2009, the
government reduced the disability contribution and simplified the personal
income tax system, thereby decreasing the tax wedge, to stimulate employment
and labour participation. In 2010, the tax wedge in Poland was very close the
OECD average and below most other NMS (figure 11).
The unemployment benefit system is not overly generous in Poland by OECD
standards. The system therefore does not create major labour supply
disincentives. The low participation rate is more related to early retirement
benefits and disability pensions.
Outlook: The government has not presented any intention to make major
changes the labour regulation yet, except the retirement age. The government
of Donald Tusk (PO party) has mentioned that it intends to raise the retirement
age in the coming years, reduce the early retirement options and make the
pension age equal for men and women. The speed of reforms will very much
depend on the outcome of the October elections and resulting coalition
formation. The reduction of the disability contribution is criticized as it adds to
the fiscal challenges. The government will have to decide whether the higher
fiscal deficit outweighs the benefits of a smaller tax wedge. As the fiscal
pressure is expected to win, the disability contribution could be raised again
somewhere in the coming years. Even so, the tax wedge would remain rather
moderate.
2.8 Participation rate
Labour force participation rate is low.
Inactivity is high among females, low-educated persons and 50+ age
groups.
Early retirement is main reason for inactivity.
Of the total population in Poland older than 15 years, 43.7% or 14 million people
were economically inactive in 2009, according to GUS. This means that they
were neither working nor looking for a job – it also includes elderly who are
retired. The mirror concept of inactive population is the labour force participation
October 2011 Rabobank Economic Research Department 172. People
rate, which was 65% in 2010, according to the OECD (note the slightly
difference in definition between OECD and GUS, as OECD looks at people in the
age category 15-64 and GUS at 15+). Poland’s participation rate is well below
the OECD average of 72.4%. After Turkey,
Hungary and Italy, Poland has the lowest
Figure 12: Economic inactive population
participation rate among the OECD countries.
%
90
mln
10 This suggests that Poland has much to gain in
80 9
70 8 economic terms if it can increase its participation
7
60
6 rate. If Poland wants to raise its participation
50
5
40 4 rate to the OECD average, this would require
30 3
20 2 almost 2.4 million people to become active,
10 1
0 0 based on the current size of the population.
rural
post-second. and
basic vocational
female
urban
>50
general secondary
lower secondary
tertiary
15-29
30-39
40-49
male
Considering the demographic outlook (see also
vocational sec.
and lower
section 2.1), it is very likely that the 50+ age
group will grow in the coming decade. Therefore,
sex residence education age if Poland wants to give its economy a boost, it
inactive (% of total population >15 yrs in same category, l) inactive (r)
needs to increase the participation rate among
Source: Labour Forces Survey (GUS), data 2009
women and 50+. All based on the assumption
that those who become or stay active are able to
find a job (see also sections 2.6 and 2.7).
The rate of inactivity widely differs across population groups15. It is high for
women, low-educated persons and those who are 50+ (figure 12). About half of
the women in Poland (almost 9 million) are not participating – contrary to many
post-communist countries where female participation tends to be high. More
striking are the numbers of low-educated people who are inactive (80% of that
group or 6 million persons) and of those who are 50 years or older (68% or 8.8
million). The reasons for economic inactivity range from retirement and
education to disability/illness and family responsibilities16. With 46%, retirement
is the primary reason. Only about 3% of the inactive population can be labelled
as discouraged worker.
Outlook: The participation rate is expected to increase slowly over the next
decade, but the OECD average is likely to be a bridge too far. Changes to early
retirement options and pension age are expected to push participation rate up,
although the speed of change is unclear. If the working age population starts to
shrink, this will increase pressure from the business community on the
government to act to stimulate people to work. The slowly shrinking pensions
(see section 4.4) will also stimulate people to work longer. Moreover, among the
younger generation of women the participation rate is expected to be higher and
stay higher than in the generation of their mothers – also helped by the higher
education level.
October 2011 Rabobank Economic Research Department 182. People
2.9 Migration
EU entry boosted migration to ‘old’ EU members.
End of labour market restrictions in Germany is expected to attract
Poles.
Migrants have become younger and better educated.
Emigration absorbed part of Poland’s brain overflow.
Migration from rural areas to cities or abroad.
Historically, Poland is a country that has seen substantial emigration. During
foreign dominance in the past centuries and in search for economic prosperity,
many Poles left to live in exile and tried their luck abroad. With the accession to
the EU in 2004, the (legal) migration to the ‘old’ EU members sped up. In the
years before 2004, around 15,000-20,000 Poles emigrated to EU countries each
year (figure 13). In 2006, more than 40,000 inhabitants emigrated. Also, the
number of Poles temporarily staying abroad in the EU increased rapidly - from
750,000 end-2004 to 1,860,000 end-2007 (figure 14). During the global
financial crisis, many Poles returned, mainly from the UK and Ireland. However,
this hardly showed up in the unemployment statistics as you need to work
several months in Poland before becoming eligible for unemployment benefits,
so many did not bother to register.
When Poland entered the EU in 2004, all EU members had the choice of opening
up to Polish workers directly or have a grace period of up to 7 years17. While the
UK, Ireland and Sweden opened up quickly, many other EU members initially
imposed labour market restrictions. Germany and Austria opted for the 7 year
grace period (i.e. until 30 April 2011). As a result, before EU entry, most Polish
emigrants went to Germany, but the UK was the most popular destination after
2004. Looking at historic patterns, it is expected that the emigration from Poland
to Germany will increase as the labour market restrictions were lifted in May
2011. The size of the new impetus to Polish emigration is still unclear.
Figure 13: Emigration Figure 14: Temporary stay abroad
persons persons persons persons
2500000 Population absent in 2004-2009 due to departure 2500000
50000 50000 abroad for temporary stay (>3 months) – estimates
Data concern only persons who deregistered from permanent
45000 residence in Poland due to departure abroad (emigration) 45000
40000 40000 2000000 2000000
35000 35000
30000 30000
1500000 1500000
25000 25000
20000 20000
15000 15000 1000000 1000000
10000 10000
5000 5000
500000 500000
0 0
66 71 76 81 86 91 96 01 06
Ireland Netherlands Germany 0 0
Sweden United Kingdom Italy 04 05 06 07 08 09
Other Europe United States Other countries Germany UK Ireland Netherlands Other EU Non-EU
Source: GUS Source: GUS
October 2011 Rabobank Economic Research Department 192. People
Outward migration has not only changed in destination, but also in who is
leaving18. Migrants have become younger and better educated, which led to the
fear of brain drain. However, migration has not led to shortages in most sectors
yet, as the country suffered from a brain overflow. Only in the construction
sector and ocassionally health care, shortages were witnessed, but Ukrainians
seem to fill these gaps. With the ageing population in Poland, immigration from
foreigners to Poland is expected to rise.
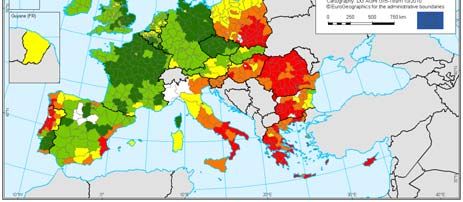
Migration also takes place within Poland. Generally speaking, people are leaving
the rural areas to go to either the large cities in Poland (the green spots in figure
15) or abroad. As it is predominantly the younger population that is moving,
many rural areas are faced with a rapidly ageing population. In the case of
migration within Poland, urbanization is expected to continue, but the rate is
slowing down. In 2010, 61% of the population lived in cities.
Outlook: The end of labour market restrictions in Germany will provide a new
stimulus to Polish emigration in the coming years, although depending on the
economic situation. Also, family reunions are likely to increase following the
strong increase in emigration after 2004. On the other hand, the increasing
wealth level in Poland will make emigration for Poles less attractive and
immigration towards Poland more attractive (e.g. for Ukrainians). Moreover, it is
expected that at least some Poles who emigrated in the 1980s will return after
retirement. The ageing population in Poland will also dampen the number of
emigrants. Overall, the boom seen after EU entry is not expected again. Around
2018-2020, Poland is even expected to become a net immigration country
(figure 16). The inflow of foreigners could create some tension. Poland is a
homogenous society, but anti-foreigners sentiment is present and flares up
occasionally.
Figure 15: Net domestic migration per region Figure 16: International migration expectations
persons persons
40000 40000
30000 30000
20000 20000
10000 10000
0 0
-10000 -10000
-20000 -20000
-30000 -30000
-40000 -40000
-50000 -50000
10 11 12 13 14 15 16 17 18 19 20
emigration immigration net migration
Source: European Union Source: GUS, 2009.
October 2011 Rabobank Economic Research Department 203. Economy
The economic structure of Poland is the focus of this chapter1. Below, the
structure of economic sectors is discussed with attention for the agricultural,
industrial and services sector. The banking sector and financial market are
discussed more extensively. Next, the
Table 3: Top 10 largest sectors monetary policy and exchange rate policy are
analyzed. Finally, we turn to the business
% of
USD bn GDP environment, natural endowment,
infrastructure and environment.
Retail Trade - Total 45.4 11.0
Construction 31.9 7.7
Wholesale Trade 29.4 7.1
3.1 Structure of economic sectors
Real Estate 24.9 6.0
Agriculture provides only 4% of GDP,
Business Services 22.4 5.4
Public Admin. and Defense 21.3 5.2 but employs many.
Industry is about a third of GDP and
Education 18.9 4.6
Agriculture 16.4 4.0 automotive and food processing
Land Transport 15.9 3.9 sectors are important.
Health and Social Services 15.2 3.7 Services account for two-thirds of GDP,
Source: IHS Global Insight. Data: 2010 (Value added) with trade as major sector.
Public sector is very large, but 55%
works for state-owned companies.
When looking at the origin of GDP, the division is very similar to more developed
countries (table 3). Services account for about two thirds of total GDP, industry
for a third and agriculture for about 4%. The industrial and agricultural sectors
had been shrinking in terms of GDP contribution since the end of the communist
era in favour of services, but this trend seems to halt. The division is not
expected to change much in the coming decade, although employment is likely
to shift from the agricultural to the services sector.
By providing 26% of employment, the public sector is very substantial in Poland
– also in international comparison. However, a little less than half of the public
sector personnel works for government units, social security fund and other non-
profit institutions (health care, education, etc). The other half, almost 2 million
persons, are employed by state-owned enterprises, such as energy companies
and banks.
1
In this chapter, as in the rest of the paper, the focus is on the measurable, registered
economy of Poland. However, Poland surely also has a grey economy. A recent study by
the World Bank (Schneider, et al, 2010) puts the size of the shadow economy of Poland at
around 27% of GDP for the past years. This is rather average in worldwide comparison, as
globally the smallest grey economies are estimated to be below 10% of GDP and the
largest around 65% of GDP. However, by nature, measuring the size of the grey economy
is difficult. Although evasion of taxes and social security contributions certainly is an issue,
having a grey economy is not necessarily bad. In economic downturns, it provides a
cushion against poverty through the many small jobs.
October 2011 Rabobank Economic Research Department 213. Economy
3.1.1 Agricultural sector
Agriculture is only 4% of GDP, but employs 15% of total workforce.
Meat, milk and cereal are important agricultural products.
Generally small farms, low usage of capital and extensive crop farming.
Land rent system is underdeveloped and sale of agricultural land to
foreigners is very restricted.
Poland has a favourable climate for agriculture. Moreover, within the wider
European region, Poland is one of the countries with a large agricultural area.
Arable land dominates over permanent crops and meadows (figure 17). The
agriculture sector is important in Poland, despite its relatively low contribution to
GDP of 4%. Almost 10% of Poland’s exports are food and live animals and the
sector employs more than 15% of the workforce. This number is even higher in
some rural areas. In many districts in the east and south-east of Poland, more
than 20% of the population works in the agricultural sector.
The agricultural sector in Poland is specialized in meat, milk and cereal
production (figure 18). Within animal farming, pigs and poultry are very
important. The potential of agricultural production in Poland is considered high,
especially in the area of crops, forage, soft fruit (mainly raspberry) and milk.
Regarding international trade, Poland has a dominant position within the EU for
several products, including frozen goose meat (62% of all frozen goose meat
traded in EU comes from Poland), smoked salmon, and frozen strawberries
(figure 19). About 15% of beef traded in the EU, comes from Poland. There are
several agricultural products manufactured in Poland which are important
nowadays and can particularly gain in importance in international trade in the
long run, such as powder milk, cottage/curd, cheese, mushrooms, chocolate,
apple concentrate, beef and poultry. Polish farmers are believed to specialize
further in the production of these food categories (in poultry for some time).
Figure 17: Agricultural areal Figure 18: Agricultural output
ha ha total value: EUR 22.4bn total value: EUR 358.8bn
45,000 45,000 100%
40,000 40,000 90%
35,000 35,000 80%
30,000 30,000 70%
25,000 25,000 60%
20,000 20,000 50%
40%
15,000 15,000
30%
10,000 10,000
20%
5,000 5,000
10%
0 0
0%
Poland EU-27
Animals Cereals (incl seeds)
Milk Fruit, vegetables and other horticulture
Industrial crops Forage plants
Arable land Permanent crops Permanent meadows and pastures
Eggs Other
Source: Rabobank Food & Agribusiness Research (FAR) Source: BGZ. Data: 2008.
October 2011 Rabobank Economic Research Department 223. Economy
The agricultural sector is characterized by small farms, low usage of capital and
(in the eastern part) extensive crop farming. In 2007, the average size of the
2.4 million farms in Poland was 6.5ha per farm. In comparison, in the
Netherlands it was about 25ha per farm (figure 20). Productivity is generally
lower in Poland than in western EU countries, and opportunities for productivity
gains are large in all sectors, but especially for grains, oilseeds and pork.
At 53% of all farms, the importance of semi-subsistence farming seems rather
high, but is lower than in most other NMS19. In the past years, the number of
farmers has been decreasing, as many have migrated to the city to work.
However, numerous are reluctant to sell their land, which is not only culturally
determined but also stimulated by the social insurance system (see box 1). The
development of an adequate land rent system would allow farmers to expand
their business, while letting ex-farmers keep their land. In its Rural Development
Report, the EU has marked 57.9% of the agricultural area in Poland as in danger
of abandonment of land-use. Although part of this land will be taken up by
expanding cities, large parts could become unused.
The sale of agricultural land to foreigners is sensitive and rather difficult. Poland
was allowed to impose a 12-year ban on agricultural land sales to foreigners
when it entered the EU. This will run until 2016. An exception was made for
foreigners who already leased land. They are allowed to buy the land after three
years of lease in the east of Poland and after seven years of lease in the north
and west of the country. Polish farmers benefit from EU entry. On average, the
EU finances EUR 160 per hectare per year and Poles are entitled to an increasing
fraction of this amount. In 2004, they could only claim 25% of this amount. By
2013, they are looking at the full amount.
Figure 19: Share of Polish exports in EU trade Figure 20: Size of farms
% of internal EU trade coming from Poland
0 10 20 30 40 50 60 70
Frozen goose meat
Fresh or chilled 'compensated' beef
quarters
Smoked salmon
Frozen strawberries
Frozen berries (ex. strawberries)
Preserved herrings
Calves
Apple juice
Fresh or chilled button mushrooms
Fresh or chilled cuts of turkey
Source: BGZ, Eurostat Source: EU, 2010.
October 2011 Rabobank Economic Research Department 233. Economy Outlook: With a very extensive agricultural area, low usage of capital and in parts of Poland extensive crop farming, there seems ample room for improvement. The marginal capital productivity in Polish agriculture is considered high – i.e. every euro invested may bring high land, labour and knowledge productivity growth. Moreover, there is still arable land and green area that could be used to expand the agricultural area. However, compared with Russia, Argentina or China, Poland is a country with a relatively small agricultural area, therefore it cannot compete at international level in terms of volume of agricultural production. But there are several agricultural products from Poland, such as milk powder and cheese, which could particularly gain in importance in international trade in the long run. There are some aspects that hinder the full potential of Poland’s agricultural sector. For example, the social insurance system for farmers stimulates (ex)farmers to keep their small plots. The land rent system is relatively underdeveloped, thereby hindering the creation of larger scale, modern farms. Moreover, the sale of land to foreigners is very restricted, but this will likely change after 2016 when the ban on agricultural land sales to foreigners ends. It should be noted that a large consolidation wave among farmers would likely increase pressure on the social security system, as the current semi-subsistence is a way to avoid poverty. Box 1: Agricultural Social Insurance Institute (KRUS) In the 1999 pension reform, the Agricultural Social Insurance Institute (KRUS) was left untouched20 (see also section 4.4 on the pension system). KRUS offers old-age pensions on defined benefit base, which is financed through a pay-as- you-go system, as well as disability benefits, access to health care and accident and maturity benefits. The mandatory contributions to KRUS are based on a minimum pension as well as the price of rye (table 4). For ZUS (the general social security fund), the base is personal income tax declaration. As the contributions to KRUS are much lower than to ZUS, the KRUS only covers a small part of its expenditures. In 2008, 88.5% of the expenditures were covered by budget subsidies (but note that 2008 was the first year since 1995 that the subsidies dropped below 90%). The lower contributions to KRUS, but similar benefits, function as an income subsidy for the rural population. However, as you de facto have the option to choose between ZUS and KRUS if you own land or are related to farmers, it also creates a perverse incentive against the sale of (small) plots. Note that you are a farmer as long as you own more than one hectare of land. Moreover, the flat contribution fee also subsidizes the wealthier farmers. Changes will be difficult to achieve, as many perceive the fund as a way to support the rural population and the farmers’ lobby is strong. However, if KRUS is reformed, this will probably increase the size of the contributions paid by farmers and possibly lead to increased pressure on other social transfer October 2011 Rabobank Economic Research Department 24
3. Economy
schemes. Despite this, a reform is expected to have a positive effect on the
fiscal balance in the end.
Table 4: Main characteristics of KRUS and ZUS
Parameter KRUS (Agricultural Social ZUS (Social Insurance
Insurance Insitute) Institute)
Contribution rate (pension & disability) 10% 25.52%
Contribution base Basic (minimum pension, Actual wage (personal
price of rye) income tax declaration)
Average old-age pension PLN 896 PLN 1371
(PLN / % of avg. wage) 30% 46%
Minimum pension PLN 675 PLN 675
(PLN/% of avg. wage) 23% 23%
Retirement age 65 (men), 60 (women);
65 (men), 60 (women)
5yr less after 30 yr
Beneficiaries 1.45mln 7.4mln
Contributors 1.57mln 14.3mln
Ratio contributors/beneficiaries 1.08 1.93
Expenditures (old-age & disability), 1.30% 9.60%
% of GDP
Budget subsidy, % of expenditures 88.50% 24.50%
Source: World Bank, 2010b. Data: 2008
3.1.2 Industrial sector
Automotive and food processing are major industrial sectors.
Combination of relatively low labour costs, abundance of (semi)skilled
labour, large agricultural sector and proximity to Germany makes Poland
attractive for foreign investors.
The industrial sector in Poland mainly produces low- and mid-tech products. The
automotive and food processing sectors and labour-intensive manufacturing are
important. These branches have benefitted from the relatively low labour costs
and the abundance of (semi)skilled labour in Poland.
In 2007, Poland accounted for about 1% of the global production of passenger
cars and 4% of the European industry. But the country has a more prominent
place in the automotive industry with regards to spare parts and accessories
than in assembly. In fact, Poland is a leading producer in items such as tires, car
seats and upholstery, car electronics, electric cables, car brake’s systems. Food
processing has profited from the large agricultural sector as well as the relatively
low labour costs in Poland. The low labour costs combined with the proximity to
October 2011 Rabobank Economic Research Department 253. Economy
Germany have been the main drivers for the labour-intensive manufacturing
industries, like textiles. While design and marketing stayed in Germany, the
production was moved to Poland. However, this sector is losing to countries with
lower labour costs, including the Far East. Part
Figure 21: Total R&D spending of the FDI has been redirected towards
% of GDP % of GDP business process outsourcing.
4.5 4.5
4.0 4.0
3.5 3.5
Outlook: The size of the industrial sector is
3.0 3.0 expected to stay around 35% of GDP. The
2.5 2.5 government aims to shift from low- and mid-
2.0 2.0
tech products to higher-end products, both in
1.5 1.5
the industrial and the services sector. However
1.0 1.0
0.5 0.5
spending on (public and private) R&D is fairly
0.0 0.0 limited (figure 21). Cooperation with
Norway
Italy
Ireland
Poland
Germany
Turkey
Finland
EU-27
Denmark
UK
Netherlands
Czech Rep.
Slovenia
Croatia
Latvia
Sweden
Belgium
Spain
Hungary
Austria
France
Romania
Bulgaria
Slovakia
Portugal
Luxembourg
Estonia
(international) companies in the food
processing, automotive, financial, business
services and IT sectors might help Poland to
Source: Eurostat
move to more high-tech products and
services.
3.1.3 Services sector
Rapid development in past 20 years, helped by growth of household
consumption.
Much FDI directed at services sector, especially banking.
The services sector has developed rapidly in the past 20 years, supported by the
strong growth in household consumption. In the 1990s, the sector accounted for
about 55% of GDP, which rose to around 65% nowadays. Major sectors are
Retail and Wholesale Trade as well as Real Estate. The sector of business
services, which includes the financial sector, was responsible for 5% of GDP in
2010. Public administration & Defence, Education and Health & Social Services
account for about 14% of the economy. Although these sectors also include
private companies, the bulk of these services are provided by the public sector.
Foreign direct investment (FDI) in the industrial sector might have attracted
more attention – headlines do better with one mega-investment in a new factory
– but the services sector has received much interest as well. The financial
sector, especially banking, saw much FDI in the past year (discussed more
elaborate in section 3.3). Business process centres and IT industry have
benefited from the relatively low labour costs combined with the well-educated
workforce. IT hubs are being developed around technology universities in
Wroclaw and Krakow.
October 2011 Rabobank Economic Research Department 26You can also read