Policy brief - Global Data Barometer
←
→
Page content transcription
If your browser does not render page correctly, please read the page content below
Policy brief

               1
Acknowledgements

    Suggested citation: Global Data Barometer (2022). Climate Action- Policy Brief –
    Global Data Barometer. ILDA

    Author: Francesca De Chiara
    Edition: Maria Esther Cervantes
    Project direction: Silvana Fumega
    Research and data coordination: Nicolas Grossman
    Research and capacity building: David Zamora
    Communication: Fiona Chawana with the key support of Cat Cortes and Violeta
    Belver

2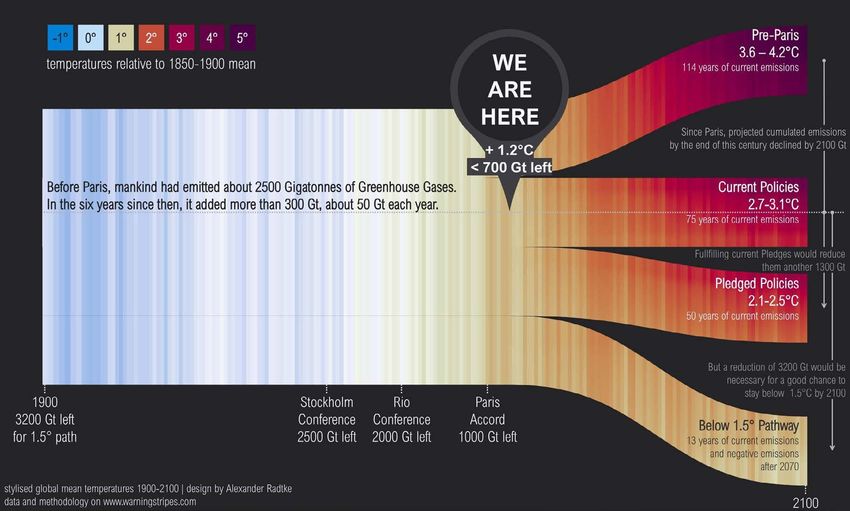
Executive summary

The climate action data gap is strongly connected to the national governments’
commitments to reduce greenhouse gas (GHG) emissions by countries
worldwide. This policy brief discusses the barriers hindering the effectiveness of
climate action plans by identifying the missing data and the lack of collection
and harmonization processes needed to support climate action. The brief is
informed by insights from Global Data Barometer (GDB) survey responses, upon
which we developed the recommendations based explicitly on the identified
limitations. The key recommendations are to ensure and harmonize data
collection processes across the globe and address the unavailability of data
impoverishing climate preparedness strategies, especially at the local and city
level.

                                                                                     3
Introduction
The UN has defined 5 targets and 8 indicators for SDG 13, the Sustainable
Development Goal (SDG) on climate action1. The indicators represent the
metrics by which the world aims to track whether they achieved the targets.
Three areas are relevant to SDG 13: climate mitigation, climate adaptation,
and the linkages between climate change and the broader 2030 Agenda. For
example, the indicator 13.2.1 - Integration of climate change into national policies
- measures the number of countries signed on to multilateral agreements on
climate change. This indicator does not reflect the levels of operationalization
or implementation of climate mitigation and adaptation action. National
commitments within the UNFCCC Paris Agreement vary by country depending
on their Nationally Determined Contributions (NCDs), so they are not directly
comparable.
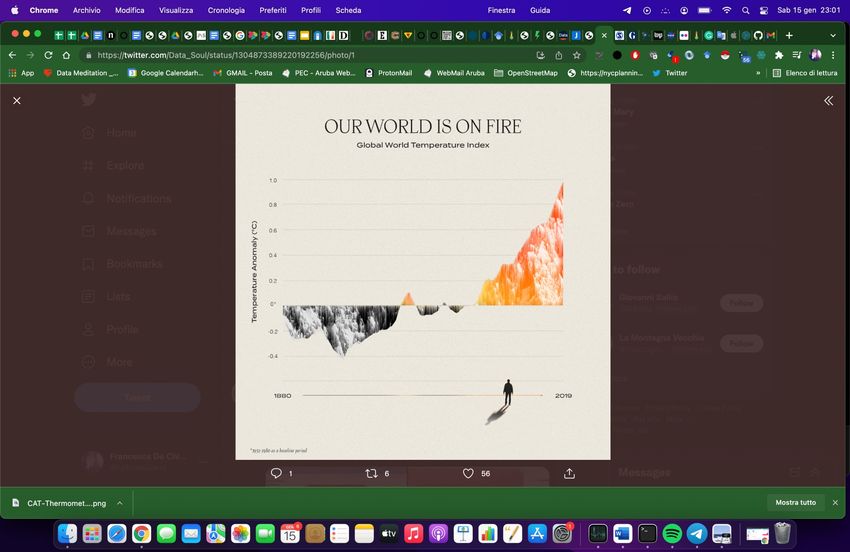
According to NASA’s annual analysis of global average temperatures2, the past
seven years have been the hottest in recorded history. 2021 and 2018 are the
warmest years registered on a record that extends back to 1880. Scientists at
NASA’s Goddard Institute for Space Studies (GISS) produce this record using
data from instruments worldwide, validated by satellite data and update the
record every year, maintaining one of the world’s most important datasets to
study the extent, pace and causes of warming on our home planet.
1
Goal 13: Climate Action - SDG Tracker. https://sdg-tracker.org/climate-change
2
NASA. Six Questions to Help You Understand the 6th Warmest Year on the record . 2022. https://
www.nasa.gov/feature/esnt/2022/six-questions-to-help-you-understand-the-6th-warmest-year-
on-record https://climate.nasa.gov/news/3139/six-questions-to-help-you-understand-the-6th-
warmest-year-on-record/
4The animation3 by Anti Lipponen is based on the NASA GISS data
3
The animation is available and free to use : https://live.staticflickr.com/video/51818338216/
c5ba485321/1080p.mp4?s=eyJpIjo1MTgxODMzODIxNiwiZSI6MTY0MjMzMTYyMSwicyI6Ijli-
YjMyZWJkYzk2YmE3NmExNDRiYzc1YTFiMWU3MGJhZDEwZjVjZWUiLCJ2IjoxfQ
5The concern about the influence of carbon dioxide and other greenhouse gasses
on Earth started to increase dramatically in the early 1970s with the research into
the effect of high amounts of greenhouse gasses in Venus’ atmosphere, which
turned Earth’s so-called twin into an uninhabitable world. Today, the analysis
has helped explain how carbon dioxide emissions, deforestation, and other
human activities drive global warming.4 However, there’s a considerable gap
in emissions data5, lowering the accuracy of climate preparedness strategies.
Cities dominate greenhouse gas emissions and generate self-reported emission
inventories, but their value to emissions mitigation depends on their accuracy,
which remains untested. The ambitious commitments and promises of
decarbonization, climate adaptation, and mitigation should require scaling up
the tools for collecting and analyzing the correct information.6
We explore the climate action data gap throughout this brief using the Global
Data Barometer7 (GDB) survey results. The GDB findings focus on indicators:
Emissions, Biodiversity, and Vulnerability. Emissions and, in particular, GHG
emissions are the iconic dataset for understanding climate change; this indicator
also contributes to analyzing the national governments’ status regarding the
existing and available data resources and examining the local or domestic
availability of such data. Missing submissions from countries regarding the
commitments from the macro to the micro-level and the lack of data quality
are some elements that help collect the evidence needed to prepare effective
climate action plans. To conclude, more action should be undertaken at the
local level, especially at the city level, where the data collection often happens
without accuracy, determining a poor quality and efficacy of plans to fight
climate change.
4
Six Questions to Help You Understand the 6th Warmest Year on record, available here at: https://
climate.nasa.gov/news/3139/six-questions-to-help-you-understand-the-6th-warmest-year-on-re-
cord/
5
Gurney, K.R., Liang, J., Roest, G. et al. Under-reporting of greenhouse gas emissions in U.S. cities.
Nat Commun 12, 553 (2021). https://doi.org/10.1038/s41467-020-20871-0
6
Muggah, R & Ratti, C. Cities and the Climate-Data Gap . 2022. Available at https://www.pro-
ject-syndicate.org/commentary/cities-lack-climate-data-collection-monitoring-systems-by-ro-
bert-muggah-and-carlo-ratti-2022-01
7
See Global Data Barometer. Climate Action Module. https://globaldatabarometer.org/module/
climate/
6The climate data gap
Reducing GHG emissions is the primary goal of national strategies adopted by
governments worldwide to fight climate change, andNational Greenhouse Gas
inventories are the primary tool for tracking human-induced GHG emissions at
the country, sector, and source category level (McGlynn et al. 2022). Over the next
years, these inventories will support setting and measuring progress against
each country’s “nationally determined contributions” (NDCs) for reducing GHG
emissions while also supporting domestic climate policy development and
evaluation.
Data collection and interpretation need to be improved, especially at the local
level. This is a critical aspect that reflects the lack of the tools for measuring
progress in the cities that do not have a meaningful climate-preparedness
strategy. In Asia and Africa, where a massive rise and rapidity of urbanization is
expected to happen in the next thirty years, this climate data gap reveals to be
even more dramatic. The post-Glasgow COP26 scenario is dominated by major
emitters not stepping up with adequate reduction targets for 2030. A high
number of Nationally Determined Contributions (NCDs) has been updated by
countries, with variable quality of the submissions and a significant majority not
raising ambition enough and, in many cases, not raising ambition at all. According
to the Climate Action Tracker Initiative8, more than three-quarters of countries
representing near-global emissions coverage (over 95%) and close to 90% of the
population have reported or submitted updates. Variations regarding the NDC
targets have been registered, with some countries having submitted stronger
targets and a few going beyond their initial announcements, including South
Africa, Morocco, Ukraine, and Argentina. Under current policies, these targets
are still within the expected emissions level in 2030. China has yet to commit to a
peaking year for carbon dioxide emissions before 2030, nor set absolute emission
reduction targets, which leads to uncertainty around its emissions trajectory to
2030 and it is far off a 1.5°C compatible pathway.
It is still difficult to assess whether the targets are stronger for other countries,
given the lack of details. India9 announced updated NDC targets during the
World Leaders Summit at COP26 in Glasgow but provided few details. Its new
intensity target is unlikely to have any real-world effect, as it falls above India’s
8
Climate Action Tracker. Warming Projections Global Update. 2021.https://climateactiontracker.
org/documents/997/CAT_2021-11-09_Briefing_Global-Update_Glasgow2030CredibilityGap.pdf .
2021.
9
https://climateactiontracker.org/countries/india/
7likely 2030 emission level under current policies, while its 500GW non-fossil
target will, at most, have a small impact on real-world emissions. Despite having
one of the world’s highest coal capacities and pipelines, Prime Minister Modi
promised net-zero by 2070 but did not mention any plans to phase out coal,
despite having one of the world’s highest coal capacities and pipelines.
Warming Stripes by Alexander Radtke
The analysis conducted by the Climate Tracker Initiative shows that the early
retirement of the existing capacity and reducing its pipeline could enable India
to meet its fair share and save a quarter of a million premature deaths.
Governments can significantly improve how to make emissions data available
and accurate. Global Data Barometer findings registered gaps related to quantity
(omissions) and quality (update, etc.). According to the GDB survey responses,
most countries publish mandated emissions data, but there are still significant
omissions. While most respondents (82%, 90/109) did not report evidence of
data gaps in their country, some reported evidence of “widespread omissions
in mandated data” (12%, 14/109). Some said that “a portion of mandated data is
missing” (4%, 5/109). Issues reported included: missing years, missing metadata
and only very high-level reporting with no breakdowns or more granular
information.
8Most survey respondents showed adequate national coverage (71%, 78/109), with
only a handful showing missing regions. Emissions data is not thoroughly or
regularly updated. In over two-thirds of countries, a significant number of survey
responses indicated that data was either not timely updated (54%, 59/109) or
only partially so (15%, 17/109). Some respondents reported that the latest data
they could find on official websites was from as far back as 2010 (Malawi), 2014
(Colombia), 2015 (India) or 2016 (Gambia, Cambodia).10
While many countries (54%, 59/109) affirmed that emissions data was available
from the government or because of government actions, over a quarter (33%,
36/109) answered that data is not available online, and some (12%, 14/109
countries) responded that data is available, but not as a result of government
action.
Most countries reportedly did not provide details on how land use affects
emissions. Land use is said to have significant potential for reducing emissions. It
may also affect how emissions are reported – including possibilities for countries
to overestimate the role of land-based drawdown of emissions and under-report
their emissions. Making available details of how land use affects emissions and
how it is accounted for in emissions data may help make emissions reporting
more accountable. For most countries, it was reported that emissions data either
did not include details of land-use effects (65%, 71/109) or only partially provided
details (7%, 8/109).
Some governments (e.g. Argentina, Chile) provided their pages to download
documents that included these details in national inventories and reports.11
Sweden provided an interface to select, preview and download data on “emissions
and removals of greenhouse gasses from land use, land-use change and forestry”.
Canada provides a series of web pages dedicated to “land-based greenhouse gas
emissions and removals”, including tabular data, graphs, context, and links12 and
In some cases, civil society initiatives that played an important role in making
this information accessible such as the GHG Platform India.13
10
This information was provided by survey respondents. Even in cases where data could not be
found but may be available online for those who know exactly where to look – these results may
still be taken as an indication of inaccessibility. Further details on questions and guidance for this
indicator can be found at: https://handbook.globaldatabarometer.org/2021/indicators/A.CLIMA-
TE.EMI/ mentions), Some websites mentioned were: the European Commission (26 mentions),
as well as projects such as Worldometer.info (9 mentions), Climate Watch Data (7 mentions) and
Our World In Data (7 mentions).
11
See more: https://snichile.mma.gob.cl/documentos/ and https://inventariogei.ambiente.gob.ar/
12
See more: https://www.canada.ca/en/environment-climate-change/services/environmental-indi-
cators/land-based greenhouse-gas-emissions-removals.html
13
See more: http://www.ghgplatform-india.org/afolu-sector
9Less than half of countries (48%, 53/109) were found to provide historical emissions
data enabling changes and developments in emissions and emissions reductions
to be tracked over time. Four countries make historical data available from 1960,14
which is the base year for carbon emissions data reporting at the World Bank and
other international institutions, earlier data is often based on estimates from the
Carbon Dioxide Information Analysis Center (CDIAC) in the United States, using
energy data from the United Nations Statistics Division. Over 20 other countries
make data available from 1990, the default base year 15 UNFCCC emissions reporting.16
Regarding the availability and reusability of data, over half (64%, 70/109) of countries
make data available free of charge. Data should be made available online on
governmental websites, such as national data portals or the web pages of agencies
responsible for emissions reporting (not only through international organizations
or aggregators). Emissions data should be able to be downloaded without the
requirement for payment or user registration.
Less than half (37%, 41/109) of countries provide emissions data in a way that was
explicitly legally usable. Of those that do, some use generic open licenses such as the
Creative Commons Attribution license (e.g. Czechia, Ghana, Malaysia, Netherlands,
New Zealand, Thailand, Ukraine, Uzbekistan) or the Open Database License (e.g.
Peru). Others use national data licenses or legal arrangements enabling re-uses such
as Canada, Italy, Mexico, Uruguay, and the United Kingdom. Making data explicitly
legally re-usable can be as simple as17 displaying the license on pages where data
is available. Also, less than half of countries (41%, 45/109) make data available in
machine-readable formats amenable to computational analysis and re-use.
Emissions data should be readable for both people as well as machines. This includes
the languages used in data fields as well as in associated documentation and
materials. A little more than half of the countries (52%, 57/109) were found to make
data available in official, national or major languages of that country–suggesting
that more could be done to make emissions data locally accessible and meaningful.
14
E.g. Dominican Republic, Ghana, Rwanda, Saint Lucia.
15
Such as Armenia, Australia, Belarus, Bolivia, Canada, Chile, China, Hong Kong Special Adminis-
trative Region, Colombia, Costa Rica, Czechia, Denmark, Finland, Germany, Ireland, Italy, Mexico,
Mongolia, Netherlands, New Caledonia, New Zealand, Republic of Moldova, South Korea, Spain,
Sweden, Taiwan, United Kingdom of Great Britain and Northern Ireland and Uruguay.
16
United Nations Climate Change. How to find the data needed within the GHG data interface.
https://unfccc.int/process/transparency-and-reporting/greenhouse-gas-data/how-to-find-your-
data
17
United Kingdom.Open Government Licence. https://www.nationalarchives.gov.uk/doc/open-go-
vernment-licence/version/3/
10Less than a quarter of countries (22%, 25/109) provide “accessible and open official
tools to help users explore data”. Some of those provide an interface to browse,
preview and export data (e.g. Denmark, Latvia).18 Germany provides a series of
re-usable tables, graphs and static visualizations exploring different aspects of
emissions, with options to export associated data.19 New Zealand has created
an “Interactive Emissions Tracker”, which allows users to browse emissions by
sector by gas over time using an interactive charting tool.20
Less than half of countries (44%, 49/109) provide “detailed information on sources
of greenhouse gas emissions”. The details provided included breakdowns by
year, type of pollutant, region, sector, and type of activity for those that did.
Some countries also provided emissions indicators, such as the Argentinian data
portal’s emissions per capita, per unit of electrical energy, per head of cattle.21
Many survey responses mention UNFCCC National Inventory Submissions,
including associated zip files of spreadsheets of tables produced according to
the Common Reporting Format (CRF). While this reporting format22 includes
conventions for classifying emissions types, almost two-thirds of countries (69%,
76/109) did not contain unique identifiers that would enable comparability
across inventories, reduction commitments, and sources. One notable example
of where unique identifiers were successfully used was emissions data from
Statistics Sweden, which included CRF references in brackets in its data tables
and interfaces. It also has an API enabling users to reference directly, query and
access specific parts of their emissions data.
Providing contextual information is important to interpret and make sense of
what it means, where it comes from, what it shows and what it doesn’t, in addition
18
Statistic Denmark. MRU1: Air Emission Accounts by industry and type of emission
https://www.statbank.dk/MRU1. Statistics Finland. Greenhouse gas emissions in Finland, 1990-
2020
https://pxnet2.stat.fi/PXWeb/pxweb/en/StatFin/StatFin__ymp__khki/statfin_khki_pxt_111k.px/ and
Statistics Latvia. Air emission accounts (NACE Rev. 2) 2000 - 2020
https://data.stat.gov.lv/pxweb/lv/OSP_PUB/START__ENV__GP__GPE/GPE010/table/tableViewLa-
you t1/
19
Umwelt Bundesamt. Datensuche. https://www.umweltbundesamt.de/daten/datensuche/?s=s-
core&d=desc&a=Daten%20und%20Tabelle n&t=Klima&l=de
20
Ministry for the Environment.New Zealand’s Interactive Emissions Tracker. https://emissions-
tracker.mfe.govt.nz/
21
Datos Argentina. Indicadores de emisiones de gases de efecto invernadero (GEI) https://www.
datos.gob.ar/dataset/ambiente-indicadores-emisiones-gases-efecto-invernadero-gei
22
United Nations Climate Change. National Inventory Submissions 2021 https://unfccc.int/ghg-in-
ventories-annex-i-parties/2021 and United Nations Climate Change. Reporting requirements.
https://unfccc.int/process-and-meetings/transparency-and-reporting/reporting-and-review-un-
der-the-c onvention/greenhouse-gas-inventories-annex-i-parties/reporting-requirements
11to providing detailed data. As a recent report argues, different countries “have
been following different reporting guidelines, reporting at different frequencies,
and using different reporting formats”. The importance of providing context for
data is emphasized by recent research23 advocating for “datasheets for datasets”,
attention to “data settings”, and careful consideration of context as an important
principle for fair and actionable data.24
Over a third of countries (38%, 42/109) include detailed information on greenhouse
gas emissions and targets reported to the UNFCCC in nationally published data .
The rest of the countries only report this data partially (18%, 20/109) and the rest
do not report this information at all.
Providing context is also important to assess availability relative to the
circumstances of emissions data production. For example, not all countries
are required to produce the same data following the same conventions. The
new Enhanced Transparency Framework25, established as part of the Paris
Agreement, has some transparency measures for developed countries that bear
more historical responsibility for emissions which are not required for developing
countries who have been less responsible. While tabular data is important,
discussions around the UNFCCC Subsidiary Body for Scientific and Technological
Advice have also suggested that a combination of formats (“tabular, graphical or
textual”) will be required for adequate reporting around progress on emissions
reductions.26More granular data may also thus be accompanied by narrative,
documentary and other material to provide additional context on emissions
data concerning the circumstances of the reporting country.
23
Falduto, C. and S. Wartmann (2021), “Towards common GHG inventory reporting tables for
Biennial Transparency Reports: Experiences with tools for generating and using reporting
tables under the UNFCCC”, OECD/IEA Climate Change Expert Group Papers, No. 2021/01, OECD
Publishing, Paris,https://doi.org/10.1787/38f54dbf-en
24
See, for example,: D’Ignazio, C., & F. Klein, L. (2020). Seven intersectional feminist principles for
equitable and actionable COVID-19 data. Big data & society, 7(2), 2053951720942544. and CIVIC
Data Library of Context. https://civicsoftwarefoundation.org/library/
25
United Nations Climate Change. Moving Towards the Enhanced Transparency Framework. ht-
tps://unfccc.int/enhanced-transparency-framework
26
https://unfccc.int/sites/default/files/resource/Non_paper_Oct2021_Transparency_0.pdf
12Recommendations
The insights deriving from the analysis of the GDB survey results focus on issuing,
collecting, distributing and publishing climate data The unavailability of data
impoverishes climate preparedness strategies, especially at the local and city
level, and we know that cities dominate GHG emissions. International solutions
to the emissions data problem are unclear.
Data plays a critical role in keeping track of the emissions and progress towards
reductions targets across countries, regions and sectors. Inaccuracy and
availability are two major problems affecting the effectiveness of climate action
plans. There is also a lack of standards for reporting CO2 emissions and their
absorption. As pointed out by Ratti and Muggah (2022)27, climate-preparedness
plans are closely correlated with investment in climate action, including nature-
based solutions and systematic resilience.
Strategies must be supported by scaling up data-driven monitoring platforms.
These systems, powered by satellites and sensors, can track temperatures inside
and outside buildings, alert city dwellers to air-quality issues, and provide high-
resolution information on concentrations of specific GHGs (carbon dioxide and
nitrogen dioxide) and particulate matter”. These systems could help to downsize
the under-reporting of data. The Washington Post28 has calculated a billion
tonnes a year of under-reported emissions.With no globally agreed system for
measuring carbon emissions, the door is left open for countries to misrepresent
the size of both their problems and solutions. Standards can help close that
door by ensuring ongoing, accurate measurement of real progress in the fight
against climate change.
According to a recent study published in Nature29 on US Cities, for example, cities
under-report their greenhouse gas emissions, on average, by 18.3%. Omissions
relate to particular fuels, and source types emerge with a differentiated way to
27
Ratti & Muggah, Cities and the Climate-Data Gap,
https://www.project-syndicate.org/commentary/cities-lack-climate-data-collection-monito-
ring-systems-by-robert-muggah-and-carlo-ratti-2022-01
28
The Washington Post. Countries’ climate pledges built on flawed data, Post investigation
finds. (2021).https://www.washingtonpost.com/climate-environment/interactive/2021/greenhou-
se-gas-emissions-pledges-data/
29
Gurney, Kevin Robert, Jianming Liang, Geoffrey Roest, Yang Song, Kimberly Mueller, and Tho-
mas Lauvaux. “Under-reporting of greenhouse gas emissions in US cities.” Nature communica-
tions 12, no. 1 (2021): 1-7.
13estimate transportation. The under-reporting of GHG emissions at the urban
level has caused rising concerns about self-reported inventories in planning or
assessing emissions. Estimating GHG and emissions data collection requires
accuracy and precision, whether reported by a city, state, or country. The lack of
an accurate emissions assessment makes prioritizing mitigation policy options
difficult, leading to the misallocation of scarce mitigation resources. The Nature
study on US cities raises serious concerns about the current self-reported approach
to quantifying urban GHG emissions and these dynamics may be the same in
other cities across the globe. There is progress on building a systematic emissions
quantification system that promises a systematic approach to generating space/
time-resolved, atmospherically calibrated emissions information for all cities in
collaboration with local authorities. Urban GHG mitigation practitioners could
devote time and resources to the activity under such a collaborative system, as
they have the most significant knowledge and political influence over the best
mitigation strategies for their city. This system should incorporate a clear and
coordinated strategy for the data collection process. Climate data collection at
the local level must be planned, and local governments must be better organized
to guarantee reliability and improvements to the process. Climate action plans
must be based on available and reliable data, and have commitments to improve
climate data at the local level.
Otherwise, local policies languish on a city’s websites after the publication, with
no measurement and evaluation. There is a need for more investment in data
capacity to track climate issues, and a more effective plan to improve climate
data and track progress on targets is needed. Local governments have to publish
data that people will understand. Local governments not only need to invest in
building better climate data; they also need to ask people about the climate
data they need and make that data public for communities to use.
National Greenhouse Gas inventories - the primary tool for tracking a human
GHG emissions at the country, sector, and source category level - will support
setting and measuring progress against each country’s NDCs for reducing
GHG emissions. Domestic climate policy development and evaluation
recommendations should consider the evidence of the consequences of under-
reporting, in all the aspects related to quantity and quality. Recommended
requirements on emission data provisions regard not only tackling national
omissions and data availability at the local level. Based on GDB survey data, we
can identify the following requirements needed to improve data collection and
processing: adequate coverage, regular update, timeliness, online availability,
availability of historical data, reusability, machine-readability, accessibility and
completeness.
14Conclusion
Data to support climate action are often scarce and not available. Data collected
by the Global Data Barometer survey in more than 100 countries worldwide
reveals the urgency of filling the climate action data gap, particularly at the local
government level, including big and small municipalities.
Cities are the main generators of essential data to fight climate change, however,
the lack of skills and data-driven monitoring platforms is evident, demonstrating
the need to resize every effort to track progress on targets and make progress
on the action side. The GDB findings focus on a set of environmental indicators:
Emissions, Biodiversity, and Vulnerability and contribute to analyzing the national
governments’ status regarding the existing and available data resources. he
research strongly suggests we need to focus on the subnational level since the
challenge for climate action starts f there.
1516
You can also read