Policy Paper Raising the Bar and Closing the Gap - By Paul W. Bennett, Ed.D - Atlantic Institute for Market Studies
←
→
Page content transcription
If your browser does not render page correctly, please read the page content below
RAISING THE BAR AND CLOSING THE GAP

        ATLANTIC INSTITUTE FOR MARKET STUDIES

      Policy Paper

   Raising the Bar and
    Closing the Gap
SCHOOLS, INCOME, AND STUDENT SUCCESS

      By Paul W. Bennett, Ed.D.

                     Halifax, Nova Scotia,

                          January 2019
            © 2019 ATLANTIC INSTITUTE FOR MARKET STUDIES

                                 1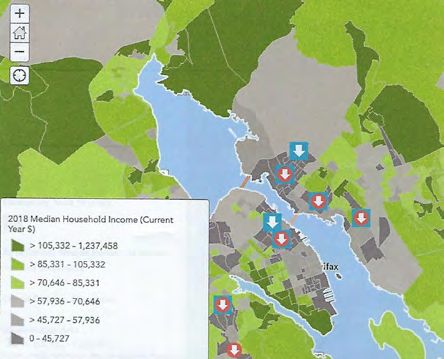
RAISING THE BAR AND CLOSING THE GAP

                      The Atlantic Institute for Market Studies (AIMS)
AIMS is a Canadian non-profit, non-partisan think tank that provides a distinctive Atlantic Canadian
perspective on economic, political, and social issues. The Institute sets the benchmark on public policy
by drawing together the most innovative thinking available from some of the world’s foremost experts
and applying that thinking to the challenges facing Canadians.
AIMS was incorporated as a non-profit corporation under Part II of the Canada Corporations Act and
was granted charitable registration by Revenue Canada as of 3 October 1994. It received US charitable
recognition under 501(c)(3), effective the same date.
287 Lacewood Drive, Suite 204,
Halifax, Nova Scotia, Canada B3M 3Y7
Telephone: (902) 429-1143

    aims@AIMS.ca                   facebook.com/AtlanticInstituteCA                      @aims_ca

    www.AIMS.ca                           /company/atlantic-institute-for-market-studies

Board of Directors
          Chairman: John Risley
 Former Chairman: John F. Irving
President and CEO: Marco Navarro-Génie
        Vice-Chair: Scott McCain (New Brunswick),
        Vice-Chair: Don Mills (Nova Scotia)
        Vice-Chair: Leo Power (Newfoundland and Labrador)
           Secretary: Fae Shaw
          Treasurer: Doug Reid, FCA
           Directors: Paul Antle, Lee Bragg, Dr. Robert Campbell, Nelson Hagerman, Dennice Leahey,
		 Todd McDonald, Jonathan Meretsky, Andrew Oland, Bob Owens, John Steele,
		 Peter Woodward.

Advisory Council
George Bishop, George Cooper, Ivan Duvar, Peter Godsoe, James Gogan, Frederick Hyndman,
Bernard Imbeault, Phillip Knoll, Colin Latham, Norman Miller, James Moir, Jr., Gerald L. Pond,
Allan C. Shaw, Joseph Shannon.

Board of Research Advisors
         Advisors: Ian R. Brodie, Charles Colgan, J. Colin Dodds, Morley Gunderson, Doug May,
		 Jim McNiven, Robert Mundell.

The author(s) of this document worked independently, and is solely responsible for the views presented here. The opinions
are not necessarily those of the Atlantic Institute for Market Studies, its directors or supporters or of other organizations with
which the author(s) may be affiliated. Any errors or omissions remain the responsibility of the author(s).

                                         © 2019 ATLANTIC INSTITUTE FOR MARKET STUDIES

                                                                2
RAISING THE BAR AND CLOSING THE GAP

                       Raising the Bar and
                        Closing the Gap
                 SCHOOLS, INCOME, AND STUDENT SUCCESS

                             By Paul W. Bennett, Ed.D.

                                    Table Of Contents
  Introduction – Closing the Student Achievement Gap                                                5

  High-Performing Schools – Weighing the Advantages                                                 9

  Struggling Schools – High Priorities for Action                                                  12

  Most Improved Schools – Lighting the Way                                                         15

  Raising the Bar and Closing the Gap – Some Viable Policy Options                                 18

  Key Recommendations                                                                              21

  References                                                                                       24

                                               Addendum
                                              Special Feature:
  Interactive Map Series: This AIMS report comes with a series of interactive maps designed and prepared
                    for us by GIS consultant Frank King and accessible through this link:
https://a-i-m-s.maps.arcgis.com/apps/MapSeries/index.html?appid=cd4a0b39299a40d2b80b28aef50db1b5.

                                           Halifax, Nova Scotia,

                                                January 2019

                                  © 2019 ATLANTIC INSTITUTE FOR MARKET STUDIES

                                                       3
RAISING THE BAR AND CLOSING THE GAP
About the Author
PAUL W. BENNETT, Ed.D
Paul W. Bennett, Ed.D. (OISE/Toronto) is founding director of Schoolhouse Institute
and Schoolhouse Consulting, Halifax, NS, and a widely known independent
education commentator in Atlantic Canada. Since April 2010, he has researched
and published nine education policy research reports with the Atlantic Institute
for Market Studies (AIMS) covering most aspects of K-12 public education.
He served as adjunct professor of education at Saint Mary’s University from
2011 to 2016 and as senior education fellow at Northern Policy Institute from
2013 to 2017.
Dr. Bennett wears many hats as a Halifax author, education consultant, policy researcher,
and news commentator. Prior to completing his doctorate at the University of Toronto,
Paul earned a Hons. B.A. in history and political science (York), a M.A. in history (York),
and a B.Ed. from the University of Toronto. Over a career spanning four decades, Paul
has taught high school history, authored three national textbooks, headed two leading
independent schools, produced many policy papers and written or co-authored eight
books. His three most recent books are The Grammar School: Striving for Excellence
in a Public School World (2009); Vanishing Schools, Threatened Communities: The
Contested Schoolhouse in Maritime Canada, 1850-2010 (2011); and The Last Stand:
Schools, Communities and the Future of Rural Nova Scotia (2013).
Today Paul provides expert commentary and regular columns for The Chronicle Herald,
The Globe and Mail, The National Post, and a variety of other publications. His most
recent academic articles have appeared in The Journal of Sports History, Historical
Studies in Education, Acadiensis, Canadian Issues, and the Royal Nova Scotia Historical
Society Journal.
Dr. Bennett specializes in K-12 educational policy, education history, evidence-based
teaching practice, educational standards, school governance, teacher education, and
special education services. In November 2017, he chaired the first Canadian conference
of research education, a global community of teachers committed to advancing
evidence-based teaching practice.
Acknowledgments
A few individuals deserve special recognition for their contributions to this research project.
The idea originated as a proposal presented to Fred Vallance-Jones in the summer of
2011 during a data journalism course at the University of King’s College. It was nurtured
and developed over several years with Marco Navarro-Genie, president of the Atlantic
Institute for Market Studies. All of the interactive maps were designed and prepared by
Frank King, a GIS consultant based in Halifax, NS.
© 2019 ATLANTIC INSTITUTE FOR MARKET STUDIES
4RAISING THE BAR AND CLOSING THE GAP
Introduction –
Closing the Student Achievement Gap
Student performance can be highly varied within school systems. Differences among
children and teens from various classes or groups, marked by income, ethnic, or
racial disparities, are commonly termed the “achievement gap”. Children of affluence
and children of poverty live in different worlds which are strongly influenced by
their socio-economic status, usually measured in mean household income (Haycock,
2001a; Ferguson, Bovaird, and Mueller, 2007). Another factor is where they live,
and this is defined by their postal code or place of residence. In places where strict
elementary school attendance zones are maintained, your school catchment area
can determine the quality of your education. This is what might be called “postal
code education” (Mills, 2015a; Bennett, 2018). Where school boundaries are rigidly
enforced, particularly in disadvantaged school communities, it becomes the iron law
of public education.
School system leaders tend to be reticent about disclosing school-by-school student
achievement results. There is a fine line between identifying struggling schools and
labelling them. “We identify schools and where they are on the improvement journey,”
says Elwin LeRoux, Halifax’s regional director of education. “Yet we are careful not
to ‘label’ some schools in ways that may carry negative connotations and influence
student attitudes” (LeRoux, 2018a).
School-by-School Comparative Analysis –
What Can Be Learned
Comparing and ranking schools on the basis of student test scores is a controversial
practice, but it remains one of the few ways we can assess how our school systems
are actually performing. Critics of school rankings maintain that they place undue
emphasis on academic achievement, focus mostly on literacy and mathematics,
and can have a detrimental effect on chronically low-performing schools (Raptis,
2012a; People for Education, 2013). Defenders of school comparisons contend that
education is a public service and parents have a right to know how their students
and schools are performing (Cowley, 2016). Mapping the school results against
household family income helps us to see how schools rank in relation to socio-
economic factors (Alphonso and Grant, 2013a). Such information is not only quick
and easy to understand, but very helpful in ensuring that parents are better informed
and more effective advocates for school improvement (Cowley, 2016).
© 2019 ATLANTIC INSTITUTE FOR MARKET STUDIES
5RAISING THE BAR AND CLOSING THE GAP
Ranking schools is not an exact science, especially when we are dependent upon
publicly accessible provincial and school district data. We must be cognizant of the
limitations of such studies, even when the results are presented in a socio-economic
context. Test score rankings do not consider how well schools do beyond the acquisition
of academic knowledge and skills. Rankings are, however, the one publicly accessible
and reasonably reliable means of assessing the quality of education (Alphonso and
Grant, 2013b; Pekoskie, 2014a). In this study, comparing schools is the means to a
more significant end – school improvement. This research report tackles the biggest
challenge of all – finding viable policy responses to foster high achievement while
reducing glaring inequities.
No child’s future should be determined by their postal code, but there is strong
evidence that it matters. Real estate agents are quick to point out “preferred school
districts” and new families tend to move onto streets where they feel comfortable
(Davis, 2016; Elgart, 2016). School location or postal code is one of the critical factors
influencing student success and research confirms that it contributes to inequality
in student achievement (Willms, 2003; Brownell et al., 2006; Pekoskie, 2014b;
Owens, 2018).
What matters is how a school district identifies and responds to struggling schools.
Accepting the socio-economic dictates or ignoring the stark realities is not good
enough because it only serves to reinforce ingrained assumptions. It also contributes
to lowered academic expectations, and can adversely influence school leadership,
student behaviour standards, teacher attitudes, and parent-school relations
(Barr and Parrett, 2007). While there are risks in comparing school performance,
parents and the public are entitled to know more about how students are performing
in relation to socio-economic factors influencing their success (AIMS Map Series,
2018a; Environics, 2018a).
The Case Study – The Halifax Regional School System
The impact of postal code education is ripe for re-examination and Atlantic Canada’s
largest school system, the Halifax Regional Centre for Education (formerly the Halifax
Regional Board of Education) provides a useful lens through which to tackle the
whole question. Student achievement results from 2008-2009 to the near present
are published in school-by-school community reports (HRBE, 2009; HRCE, 2018a) and
provide clear evidence of how schools are performing in Halifax Region, the flagship
district in Nova Scotia.
The HRCE (2018b) enrolls 47,770 students in 135 schools. Former superintendent
Carole Olsen introduced the existing accountability system in 2008-2009 along
with a new “Good Schools to Great Schools” mission that set a far more specific
© 2019 ATLANTIC INSTITUTE FOR MARKET STUDIES
6RAISING THE BAR AND CLOSING THE GAP
goal: “Every student will learn; every school will improve” within five years (HRSB
Superintendent’s Report, 2009a). Following the release of board-wide data, the HRSB
produced school-by-school accountability reports, and made them available to the
school advisory councils (SACs), and to all parents in each school (CBC News NS,
2009). School-by-school reporting was critical to that whole project. “Knowing how
each school is doing is the first important step in making sure resources and support
reach the schools – and the students – that need them the most,” Olsen declared
(HRSB Superintendent’s Report, 2009b).
The school year 2008-2009 provided the benchmark, not only for the board, but
for this research report taking stock of student achievement and school-by-school
performance over the past decade. The first set of student results in the two core
competencies, reading and math, demonstrated that HRSB student scores were
comparable to other Canadian school systems, but there was room for improvement.
In Grade 2 reading, the system-wide target was that 77 percent of all students would
meet established board standards. Only 25 out of some 91 schools (27.5 percent)
met or exceeded the established target. While Grade 2 and Grade 5 mathematics
students performed better, problems surfaced at the Grade 8 level where two out
of three schools (67.5 percent) failed to meet the HRSB standard, struggling with
measurement, whole number operations, and problem-solving (HRSB Superintendent’s
Report, 2009c, 4-7).
Schools in the Halifax system may have exceeded initial public expectations, but by
the 2013 target year the vast majority of struggling schools fell far short of moving
from good schools to great schools (HRSB Superintendent’s Report, 2011). Switching
to system-wide data reporting in 2011 made it next to impossible to properly
assess improvement. In September 2012, Olsen was appointed deputy minister of
education for Nova Scotia and Elwin LeRoux, a 24-year board veteran, succeeded
her (Arnenburg, 2012; Cape Breton Post, 2013). The robust HRSB commitment to
school-by-school improvement and demonstrably improved standards in reading and
mathematics faltered. The school community reports, appended routinely as PDFs to
school websites, attracted little attention (HRCE, 2018c).
The “Good Schools to Great Schools” initiative had failed to work miracles. A May
2014 report to the board put it bluntly: “A large achievement gap exists between
overall board results and those students who live in poverty.” Twenty of the board’s
84 elementary schools were identified as struggling and designated as “priority
schools” requiring more attention, enhanced resources, and extra support programs
to close the student achievement gap (HRSB Report, November 2016; Tomie, 2018).
The focus changed when the 2017-2018 provincial results in Grade 6 math and
literacy revealed that struggling students not only lived in poverty, but came
disproportionately from marginalized communities (HRSB Report, March 2018).
© 2019 ATLANTIC INSTITUTE FOR MARKET STUDIES
7RAISING THE BAR AND CLOSING THE GAP
Students of African descent were identified as underperforming, particularly in Grade
6 mathematics, where scores dropped two percent, leaving less than half (49 percent)
meeting provincial standards. A school improvement project focused on lower socio-
economic schools evolved into one addressing differences along ethno-racial lines. A
whole new initiative driven by what was known as “culturally responsive” teaching
and learning superseded school-by-school improvement (HRSB Board Report, 2017).
Comparing school-by-school performance over the past decade runs smack up
against socio-economic inequalities and the reality of “postal code education”, raises
critical questions, and yields some startling results. Raising achievement levels while
reducing glaring inequities is the biggest challenge of all and one worthy of our
attention in this study.
© 2019 ATLANTIC INSTITUTE FOR MARKET STUDIES
8RAISING THE BAR AND CLOSING THE GAP
High-Performing Schools –
Weighing the Advantages
Tall poppies and undernourished plants stand out in the garden. The same is true for
high-performing schools and struggling ones – and the HRCE system is no exception.
Prying that information away from school authorities can be a formidable challenge,
even through the time-consuming, formal freedom-of-information access process.
Senior district staff publish individual school results, but studiously avoid comparing
schools, claiming that it is “unfair and misleading” to compare them based only on
academic achievement scores (Raptis, 2012b; LeRoux, 2018b). Active and engaged
parents are quick to find student and school performance data posted on websites
and shared among educators. They also know that the established benchmark is the
percentage of students “meeting expectation”, usually defined as the established
board or provincial standard of competence (Nova Scotia PLANS, 20015-2016).
With few exceptions, students attending elementary schools in Halifax’s most affluent
districts outperform all others in achievement. Our study confirmed this common
assumption by comparing student test scores in HRSB’s benchmark year, 2008-2009,
with those in 2015-2016, eight years later (HRSB School Reports, 2008-2009 and
2015-2016).
Three of the top five performing Halifax elementary schools – Sir Charles Tupper,
LeMarchant-St. Thomas, and Inglis Street – are located in the city’s affluent South
End, all close to the downtown campuses of two universities, Dalhousie and Saint
Mary’s. In all three schools, over 92 percent of all students in Grades 3 to 6 met or
exceeded established standards in reading and mathematics (Tables 1 and 2).
LeMarchant-St. Thomas is essentially a magnet school, offering French immersion
programming attractive to upwardly mobile, university-educated parents. It competes
with three of Nova Scotia’s best-known independent private schools, Halifax Grammar
School, Sacred Heart School /Fountain Academy, and Armbrae Academy, all located
in neighbourhoods populated by highly paid professionals in the health care and
university sectors (Bennett, 2009; Environics, 2018b).
The top 10 schools out of 95 elementary school programs, ranked on the reading
and math scores of their students, were located in the South End, two Dartmouth
suburbs (Colby Village and Portland Estates), northern exurbs, (Waverley and Fall
River), and in old Dartmouth (Crichton Park and Hawthorn). Two other schools where
students perform exceedingly well are in the city’s western outer suburbs – Shatford
Memorial in Hubbards and Kingswood in Hammonds Plains (mathematics). Students
are attracted to the tiny primary-to-Grade 6 Hubbards School of 80 students by the
© 2019 ATLANTIC INSTITUTE FOR MARKET STUDIES
9RAISING THE BAR AND CLOSING THE GAP
opportunity to qualify for Shatford Memorial Trust scholarships, averaging $275,000
a year, which are awarded to graduates upon entrance to university or college.
Schools in Bedford, a fast-growing suburb popular with young families and with
pockets of high-income enclaves, finished just outside the top 10 in Grades 3 to 6
reading. Crowded schools, larger classes, and long bus rides may well explain the
lower than anticipated student test scores.
Table 1: High-Achievement Elementary Schools – Reading
Halifax Regional Centre for Education, 2008-2009 and 2015-2016
Reading Reading Reading Reading Average
Grade 3 Grade 6 Grade 3 Grade 6 Total Score Meeting
Name of School (Rank) 2008-09 2008-09 2015-16 2015-16 (400) Standard
LeMarchant-St. Thomas (1) 100 94 89 92 375 93.8
Colby Village (2 Tie) 100 97 79 92 368 92.0
Sir Charles Tupper (2 Tie) 97 94 83 94 368 92.0
Inglis Street (3) 100 100 77 88 365 91.3
Waverley Memorial (4) 100 96 82 86 364 91.0
Portland Estates (5) 91 94 84 89 358 89.5
Shatford Memorial (6) 100 100 75 82 357 89.3
Bel Ayr Elementary (7) 95 94 80 87 356 89.0
Crichton Park (8 Tie) 82 97 80 95 354 88.5
St. Stephen’s (8 Tie) 90 85 77 100 354+ 88.5
Ash Lee Jefferson (9) 89 93 84 86 352 88.0
Hawthorn (10 Tie) 87 100 77 85 349 87.3
Smokey Drive (10 Tie) 87 98 76 NR 261 (3) 87.0
Basinview Drive (11 Tie) 89 100 68 81 347 86.8
Bedford South (11 Tie) 93 96 79 79 347 86.8
© 2019 ATLANTIC INSTITUTE FOR MARKET STUDIES
10RAISING THE BAR AND CLOSING THE GAP
Table 2: High-Achievement Elementary Schools – Mathematics
Halifax Regional Centre for Education, 2008-2009 and 2015-2016
Math Math Math Math Average
Grade 3 Grade 5 Grade 4 Grade 6 Total Score Meeting
Name of School (Rank) 2008-09 2008-09 2015-16 2015-16 (400) Standard
Sir Charles Tupper (1) 97 100 94 98 389 97.3
Inglis Street (2) 93 100 91 96 380 95.0
LeMarchant-St. Thomas (3) 97 100 94 86 377 94.3
Portland Estates (4) 86 98 96 93 373 93.3
Kingswood Elementary (5) 90 94 88 85 357 89.2
Bedford South (6) 85 98 83 89 355 88.8
Colby Village (7) 76 100 89 88 353 88.3
Basinview Drive (8 Tie) 94 85 88 82 349 87.3
Crichton Park (8 Tie) 84 90 83 92 349 87.3
Ash Lee Jefferson (9) 86 95 83 81 345 86.3
Waverley Memorial (10) 76 88 87 90 341+ 85.3
Bel Ayr Elementary (11) 94 100 55 90 339 - 84.8
Smokey Drive (12) 71 93 89 NR 253 (3) 84.3
Applying postal code analysis to assess the composition of Halifax’s top-performing
elementary schools confirms popular preconceptions. Boring deeper using Environics
Analytics PRISM5 software, the city’s highest achievement schools prove to reflect
fairly accurately their urban lifestyle segmentation profiles based upon postal code
location (Environics, 2014; Mills, 2015b). Students attending the top 10 schools come
mostly from higher income segments dubbed “suburban success” (i.e., Halifax Central
JHS and Inglis Street Elementary). These segments are predominantly composed of
the established professional class with 2016 average household incomes of $193,000
and include the exurban wonderland (Colby Village and Kingswood), composed of
prosperous professional families with incomes in the $140,000 range. Two schools
in modest, middle-income rural communities – Shatford Memorial and Waverley
Memorial, outside the Peninsula in postal districts averaging household incomes of
$84,000 and $64,000 – bucked the trend. This suggests that other factors, including
school climate, program excellence, or teacher quality were at play in those school
communities (Environics, 2018c; AIMS Map Series, 2018b).
© 2019 ATLANTIC INSTITUTE FOR MARKET STUDIES
11RAISING THE BAR AND CLOSING THE GAP
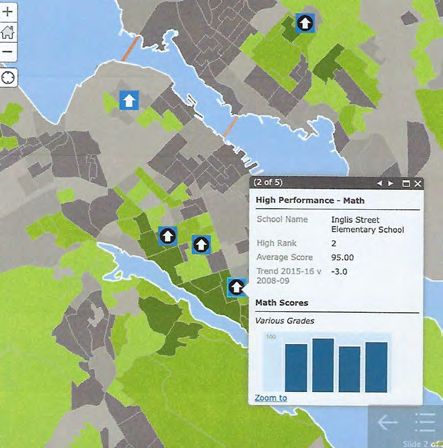
Figure 1:
High Performing Schools, City
of Halifax, 2008-09 to 2015-16.
A screen shot taken from the
interactive AIMS map showing
the location of top performing
elementary schools in relation
to main household income data.
Student performance was highest
in school attendance zones where
mean household income exceeded
the Statistics Canada 2018
benchmark of $85,331. You can
access the results for individual
schools by clicking on the school
in the online interactive version.
Shown here are the results for
Inglis Street Elementary, ranked
second in Mathematics. Visit
AIMS.ca/PostalCodeEducation
for the full interactive version.
Figure 2:
High Priority Schools, Halifax
and Region, 2008-09 and
2015-16.
A screen shot taken from the
interactive AIMS map showing
the location of struggling
elementary schools in relation
to main household income
data. Student performance was
lowest in school attendance
zones where mean household
income fell below the Statistics
Canada 2018 benchmark of
$57,936. You can access the
results for individual schools
by clicking on the school in the
online interactive version. Visit
AIMS.ca/PostalCodeEducation
for the full interactive version.
© 2019 ATLANTIC INSTITUTE FOR MARKET STUDIES
12RAISING THE BAR AND CLOSING THE GAP
Struggling Schools – High Priorities for Action
In 2014 LeRoux and senior staff identified 20 of the HRCE’s 95 elementary schools
(21.5 percent) as priority schools where students “consistently perform below
provincial standards” in literacy and mathematics. The 10 lowest performing schools,
comparing 2008-2009 and 2015-2016 student results, confirm the HRSB’s 2014 study
findings that the struggling elementary schools tend to be located in disadvantaged
neighbourhoods in identifiable low-income pockets of Halifax Region.
The most acute high-priority schools are located in North End Halifax (Joseph
Howe), North Preston (Nelson Whynder), Lake Echo/East Preston (Bell Park Centre),
Dartmouth North (Harbour View), Spryfield (Chebucto Heights), and Dartmouth/
Woodside (Dartmouth South Academy). Students attending schools in these zones
score below 50 percent of the provincial standard in mathematics and less than 60
percent in reading (Tables 3 and 4).
Table 3: High-Priority Elementary Schools – Reading
Halifax Regional Centre for Education, 2008-2009 and 2015-2016
Reading Reading Reading Reading Average
Grade 3 Grade 6 Grade 3 Grade 6 Total Score Meeting
Name of School (Rank) 2008-09 2008-09 2015-16 2015-16 (Trend) Standard
Joseph Howe (1) 35 43 20 45 143- 35.8
Nelson Whynder (2) 50 100 11 NR 161 (3) - 53.6
Bell Park Centre (3) 54 75 33 62 224- 56.0
Harbour View (4) 83 48 37 58 226 - 56.5
Dartmouth South* (5) 66 81 52 35 234 - 58.5
John MacNeil (6) 53 67 50 71 241 60.2
Chebucto Heights (7) 69 89 22 63 243 - 60.8
George Bissett (8) 50 77 69 53 249 62.3
Rockingstone Heights (9) 67 80 41 64 252- 63.0
St. Joseph’s-A. MacKay (10) 75 91 18 73 257 - 64.3
Bicentennial School (10) 55 86 43 73 257 64.3
William King (11) 64 88 65 63 273 68.3
Colonel John Stuart (12 Tie) 59 80 68 70 277- 69.3
Sycamore Lane (12 Tie) 69 76 65 NR 210 (3) 70.0
© 2019 ATLANTIC INSTITUTE FOR MARKET STUDIES
13RAISING THE BAR AND CLOSING THE GAP
Table 4: High-Priority Elementary Schools – Mathematics
Halifax Regional Centre for Education, 2008-2009 and 2015-2016
Math Math Math Math Average
Grade 3 Grade 6 Grade 4 Grade 6 Total Score Meeting
Name of School (Rank) 2008-09 2008-09 2015-16 2015-16 (Trend) Standard
Nelson Whynder (1) 43 62 17 NR 122 (3) - 40.6
Joseph Howe (2) 0 78 38 18 134 - 44.6
Harbour View (3) 53 83 38 12 186 - 46.5
Bicentennial School (4) 46 62 44 47 199- 49.8
Chebucto Heights (5) 33 85 39 46 203- 50.8
Bell Park Centre (6) 53 56 50 45 204- 51.0
Central Spryfield (7) 43 78 56 35 212- 53.0
Dartmouth South* (8 Tie) 27 65 85 45 222 55.5
Rockingstone Heights (8 T) 73 58 53 38 222- 55.5
George Bissett (9) 62 65 68 52 247 61.8
Colonel John Stuart (10) 46 70 90 50 256 64.0
Admiral Westphal (11) 73 92 63 29 257- 64.3
Duc d’Anville (12) 81 70 52 60 263- 65.8
Most of the struggling schools were located in urban, mostly rental-housing postal
code districts or in aging suburbs exemplifying the “suburbanization” of poverty
(Klenavic, 2013). Community development advocates describe Harbour View, a North
Dartmouth School, as “the Priority School of all Priority Schools.” Over 85 percent of
the dwelling units in the census tract where Harbour View is located, for example,
consist of low-rental private market housing, much of it built since the 1970s. Student
misbehaviour regularly disrupts learning at Harbour View and, according to one
service provider, “the HRSB Caring Schools program doesn’t work in such schools.”
In the North End district where Joseph Howe School is located, the average household
income was $44,190, indicating that families are mostly drawn from the lowest two
income groups (Environics, 2018d). On the suburban fringe, off the Halifax Peninsula,
the low-performing schools tend to be situated in lower income school attendance
areas like Spryfield, Woodside, and Preston (AIMS Map Series, 2018c).
“Breaking the cycle of poverty has to be at the center of the agenda,” says Betty
Watson-Borg, project leader at Between the Bridges, a Dartmouth North community
development initiative. “Student success is one of the cornerstones, but it won’t
happen without the collective impact of everyone working together.”
© 2019 ATLANTIC INSTITUTE FOR MARKET STUDIES
14RAISING THE BAR AND CLOSING THE GAP
Most Improved Schools – Lighting the Way
School improvement in metropolitan school systems can be a herculean challenge –
and it has defeated wave after wave of reform initiatives. School leadership, teacher
effectiveness, and program excellence can make a difference, but so can demographic
shifts affecting the school’s student composition.
Olsen’s “Good Schools to Great Schools” initiative attempted to raise achievement
standards. Its successor, the Priority Schools project, targets 20 schools falling short
of provincial standards and provides enhanced learning supports aimed at closing the
achievement gap. The greatest gains in student achievement, based upon our analysis,
were not registered by schools targeted for classroom learning supports, but rather by
schools benefiting from either accelerated academic programs or community-based
student support programs. Shifts in the socio-economic composition of attendance
area neighbourhoods were also significant contributors to improved student test
scores (Prouse et al., 2014a).
Biggest Gain in Achievement – St. Stephen’s Elementary School
The most improved Halifax elementary school from 2008-2009 to 2015-2016, based
upon student scores, was St. Stephen’s Elementary, a small P-6 school with a stable
enrolment of 200 students located in the Halifax North End. In 2008-2009, 85 percent
of St. Stephen’s Grade 6 students met reading expectations; six years later, everyone
in the class made the grade. In the case of Grade 6 mathematics, St. Stephen’s
student scores rose from 69 percent to 89 percent, a 20-percentage point gain.
A combination of factors drives student success at St. Stephen’s – school climate,
teaching, and class composition. Demographic shifts and gentrification since 2005
have turned the neighbourhood into a preferred school attendance area for younger
urban professionals with average household incomes hovering around $120,000. It is
a prime example of the impact gentrification is having on the North End of the Halifax
Peninsula (Ley, 1985; Prouse et al., 2014b). The arrival of upwardly mobile residents
has displaced older, lower income individuals. The changes in social class composition
accompanying gentrification also help explain improved scores at Highland Park JHS.
In addition to St. Stephen’s, a half-dozen or more Halifax elementary schools
show marked improvement in mathematics and reading (Table 5). In Grades 3 to
6 mathematics, the most improved schools were: Waverley Memorial (Waverley),
Shatford Memorial (Hubbards), and Crichton Park (Old Dartmouth). Smokey Drive
Elementary – a newer P-5 Lower Sackville school with 250 students – has produced
better results in Grade 4 mathematics, judging from recent scores. Aside from St.
Stephen’s, the most improved in Grades 3 to 6 reading were Dutch Settlement
© 2019 ATLANTIC INSTITUTE FOR MARKET STUDIES
15RAISING THE BAR AND CLOSING THE GAP
(Rural HRM) and St. Catherine’s (early French immersion, Halifax West). Students at
Dartmouth’s Crichton Park School achieved sound results in both mathematics and
reading.
Table 5: Most Improved Elementary Schools, Mathematics and Reading
Halifax Regional Centre for Education, 2008-2009 and 2015-2016
Math Math Math Math Trend
Grade 3 Grade 6 Grade 4 Grade 6 Shift in Grade 6/
Name of School (Rank) 2008-09 2008-09 2015-16 2015-16 Total Score Overall
Waverley Memorial 76 88 87 90 164/177 +2/+13
Shatford Memorial 67 NR 100 73 134/173 NR/+39
Crichton Park 84 90 83 92 174/175 +2/+1
St. Stephen’s Elementary 93 69 67 89 162/156 +20/-6
Smokey Drive 71 93 89 NA 169/NA + NR
Reading Reading Reading Reading Trend
Grade 3 Grade 6 Grade 3 Grade 6 Shift in Grade 6/
Name of School (Rank) 2008-09 2008-09 2015-16 2015-16 Total Score Overall
St. Stephen’s Elementary 90 85 79 100 175/ 179 +15/ + 4
Dutch Settlement 64 67 82 57 131/139 -10/ + 8
Crichton Park 82 97 80 95 179/175 -2/-4
Sir Charles Tupper 97 94 83 94 191/177 Even/-14
St. Catherine’s 69 89 89 76 158/ 165 -13/ +7
Bright Spots in Higher Grades
Nine of Halifax Region’s 36 junior high-level programs are trending toward
improvement in either reading or mathematics (Table 6). One South End school
underperforming in 2008-2009 was Gorsebrook JHS (Halifax South End). Since then,
student achievement levels have rebounded in both Grade 8 mathematics (+12) and
Grade 8 reading (+2).
From 2008-2009 to 2015-2016, Grade 8 reading scores at Oxford School rose
dramatically from a low of 54 percent meeting the standard to 76 percent eight
years later, a gain of 22 percentage points. In the Halifax North End, reading scores
also rose 16 points at Highland Park JHS, located not far from its fast-improving
feeder school, St. Stephen’s. Grade 8 students at A. J. Smeltzer (Lower Sackville) and
Gorsebrook JHS registered less dramatic improvements.
© 2019 ATLANTIC INSTITUTE FOR MARKET STUDIES
16RAISING THE BAR AND CLOSING THE GAP
Table 6: Most Improved Junior High Schools, Mathematics and Reading
Halifax Regional Centre for Education, 2008-2009 and 2015-2016
Math Math Average
Grade 8 Grade 8 Meeting
Name of School 2008-09 2015-16 Total Score Standard Trend
Herring Cove JHS 66 84 150 75.0 +18
Gorsebrook JHS 75 87 162 81.0 +12
Eric Graves Memorial JHS 75 81 156 78.0 +6
Oyster Pond Academy 65 67 132 66.0 +2
Eastern Passage Centre 56 57 113 56.5 +1
Reading Reading Average
Grade 8 Grade 8 Meeting
Name of School 2008-09 2015-16 Total Score Standard Trend
Oxford School 54 76 130 65.0 +22
Highland Park JHS 62 78 140 70.0 +16
A. J. Smeltzer JHS 57 64 121 60.5 +7
Gorsebrook JHS 83 85 168 84.0 +2
© 2019 ATLANTIC INSTITUTE FOR MARKET STUDIES
17RAISING THE BAR AND CLOSING THE GAP
Raising the Bar and Closing the Gap –
Some Viable Policy Options
The goal of transforming “Good Schools into Great Schools” set the strategic direction
and drove resource allocation, primarily into raising achievement standards and
closing the gap for students in more disadvantaged school communities. The stated
vision was crystal clear: “By 2013, every school in the Halifax Regional School Board
will demonstrate improvement in student learning. Every student can learn. Every
student will learn” (HRSB Superintendent’s Report, 2008d). A comparative analysis
of changes in student achievement, school-by-school, starting in that 2008-2009
benchmark year and extending to the end of 2015-2016 demonstrates that not only
did the HRSB fall short of its overarching strategic goal, but dozens of elementary
schools continued to falter in achievement. Educational inequalities also remained
resistant to school improvement initiatives (HRSB Report, 2014).
The school district’s response to the stubborn problem of student underperformance
was consistent with the conventional approach – providing targeted learning supports
and more resources to address the achievement gap and working toward alleviating
the inequalities. The unstated assumption prioritized rectifying deficits rather than
raising standards across the board. Grade inflation and rising high school graduation
rates would take care of concerns about lagging achievement at higher grade levels
(HRBE, 2008-2009; HRSB, 2015-2016).
The Gap – From the Outside Looking In
Halifax school improvement efforts look different when viewed from outside the
system. Mark Fraser, former chair of the Halifax Chamber of Commerce, worked on
the city’s Poverty Reduction project and came away with the distinct impression that
the HRSB leadership was “treading water”. “Getting on top of operational issues was
taking priority over tackling longer-term issues related to charting the way forward,”
Fraser says. His successor, Cynthia Dorrington of Vale and Associates, is concerned
about students being left behind. “From an employer’s perspective,” she says, “we
continue to have concerns about the levels of literacy and numeracy.”
Community service agencies see first-hand what’s going on in and around the schools,
particularly in disadvantaged neighbourhoods. Alison O’Handley, executive director
of Dartmouth Learning Network, Darren Hirtle, HRM community developer in North
Dartmouth, and Betty Watson-Borg all express similar concerns
© 2019 ATLANTIC INSTITUTE FOR MARKET STUDIES
18RAISING THE BAR AND CLOSING THE GAP
Problems can go unattended to because of the impregnable silos separating schools
from community-based services. Promising after-school tutoring programs end up
shoe-horned into regular school hours. Investing so heavily in staff training and
resources is problematic in schools with too much staff turnover. Transient school
populations make teaching a challenge and aggravate the turnover problem prevalent
among teachers in struggling schools (Arnold, 2018; O’Handley, 2018; Watson-Borg,
2018).
Three Possible Turnaround Strategies
Confronted with sliding educational standards and stark achievement gaps, provincial
and district education authorities tend to adopt one of three strategies. They are:
1. The Student Challenge Model
Challenging students starts at the top and requires a collective effort. Striving for
excellence raises everyone’s boat in the school system. It requires a laser-like focus
on improving school climate, setting higher curriculum expectations, providing the
foundational skills, ensuring teacher effectiveness, and better preparing students for
post-graduate programs. Collective efficacy is achieved when principals and teachers
firmly believe and have confidence in their capacity to advance achievement at all levels
(Donohoo, 2017). The HRSB “Good Schools to Great Schools” initiative and offering the
IB Diploma Program (Nova Scotia, IB, 2018) province-wide are two prime examples.
2. The Learning Supports Model
Achieving educational equity is the priority and that means recognizing and successfully
addressing learning deficits and systemic inequities. School leadership is charged with
developing a support model to improve achievement by closing the gaps in literacy
and mathematics. School support teams bring together system resources to tackle
the deficits, using specialized support personnel such as literacy coaches and math
mentors (Adelman and Taylor, 2006). This conventional strategy is best exemplified in
the HRSB “Priority Schools” initiative which now focuses on training educators to be
more “culturally responsive” in their teaching practice (McLeod, 2015).
3. The Community Reconstruction Model
More radical community-based strategies are in order when conventional learning
support strategies fall short. Struggling schools are identified, with most situated in
postal code districts populated by impoverished families and children. Turning around
such schools requires a total reclamation effort engaging not only the principal and
teachers, but parents, community groups, and social service agencies (Bennett, 2014).
© 2019 ATLANTIC INSTITUTE FOR MARKET STUDIES
19RAISING THE BAR AND CLOSING THE GAP
The best-known example of the educational reconstruction model is Geoffrey
Canada’s Harlem Children’s Zone, an urban, school-centered, community renewal
project which included self-governing Success Academies (Tough, 2009; Mathews,
2009). The highly acclaimed Pathways to Education Program, initiated in Toronto’s
Regent Park, provides community-based after-school programming in zones with
the highest high school dropout rates (Chebucto Community Connections, 2018;
Mackenzie, 2018).
Figure 3:
Spryfield School Attendance
Zone, Pathways to Education
Halifax, 2018.
A map showing the Spryfield
area schools in the identified
attendance zone where the
high school dropout rate
exceeded 50 percent in 2011.
Since the advent of Pathways
to Education graduation
rates have risen and so have
student scores in Mathematics
at J.L. Ilsley High School and
local junior highs. Visit AIMS.
ca/PostalCodeEducation for
the school-by-school student
performance results.
© 2019 ATLANTIC INSTITUTE FOR MARKET STUDIES
20RAISING THE BAR AND CLOSING THE GAP
Key Recommendations
Accepting the dictates of postal code education will never be good enough for Halifax
schools. Here are a few recommendations to both raise student achievement and
address the stubborn inequities:
1: Full Disclosure of Student Performance Data, School-by-School
The public has a right to know how its schools are performing. Recognize that
informed parents can be allies in school improvement.
2: Raise Student Achievement Standards
Growing student achievement should be a higher priority system-wide, and that likely
means abandoning the current focus on social promotion and raising graduation
rates. A few steps in that direction would include:
• Completely revamping the early reading and mathematics programs by running
control trials and introducing evidence-based alternatives such as Halifax Learning’s
“Spell Read” and John Mighton’s JUMP Math;
• Reviewing all Grade 7 to 9 students on Individual Learning Programs (IPPs) and
ensure that they are properly placed to achieve student success;
• Developing a student rewards program recognizing excellence, and student and
school improvement;
• Phasing out current student evaluation policies that undermine academic standards
and inadvertently weaken students’ work ethic, perseverance, and determination
to succeed.
3: Establish Education Reconstruction Zones
Identify struggling elementary schools in dire need of improvement and declare their
attendance zones to be priority neighbourhoods for educational renewal. Expand
the learning supports model to make it part of a broader, community-wide project.
Engage active parents and local community groups, and mobilize local enterprises
and community services to address the educational inequities. In short, turn priority
schools into priority neighbourhoods (USDE, 2018)
4: Develop a School District Version of Pathways to Education
By all accounts, Pathways to Education Spryfield has succeeded in dramatically raising
graduation rates in one of Halifax’s most disadvantaged communities.
© 2019 ATLANTIC INSTITUTE FOR MARKET STUDIES
21RAISING THE BAR AND CLOSING THE GAP
Instead of waiting for the Toronto-based organization to approve another site,
initiate plans to develop community-based programs in the Dartmouth North, the
Halifax North End, North Preston, and Woodside. Set a target of raising student
grades and reducing the dropout rate in those communities.
5: Embrace a Two-Track Strategy – Educational Excellence and Equity
Develop a much broader, more comprehensive plan to advance educational
excellence and equity together, rather than focusing almost exclusively on raising
the achievement levels of those schools consistently performing below provincial
standards. Improving schools involves raising the bar as well as ministering to the
needs of those falling between the cracks.
Children and parents living in poverty and surveyed in 2001 by the U.S.-based
Education Trust put it best: “What hurts us more is that you teach us less.” We have
to guard against lowering our expectations for disadvantaged students. What is not
acceptable, in American researcher Kati Haycock’s words, is to “take students who
have less to begin with and then systematically give them less in school” (Haycock,
2001b).
LeRoux is an optimist by nature and sounds undaunted by the everyday challenges
facing the system. Surveying the legacy of the “Good Schools to Great Schools”
initiative, he remains determined to stay the course and press on with a more
“differentiated approach” tailored to the unique needs of schools across the
spectrum. “All of our schools are still expected to improve,” he says, “but they start
from different places.” Accepting the dictates of socio-economic factors will never be
good enough when there is a better way forward.
© 2019 ATLANTIC INSTITUTE FOR MARKET STUDIES
22RAISING THE BAR AND CLOSING THE GAP
References
Primary
Halifax Regional Centre for Education. 2018. About the HRCE, HRCE by the Numbers. Dartmouth: HRCE, September.
Website.
Halifax Regional Centre for Education. 2018. School Community Reports, all schools, 2015-2016.
Halifax Regional School Board. 2008. Superintendent’s Annual Report, Good Schools to Great Schools. Dartmouth:
HRBE, May.
Halifax Regional School Board. 2009. School Community Reports, all schools, 2008-2009.
Halifax Regional School Board. 2009. Superintendent’s Annual Report to Staff 2009, Good Schools to Great Schools.
Dartmouth: HRBE, November.
Halifax Regional School Board. 2011. Superintendent’s Annual Report to the Community for 2011, Good Schools to Great
Schools. Dartmouth: HRBE, November.
Halifax Regional School Board. 2014. Focus on Learning: Grade 3 and 6 Provincial Literacy Assessment Report, HRSB
Report 14-05-1470, May 28.
Halifax Regional School Board. 2015. Creating Conditions to Support Student Success in our Priority Schools, HRSB Report
2015-10-38, Oct. 28.
Halifax Regional School Board. 2017. Culturally Relevant Pedagogy. Report No. 2017-01-04, Feb. 22.
Halifax Regional School Board. 2018. Focus on Learning: Provincial Assessment Results for Grade 6, HRSB Report
2018-02-09, March 7.
Nova Scotia Department of Education and Early Childhood Development. 2018. “Nova Scotia Schools Offering IB/
International Baccalaureate.” Website description and list of schools. See https://ib.ednet.ns.ca/IB-in-NS/schools.
Statistics Canada. 2018. Census Profile, 2016 Census, Halifax Regional Municipality, and various Census Tract Districts,
Halifax Region. Ottawa: Statistics Canada. See www.statcan.gc.ca/census.
Personal Interviews
Arnold, Sarah. 2018. Executive director and founder, Halifax Learning Centre, Sept. 7 and 17.
Dorrington, Cynthia. 2018. Vale & Associates, Halifax, and president, Halifax Chamber of Commerce, Oct 3.
Fraser, Mark. 2018. Executive vice-president, T4G, Halifax, and past president, Halifax Chamber of Commerce, Sept. 21.
LeRoux, Elwin. 2018. Regional director of education, Halifax Regional Centre for Education, Oct. 5.
Mackenzie, Adrianna. 2018. Executive director, Chebucto Community Connections, Sept. 7 and Oct. 3.
McKelvie, Gord. 2018. Principal, J.L. Ilsley High School, Spryfield, Oct. 3 and 9.
O’Handley, Alison. 2018. Executive director, Dartmouth Learning Network, Oct. 5.
Tomie, Susan. 2018. Director, School Administration, Halifax Regional Centre for Education, June 28 and 29.
(Email replies).
Watson-Borg, Betty. 2018. Executive director, Between the Bridges, Dartmouth, Oct. 5.
© 2019 ATLANTIC INSTITUTE FOR MARKET STUDIES
23RAISING THE BAR AND CLOSING THE GAP
Secondary Sources
Adelman, Howard S. and Linda Taylor, eds. 2006. The School Leader’s Guide to Student Learning Supports: New
Directions for Addressing Barriers to Learning. Thousand Oaks, CA: Corwin Publishing.
Alphonso, Caroline and Tavia Grant. 2013. “A Tale of Two Schools: The Correlation between Income and Education in
Toronto,” The Globe and Mail, Nov. 16. See http://www.theglobeandmail.com/news/national/time-to-lead/a-tale-of-
two-schools-the-correlation-between-income-and-education/article15463950/?page=all.
Arnenburg, Patricia Brooks. 2012. “Olsen Named Deputy Minister of Education,” The Chronicle Herald, Aug. 23.
Barr, Robert D. and William H. Parrett. 2007. The Kids Left Behind: Catching Up the Underachieving Children of Poverty.
Bloomington, IN: Solution Tree.
Bennett, Paul W. 2009. The Grammar School: Striving for Excellence in a Public School World. Halifax: Lorimer Publishers.
Bennett, Paul W. 2010. “Breaking a Trail: Atlantic Canada’s First Pathways Program,” Progress, vol. 17, no. 6, November.
Bennett, Paul W. 2014. “Radical Intervention for Faltering Schools,” The Chronicle Herald, April 18.
See http://thechronicleherald.ca/opinion/1201569-radical-intervention-for-faltering-schools.
Bennett, Paul W. 2018. “Postal Code Education: Exploring the Achievement Gap,” The Chronicle Herald, Nov. 21.
Brownell, Marni, Noralou Roos, and Randy Fansoo, et al. 2006. “Is the Glass Half Empty? A Population-Based Perspective
on Socioeconomic Status and Educational Outcomes,” Special Issue, IRPP Choices, Institute for Research on Public
Policy, vol. 12, no. 6, October.
Cape Breton Post. 2013. “Glace Bay Native New Superintendent of Halifax Regional School Board,” Oct. 3.
CBC News Nova Scotia. 2009. Interview with Superintendent Carole Olsen, Nov. 25.
Chebucto Community Connections. 2018. “Pathways to Education,” program history and description. See
www.chebuctoconnections.ca.
Cowley, Peter. 2016. “Why on Earth Would Anyone Want to Rank K-12 Schools in Canada?” Fraser Forum, Feb. 1.
See https://www.fraserinstitute.org/blogs/why-on-earth-would-anyone-want-to-rank-k-12-schools-in-canada.
Davis, Kira. 2016. “Your ZIP Code Should Not Determine Your Success,” Forbes, Sept. 13.
Donohoo, Jenni. 2017. Collective Efficacy: How Educators’ Beliefs Impact Student Learning. Thousand Oaks, CA:
Corwin Publishing.
Elgart, Mark A. 2016. “Student Success Comes Down to Zip Code,” The HuffPost Blog, May 25.
Environics. 2015. PRIZM5 Postal Coode Look-Up Demo. Toronto: Environics Analytics. See https://www.environicsanalytics.
com/en-ca/prizm5.
Environics. 2018. PRIZM5 Snapshots 2018. Updated by Chris Brigger, June 18. Toronto: Environics Analytics.
See https://community.environicsanalytics.com/hc/en-us/articles/360004938971-PRIZM5-Snapshots-2018.
Ferguson, H.B., S. Bovaird, and M.P. Mueller. 2007. “The Impact of Poverty on Educational Outcomes for Children,”
Pediatric Child Health, vol. 12, no. 8, October, 701-706.
Haycock, Kati. 2001. “Closing the Achievement Gap,” Educational Leadership, vol. 58, no. 6, March, 6-11.
Klenavic, Jamy-Ellen. 2013. “Income Distribution in Halifax, Nova Scotia: Is There Increasing Suburbanization of Poverty?”
Research Paper, Dalhousie School of Planning, December.
Laurie, Robert. 2007. “Setting Them Up to Fail? Excellent Marks Don’t Necessarily Lead to Excellent Exam Marks,”
AIMS Commentary. Halifax: AIMS, May 3.
© 2019 ATLANTIC INSTITUTE FOR MARKET STUDIES
24RAISING THE BAR AND CLOSING THE GAP
Ley, D. 1985. Gentrification in Canadian Inner Cities: Patterns, Analysis, Impacts and Policy. Ottawa: CMHC.
Mathews, Jay. 2009. Work Hard. Be Nice: How Two Inspired Teachers Created the Most Promising Schools in America.
Chapel Hill, NC: Algonquin Books.
McLeod, Kimberley. 2015. “Three Ways Every Teacher Can Deliver Culturally Conscious Instruction,” Houston Style
Magazine, March 6.
Mills, Carys. 2015. “Canadian Lifestyles by Postal Code,” Canadian Geographic, March 30.
Owens, Ann. 2018. “Income Segregation between School Districts and Inequality in Students’ Achievement,” Sociology of
Education, vol. 91, no. 1, 1-17.
Pecoskie, Teri. 2014. “Keeping Score,” Hamilton Spectator series, April 13-17. See http://thespecgraphics-hamilton.com/
eqaoLayout/index.html.
People for Education. 2013. “School Success: Measuring What Matters,” Summary of Research by Annie Kidder and David
Cameron (Toronto: People for Education, 2013 and 2017). See https://peopleforeducation.ca/report/broader-measures-
of-success-measuring-what-matters-in-education/#chapter1.
Prouse, Victoria, Jill L. Grant, Martha Radice, Howard Ramos, and Paul Shakotko. 2014. Neighbourhood Change in Halifax
Regional Municipality, 1970 to 2010: Applying the ‘Three Cities’ Model. NCRP Halifax Case Study. Halifax: School of
Planning, Dalhousie University, January.
Raptis, Helen. 2012. “Ending the Reign of Fraser Institute’s School Rankings,” Canadian Journal of Education, vol. 35, no.
1, 187-201. See http://journals.sfu.ca/cje/index.php/cje-rce/article/view/864.
Tough, Paul. 2009. Whatever It Takes: Geoffrey Canada’s Quest to Change Harlem and America. New York: Mariner Books.
United States Department of Education. 2018. Promise Neighborhoods, Washington, DC: U.S. Department of Education.
See https://www2.ed.gov/programs/promiseneighborhoods/index.html.
Willms, J.D. 2003. “Ten Hypotheses about Socioeconomic Gradients and Community Differences in Children’s
Developmental Outcomes,” Ottawa: Human Resources Development Canada.
© 2019 ATLANTIC INSTITUTE FOR MARKET STUDIES
25RAISING THE BAR AND CLOSING THE GAP
ATLANTIC INSTITUTE FOR MARKET STUDIES
Making a Donation
AIMS is a registered charity that operates with the financial support of foundations, corporations and individuals
and offers tax receipts for donations. AIMS does not receive government funding or contract itself for specific
research projects. These policies enhance the Institute’s ability to think freely, hold decision-makers to account
for their choices, and maintain its professional integrity and intellectual independence.
Cost of Research: Each research project has its own parameters with respect to the amount and quality of the
information available, the level of expertise required by the researcher and the amount of time that it takes to
complete the paper. The total cost tends to range between $10,000 - $20,000+ which includes the author’s fee,
oversight and guidance by our Director of Research, proofreading, time, peer review, formatting, communications,
radio ads, and media relations.
AIMS would like to invite you to join our group of valued supporters by filling in the form below. AIMS has been
an influential voice in Canada for over 20 years and those who support our mission and believe in moving it
forward are integral to AIMS’s continued success.
Name:
Organization:
Address:
Telephone:
Email:
Payment Method: Visa Mastercard Cheque
$50 $75 $100 Other
Card Number: Expiry Date:
Card Holder: Signature:
Please mail this form to: Or you may email it to aims@aims.ca
287 Lacewood Drive, If you wish to donate using our online portal,
Suite 204, Halifax, NS go to the Contribute to Atlantic Prosperity page on
B3M 3Y7 our website: aims.ca/donate
© 2019 ATLANTIC INSTITUTE FOR MARKET STUDIES
26You can also read