POMOBUCO ANALYSIS - Design Centre for Sustainability
←
→
Page content transcription
If your browser does not render page correctly, please read the page content below
POMOBUCO ANALYSIS

LARC 504 Sustainable Urban Design Studio   Fall, 2005   Group PoMoBuCo:   Cecilia   David   Yutaka
PoMoBuCo green infrastructure map showing existing critical areas of watershed health and critical areas threatened by development.

 ENVIROMENTAL HEALTH ASSESSMENT                                                                                          HEALTH ASSESSMENT RATING
 WATERSHED HEALTH ASSESSMENT                     manmade factors such as erosion, flooding,                             SPIKE COLOR
 Data represents a preliminary forecast of       pollution, urbanization etc. Forecast values for                         Red - endangered
 watershed health as an indicator of             watershed health are based on population
 environmental health. Data is based on          models, OCPs, The Livable Region Strategic                               Yellow – at risk
 information about the effects of storm water    Plan, orthophotos, riparian integrity data,                              Green – safe
 discharges to small stream ecosystems and       sensitive habitat mapping and land use data.
 assumes historic levels of storm water          d:\arcview \avprojects99\drainage\stormwater_gis\watersheds \figureF
 management are continued. The health of a
 watershed depends on storm water
                                                 4_ws36health_assess_avg24.a                                            SPIKE SIZE The greater the height of the
 management programs and natural and             www.cmn.bc.ca                                                          spike, the greater the importance of the
                                                 The Livable Region Strategic Plan                                      watershed ecosystem (regardless of
                                                                                                                        health)
LARC 504 Sustainable Urban Design Studio        Fall, 2005                     Group PoCoBuCo Cecilia Crondahl Cooper,Yutaka Ikeuchi, David Flanders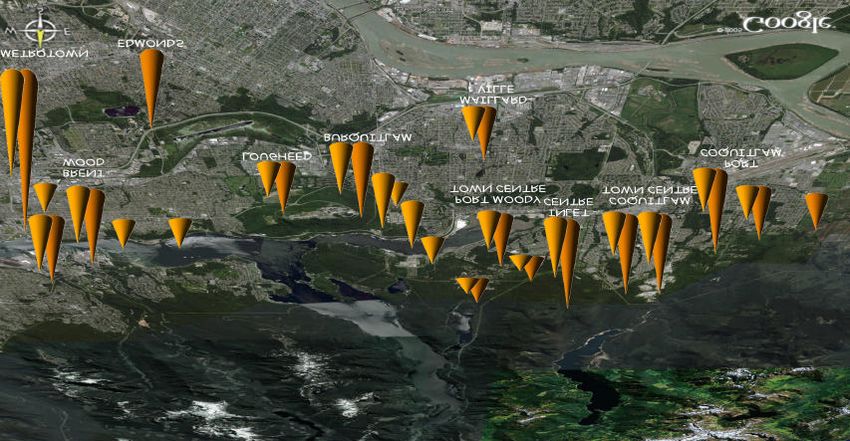
Data Source:
TRANSPORT 2021. 1993. Transportation Implications of a Compact Metropolitan Growth Option. Report No. 14. Greater Vancouver Regional
District. (http://www.gvrd.bc.ca/growth/transport2021/Report14.pdf)
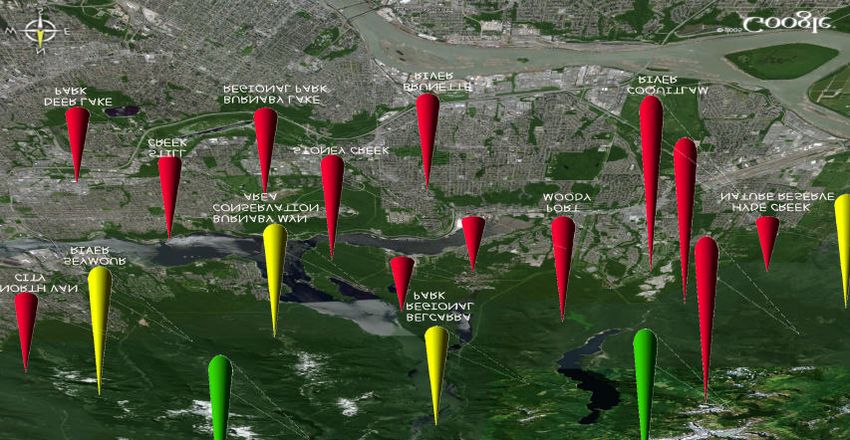
Transportation Hot Spots
Auto Demand in Morning Peak Hours The spikes were put on 1) major intersections The height of each spike shows the volume of
The model was made under the assumption (Clarke x Barnet hwy, Lougheed hwy x auto demand in a relative scale. The following
that the 1991 level of service was maintained, Brunette, Lougheed hwy x Shaughnessy, St. spikes represents the volume of 5,000 vph
so that the immediate impacts on auto Jones x IOCO), 2) major destinations (vehicles-per-hour).
occupancy could be compared on the same (Lougheed Mall, Metrotown, SFU), and 3)
basis between two different time periods. It major bridges (Port Mann Bridge, Second Auto Demand Auto Demand
was also based on the Compact Metropolitan Narrows Bridge).
in 1991 Projection for 2021
Model. Future auto networks were not
available for this analysis.
LARC 504 Sustainable Urban Design Studio Fall, 2005 Group PoMoBuCo: Cecilia, David, Yutaka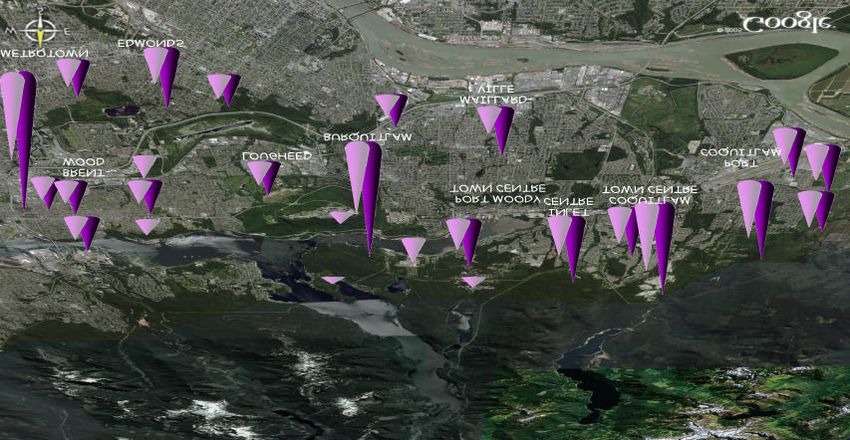
Data Source:
TRANSPORT 2021. 1993. Transportation Implications of a Compact Metropolitan Growth Option. Report No. 14. Greater Vancouver Regional
District. (http://www.gvrd.bc.ca/growth/transport2021/Report14.pdf)
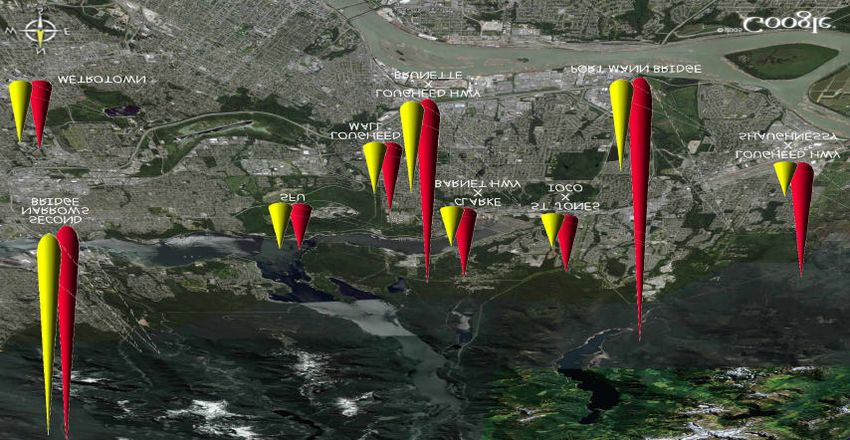
Transit Rider Ship Hot Spots
Transit Demand in Morning Peak Hours The spikes were put on 1) major transfer The height of each spike shows the volume of
The model was made under the assumption points (Columbia & Coquitlam sta., Lougheed transit demand in a relative scale. The following
that the 1991 level of service was maintained, Mall), 2) major destinations (Metrotown, SFU), spikes represents the volume of 5,000 pph
so that the immediate impacts on mode split and 3) major intersections (Clarke x Barnet (passengers-per-hour).
could be compared on the same basis hwy, Second Narrows Bridge, St. Jones x
between two different time periods. It was IOCO). Adding to them, two local Transit Demand Transit Demand
also based on the Compact Metropolitan intersections (Como Lake x Schoolhouse,
Hastings x Willingdon) were selected for in 1991 Projection for 2021
Model. Future transit networks were not
available for this analysis. comparison.
LARC 504 Sustainable Urban Design Studio Fall, 2005 Group PoMoBuCo: Cecilia, David, Yutaka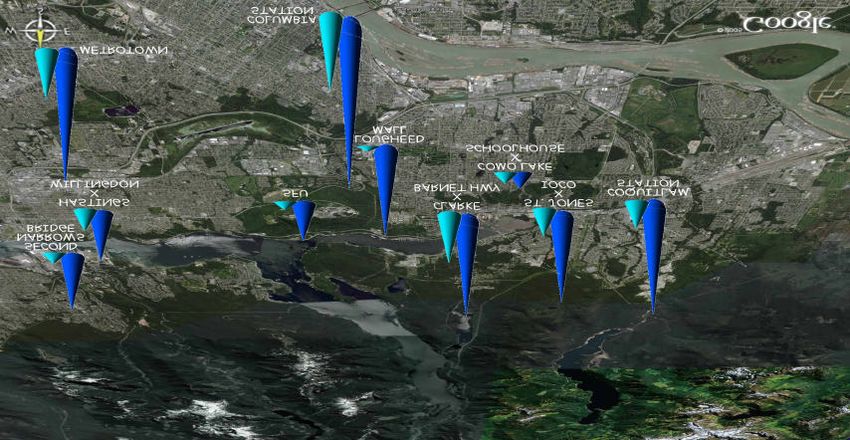
Data Source:
 Data collected from Municipal O.C.P.s, Provincial census/statistical documents, the Livable Regions Strategic Plans
 and SmartGrowth B.C.

 Population Hot Spots
 Where people are in 2001 and where they’ll be in about 2021
 Mapped data for current population is based on census and
 population data which is then divided based on current size of
 town and village centres. Most population density in non-town-                                                    Current                  Projected
 centre and non-village-centre is assumed to be very low density                                                  Population                Population
 suburban and is not considered to be a “hot spot”. Land-use areas
 designated for higher density residential development have been
 located and their future populations projected based on their
 expected growths outlined in Official Community Plans.

LARC 504 Sustainable Urban Design Studio        Fall, 2005                            Group: Cecilia Crondahl Cooper, Yutaka Ikeuchi, David Flanders
Data Source:
 Data collected from Municipal O.C.P.s, Provincial census/statistical documents, the Livable Regions Strategic Plans
 and SmartGrowth B.C.

 Job Hot Spots
 Where people are working in 2001 and where they’ll be working in
 about 2021
 Mapped data for current job market is based on census and official
 community plan data which is then divided based on current size of town
 and village centres. Most of the job market and job growth in non-town-                                           Current Job              Projected
 centre and non-village-centre is assumed to be very low density suburban                                           Hotspots               Job Hotspots
 and is not considered to be a “hot spot”. Land-use areas designated for
 higher intensity commercial development have been located and
 projections are based on their expected growths outlined in Official
 Community Plans.

LARC 504 Sustainable Urban Design Studio        Fall, 2005                            Group: Cecilia Crondahl Cooper, Yutaka Ikeuchi, David Flanders
You can also read